Home Blog Page 1232

Widest and Highest-Grade Caesium Intercepts to Date at Vega including 28.0 m at 8.05% Cs2O and 2.2 m at 26.48% Cs2O

MONTREAL, Feb. 4, 2026 /PRNewswire/ — February 4, 2026 – Sydney, Australia

Highlights

  • Widest and highest-grade caesium intercepts reported to date at theVega Zone:
    • 28.0 m at 8.05%Cs2O including 18.3 m at 11.84%Cs2O (CV25-948).
    • 18.2 m at 7.13%Cs2O including 3.0 m at 23.63%Cs2O (CV25-1023).
    • 5.5 m at 14.83% Cs2O including 2.2 m at 26.48% Cs2O (CV25-1006)
      • Includes highest-grade sample reported to date at 29.79% Cs2O
    • 11.5 m at 1.75% Cs2O including 2.9 m at 3.88% Cs2O (CV25-1025).
    • 16.1 m at 1.43% Cs2O including 1.3 m at 11.08% Cs2O (CV25-1010).
  • Interpreted footprint and width of caesium mineralization at Vega expanded.
  • High-grade caesium intercept from in-fill drilling at the Rigel Zone:
    • 6.2 m at 5.12%Cs2O including 2.1 m at 13.68%Cs2O (CV25-914).
  • High-grade caesium confirmed at the newly-discovered Helios Zone:
    • 1.0 m at 21.52% Cs2O (CV25-975).
  • Caesium assay results reported in this announcement for 8,596 m (52 holes) drilled at the CV13 Pegmatite – including the Vega, Rigel, and Helios Zones.
    • Caesium assay results for 1,176 m (7 holes) from the Vega and Helios Zones remain pending.

Darren L. Smith, Executive Vice President Exploration, comments: “Shaakichiuwaanaan continues to deliver impressive results, with the 2025 drill campaign returning the highest caesium grades reported to date at the Property – including a peak assay of 29.8% Cs2O – and confirming high-grade caesium at the newly discovered Helios Zone. With multiple intercepts exceeding 25% Cs2O, dominant pollucite mineralogy, and scale already demonstrated through defined Mineral Resources, the opportunity for the Company to further enhance shareholder value through this caesium deposit is meaningful.”

“We look forward to reporting caesium results for the remaining holes outstanding and integrating this opportunity into the overall Project development scenario,” added Mr. Smith. 
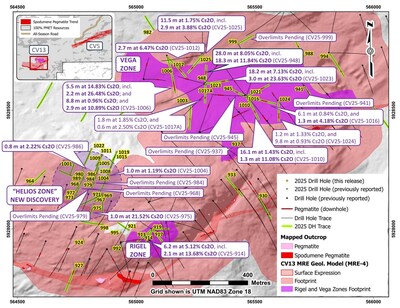
Figure 1: Drill hole result highlights at the CV13 Pegmatite (caesium).

PMET Resources Inc. (the “Company” or “PMET”) (TSX: PMET) (ASX: PMT) (OTCQX: PMETF) (FSE: R9GA) is pleased to report caesium assay results for diamond drill holes completed at the CV13 Pegmatite, as part of its extensive 2025 drill campaign at the Company’s wholly-owned Shaakichiuwaanaan Property (the “Property” or “Project”), located in the Eeyou Istchee James Bay region of Quebec.

In addition to being one of the largest lithium-tantalum pegmatite Mineral Resources1 and lithium pegmatite Mineral Reserves2 globally, the Property also hosts the world’s largest in-situ pollucite-hosted caesium pegmatite Mineral Resource, with 0.69 Mt at 4.40% Cs2O (Indicated) and 1.70 Mt at 2.40% Cs2O (Inferred). The CV13 Pegmatite, host to the caesium Mineral Resource, is located ~3 km along trend from the CV5 Pegmatite, which is situated approximately 13 km south of the regional Trans-Taiga Road and powerline infrastructure corridor, and is accessible year-round by road.

_____________________________
1 The Consolidated MRE (CV5 + CV13 pegmatites), which includes the Rigel and Vega caesium zones, totals 108.0 Mt at 1.40% Li2O, 0.11% Cs2O, 166 ppm Ta2O5, and 66 ppm Ga, Indicated, and 33.4 Mt at 1.33% Li2O, 0.21% Cs2O, 155 ppm Ta2O5, and 65 ppm Ga, Inferred, and is reported at a cut-off grade of 0.40% Li2O (open-pit), 0.60% Li2O (underground CV5), and 0.70% Li2O (underground CV13). A grade constraint of 0.50% Cs2O was used to model the Rigel and Vega caesium zones. Effective Date is June 20, 2025 (through CV24-787). Mineral Resources are not Mineral Reserves as they do not have demonstrated economic viability. Mineral Resources are inclusive of Mineral Reserves.
2 Probable Mineral Reserve of 84.3 Mt at 1.26% Li2O at the CV5 Pegmatite with a cut-off grade is 0.40% Li2O (open-pit) and 0.70% Li2O (underground). Underground development and open-pit marginal tonnage containing material above 0.37% Li2O are also included in the statement. The Effective Date is September 11, 2025. See Feasibility Study news release dated October 20, 2025.

As part of its expansive 2025 drill campaign at Shaakichiuwaanaan, the Company completed further delineation drilling at the Vega and Rigel caesium zones. This exploration campaign also resulted in the discovery of the Helios Caesium Zone. All three caesium zones – Vega, Rigel, and Helios – are situated within the CV13 Pegmatite and are largely coincident with lithium and tantalum mineralization.

Core assay results for caesium for 8,596 m (52 holes) at the CV13 Pegmatite are reported in this announcement, including prior pending overlimit3 analysis (see Figure 1, Table 1, Table 2, Table 3). Core assay results for caesium for 1,176 m (7 holes), covering the Vega and Helios zones, remain to be reported. Results for lithium and tantalum for all drill holes completed in 2025 at Shaakichiuwaanaan were previously reported (see news releases dated December 14, 2025 and January 21, 2026). All reported widths are core length (i.e., apparent and not true width).

Vega Caesium Zone

The strongest caesium results to date from the Property were returned from the 2025 drill campaign at the Vega Zone, including ten (10) individual samples grading >20% Cs2O and four (4) grading >25% Cs2O to a peak of 29.79%, as well as multi-metre intercepts including 3.0 m at 23.63% Cs2O, 3.0 m at 23.05 Cs2O, and 2.2 m at 26.48% Cs2O (see Table 1, Figure 3, and Figure 4). Most of the holes were completed as infill, targeting a central high-grade core that had been interpreted from previous drilling. However, several holes were also completed at the margins of the modelled zone (e.g., CV25-1006). Based on the assay results reported in this announcement, the interpreted footprint and width of the caesium mineralization at Vega have increased. At Vega, drill result highlights for caesium include:

  • 28.0 m at 8.05%Cs2O including 18.3 m at 11.84%Cs2O (CV25-948), see Figure 2.
  • 18.2 m at 7.13%Cs2O including 3.0 m at 23.63%Cs2O (CV25-1023), see Figure 3.
  • 5.5 m at 14.83% Cs2O including 2.2 m at 26.48% Cs2O (CV25-1006), see Figure 4.
    • Includes highest-grade sample reported to date at the Project – 29.79% Cs2O
  • 11.5 m at 1.75% Cs2O including 2.9 m at 3.88% Cs2O (CV25-1025).
  • 16.1 m at 1.43% Cs2O including 1.3 m at 11.08% Cs2O (CV25-1010).
  • 8.8 m at 0.96% Cs2O and 2.9 m at 10.89% Cs2O (CV25-1006).
  • 9.8 m at 0.93% Cs2O and 1.2 m at 1.33% Cs2O (CV25-1024).
  • 2.7 m at 6.47% Cs2O (CV25-1012)

________________________________
3 Assay results which exceed the upper detection limit (1.06% Cs2O) of the base analytical package require subsequent analysis using a different analytical package to determine the Cs grade (i.e., overlimit analysis).

Caesium results remain to be reported from Vega for multiple holes with overlimit4 analysis pending over intervals of 0.5 to 2.3 m.
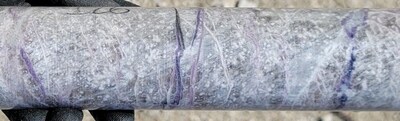
Figure 2: Pollucite with late stage lepidolite (purple) and spodumene/pollucite (white) veining displaying classic “tapioca” texture (white blebs) at a depth of ~126 m in drill hole CV25-948 from the Vega Zone. Core grades 1.9 m at 17.81% Cs2O (125.0 m to 126.9 m) within a wider mineralized interval of 28.0 m at 8.05% Cs2O (116.5 m to 144.5 m)
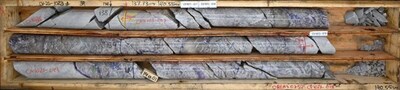


Figure 3: Large pollucite crystals in drill hole CV25-1023 from the Vega Zone. Core grades 3.0 m at 23.63% Cs2O (from 138.1 m to 141.1 m) within a wider mineralized interval of 18.2 m at 7.13% Cs2O (138.1 m to 156.2 m)
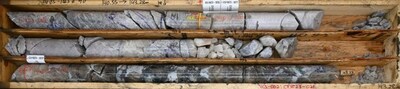


Figure 3: Large pollucite crystals in drill hole CV25-1023 from the Vega Zone. Core grades 3.0 m at 23.63% Cs2O (from 138.1 m to 141.1 m) within a wider mineralized interval of 18.2 m at 7.13% Cs2O (138.1 m to 156.2 m)

______________________________
4 Assay results which exceed the upper detection limit (1.06% Cs2O) of the base analytical package require subsequent analysis using a different analytical package to determine the Cs grade (i.e., overlimit analysis).

Figure 4: Massive pollucite mineralization in drill hole CV25-1006 from the Vega Zone. Core grades 2.2 m at 26.48% Cs2O (165.7 m to 167.8 m), including 1.0 m at 29.79% Cs2O, within a wider mineralized interval of 5.5 m at 14.83% Cs2O (162.3 m to 167.8 m)

Helios Caesium Zone (A NEW 2025 DISCOVERY)

High-grade caesium mineralization has been confirmed at the Helios discovery (Table 1, Figure 5). Mineralization has been traced over an area of ~180 m x 80 m at ~1 to 3 m thickness and comes within at least 25 m from surface (vertical depth). Mineralization remains open in several areas. At Helios, drill result highlights to date for caesium include:

  • 1.0 m at 21.52% Cs2O (CV25-975), see Figure 5.
  • 0.8 m at 2.22% Cs2O (CV25-986).
  • 1.0 m at 1.19% Cs2O (CV25-1004).

Caesium results remain to be reported from Helios for multiple holes with overlimit5 analysis pending over intervals of 0.5 m to 4.9 m. 

Figure 5: Massive pollucite mineralization in drill hole CV25-975 from the Helio Zone. Core grades 1.0 m at 21.52% Cs2O (36.5 m to 37.5 m).

Rigel Caesium Zone

Several holes were completed as infill at the Rigel Zone with results presented in Table 1. The best caesium result from the program was 6.2 m at 5.12% Cs2O including 2.1 m at 13.68% Cs2O in drill hole CV25-914. The assay results from the 2025 drill holes have altered the interpreted eastern footprint of the Rigel Zone, which will be updated as part of the next Mineral Resource Estimate iteration. Some of the highest caesium grades to date have been reported from the Rigel Zone, including 1.1 m at 26.61% Cs2O within a wider zone of 3.2 m at 10.24% Cs2O (CV23-204).

__________________________________
5 Assay results which exceed the upper detection limit (1.06% Cs2O) of the base analytical package require subsequent analysis using a different analytical package to determine the Cs grade (i.e., overlimit analysis).

Next Steps

Caesium assays results for 1,176 m (7 holes) remain to be reported out of the total 57,024 m (245 holes) completed over the 2025 drill campaign at Shaakichiuwaanaan. These remaining results will be reported once received and compiled. The lithium and tantalum assay results have previously been reported for all 245 holes (see news releases dated December 14, 2025 and January 21, 2026).

The geology team is currently interpreting and working with the 2025 drill hole data to advance the host rock and pegmatite geological models for the Project. The work is focused on the CV5 and CV13 pegmatites – including the Vega, Rigel, and Helios caesium zones – ahead of updates to their respective block models and subsequent Mineral Resource Estimate. The Company is also advancing towards an updated Feasibility Study for the CV5 Pegmatite scheduled for the second half of 2026. The data will also inform an underground bulk sample of mineralized pegmatite at CV5, which is currently being permitted.

Table 1: Core assay summary for caesium zones in drill holes reported herein at the CV13 Pegmatite.

Zone

Hole ID

From
(m)

To
(m)

Interval
(m)

Li2O
(%)

Cs2O
(%)

Ta2O5
(ppm)

Vega

CV25-948

116.5

144.5

28.0

1.47

8.05

225

incl.

116.5

134.8

18.3

1.3

11.84

117

or

120.2

123.1

3.0

0.97

23.05

58

Vega

CV25-1006

151.0

153.9

2.9

1.38

10.89

911

162.3

167.8

5.5

1.19

14.83

243

incl.

165.7

167.8

2.2

0.34

26.48

13

or

165.7

166.7

1.0

0.43

29.79

24

179.1

180.8

1.7

0.61

1.38

187

202.2

211.0

8.8

4.57

0.96

166

Vega

CV25-1010

130.8

146.9

16.1

2.82

1.43

114

incl.

130.8

132.1

1.3

0.79

11.08

6

incl.

135.9

136.7

0.8

0.80

3.34

87

incl.

143.6

144.8

1.3

5.78

2.69

96

Vega

CV25-1012

143.1

145.8

2.7

0.30

6.47

291

Vega

CV25-1016

140.5

146.6

6.1

1.35

0.84

146

224.0

225.3

1.3

0.02

4.18

477

Vega

CV25-1017A

153.6

155.3

1.8

5.61

1.85

308

159.3

159.9

0.6

3.55

2.50

42

Vega

CV25-1021

142.2

142.7

0.5

3.10

1.05

249

Vega

CV25-1023

138.1

156.2

18.2

2.31

7.13

206

incl.

138.1

149.2

11.2

1.60

11.09

76

or

138.1

141.1

3.0

0.59

23.63

18

Vega

CV25-1024

89.8

91.0

1.2

0.76

1.33

160

108.5

118.3

9.8

3.49

0.93

214

Vega

CV25-1025

136.4

147.9

11.5

1.57

1.75

279

incl.

136.4

139.3

2.9

0.39

3.88

161

incl.

142.6

144.1

1.5

1.44

4.24

644

incl.

147.0

147.9

0.8

3.01

1.32

97

Rigel

CV25-913

92.8

97.1

4.3

2.62

0.51

1,618

Rigel

CV25-914

73.0

79.2

6.2

1.34

5.12

533

incl.

73.0

75.0

2.1

0.39

13.68

799

Helios

CV25-975

36.5

37.5

1.0

1.82

21.52

0

Helios

CV25-986

68.3

69.1

0.8

3.90

2.22

227

Helios

CV25-1004

53.9

55.0

1.0

3.04

1.19

106


(1) All intervals are core length (i.e., apparent and not true width) and presented for all pegmatite intervals >1% Cs2O. A 0.5% Cs2O cut-off is used to constrain the pegmatite interval.  


Table 2: Core assay summary for lithium, caesium, and tantalum in pegmatite intervals >2 m at the CV13 Pegmatite.

Hole ID

From
(m)

To
(m)

Interval
(m)

Li2O
(%)

Cs2O
(%)

Ta2O5
(ppm)

Comments

CV25-913

87.3

102.3

15.0

1.15

0.21

1,105

incl.

92.8

100.7

7.9

2.15

0.38

1,974

104.5

106.5

2.0

0.21

0.00

510

CV25-914

73.0

82.6

9.7

1.34

3.36

752

CV25-917

81.9

85.2

3.4

0.07

0.01

364

88.9

96.1

7.2

0.08

0.05

131

CV25-919

74.4

85.9

11.5

2.87

0.10

413

incl.

76.5

83.4

6.9

4.40

0.11

544

CV25-967

100.0

104.4

4.4

0.14

0.00

348

CV25-969

No >2 m pegmatite intersections

CV25-971

No >2 m pegmatite intersections

CV25-973

25.0

37.1

12.2

0.38

0.19

90

CV25-975

35.7

38.5

2.8

0.89

7.52

198

CV25-977

29.0

35.4

6.4

2.61

0.11

251

incl.

31.3

35.4

4.1

3.94

0.09

308

CV25-980

50.5

53.1

2.6

2.54

0.07

70

CV25-986

55.3

73.8

18.4

1.19

0.17

132

incl.

64.9

71.8

6.9

2.49

0.35

191

83.1

85.3

2.2

0.17

0.06

289

CV25-989

83.1

88.3

5.2

0.17

0.06

522

CV25-992

44.3

56.8

12.4

1.65

0.05

109

CV25-995

No >2 m pegmatite intersections

CV25-996

No >2 m pegmatite intersections

CV25-998

No >2 m pegmatite intersections

CV25-1000

No >2 m pegmatite intersections

CV25-1001

No >2 m pegmatite intersections

CV25-1004

51.1

60.2

9.1

0.87

0.16

106

CV25-1005

94.1

97.0

2.9

0.16

0.01

445

CV25-1008

46.8

55.9

9.1

1.44

0.05

100

incl.

50.6

55.4

4.8

2.69

0.05

162

CV25-1009

85.6

87.9

2.2

0.31

0.01

397

CV25-1010

128.7

150.8

22.1

2.31

1.07

127

incl.

138.9

147.9

9.0

4.18

0.58

129

CV25-1011

244.7

246.9

2.2

0.39

0.01

108

CV25-1012

141.2

175.5

34.3

1.12

0.64

361

incl.

164.4

175.5

11.0

1.97

0.18

396

CV25-1015

96.2

100.0

3.8

0.08

0.01

2,276

103.5

106.4

2.9

0.14

0.01

338

CV25-1016

119.4

169.1

49.7(3)

2.08

0.18

129

incl.

135.0

135.7

0.7

7.71

0.09

10

incl.

154.5

158.6

4.0

5.16

0.11

83

CV25-1017

No >2 m pegmatite intersections

Hole lost

CV25-1017A

146.0

170.7

24.7

4.00

0.30

126

incl.

150.3

157.3

7.0

6.04

0.64

178

incl.

162.4

162.9

0.6

7.02

0.05

12

CV25-1019

No >2 m pegmatite intersections

CV25-1021

122.8

148.3

25.6

1.45

0.11

118

incl.

129.9

148.3

18.4

1.97

0.09

129

151.4

158.6

7.2(3)

1.52

0.06

132

CV25-1022

No >2 m pegmatite intersections

CV25-1023

133.4

164.6

31.2

2.07

4.21

144

incl.

147.6

155.5

7.9

3.86

1.51

374

incl.

159.6

160.7

1.1

7.32

0.27

2

or

159.6

162.3

2.7

5.87

0.20

22

CV25-1024

87.6

102.6

15.0

0.15

0.14

442

106.2

126.8

20.6

3.31

0.51

173

incl.

116.1

124.8

8.8

5.02

0.32

107

CV25-1025

134.9

162.2

27.3

1.57

0.78

679

incl.

144.6

147.9

3.3

4.08

0.55

304

incl.

157.0

162.2

5.2

3.03

0.06

368

CV25-921

No >2 m pegmatite intersections

Geomechanical hole

CV25-924

111.7

119.6

7.9

0.26

0.04

32

Geomechanical hole

CV25-927

16.9

44.8

27.9

1.87

0.08

298

Geomechanical hole

incl.

22.9

34.8

11.9

2.94

0.12

217

46.7

54.2

7.5

0.41

0.03

198

129.6

133.8

4.2

0.02

0.01

101

CV25-930

126.1

128.0

2.0

0.01

0.04

23

Geomechanical hole

CV25-933

146.5

172.6

26.1(3)

0.56

0.02

59

Geomechanical hole

incl.

149.5

156.7

7.2

1.91

0.03

57

177.2

179.8

2.6

0.06

0.01

36

206.5

210.5

3.9

0.03

0.01

120

CV25-948

113.8

153.9

40.1

1.97

5.64

232

Geomechanical hole

incl.

143.9

153.2

9.3

3.66

0.14

272

CV25-953

No >2 m pegmatite intersections

Geomechanical hole

CV25-957

162.6

167.9

5.3

1.06

0.02

53

Geomechanical hole

CV25-962

75.5

92.4

16.9

0.88

0.05

48

Geomechanical hole

CV25-964

195.0

202.7

7.7

0.62

0.04

47

Geomechanical hole

CV25-976

No >2 m pegmatite intersections

Geomechanical hole

CV25-982

No >2 m pegmatite intersections

Geomechanical hole

CV25-988

104.4

109.0

4.6

0.23

0.02

108

Geomechanical hole

119.9

136.9

16.9

0.08

0.01

120

CV25-994

130.8

139.4

8.6

0.11

0.01

81

Geomechanical hole

CV25-1003

116.2

122.8

6.6

0.27

0.05

152

Geomechanical hole

CV25-1006

136.7

138.9

2.2

0.12

0.07

158

Geomechanical hole

151.0

153.9

2.9

1.38

10.89

911

160.0

215.0

55.0

2.58

1.80

267

incl.

183.9

213.9

29.9

4.11

0.44

340


(1) All intervals are core length (i.e., apparent and not true width) and presented for all pegmatite intervals >2 m; (2) Collared in pegmatite; (3) Includes minor intervals of non-pegmatite units (typically <3 m).


Table 3: Attributes for drill holes reported herein at the Shaakichiuwaanaan Property.

Hole ID

Substrate

Total
Depth
(m)

Azimuth
(°)

Dip
(°)

Easting

Northing

Elevation
(m)

Core
Size

Area

CV25-913

Land

119.1

230

-47

565067.4

5927998.6

429.0

HQ

CV13

CV25-914

Land

110.0

205

-60

565068.5

5927998.2

429.0

HQ

CV13

CV25-917

Land

110.0

140

-45

565070.0

5927997.7

428.9

HQ

CV13

CV25-919

Land

100.9

90

-48

565070.6

5928000.5

429.2

HQ

CV13

CV25-921

Land

119.0

300

-65

564969.3

5927995.9

425.5

HQ3

CV13

CV25-924

Land

143.0

88

-20

564781.0

5927945.9

411.0

HQ3

CV13

CV25-927

Land

205.9

200

-60

564741.3

5927833.1

394.7

HQ3

CV13

CV25-930

Land

164.1

145

-50

565514.7

5928132.2

412.6

HQ3

CV13

CV25-933

Land

254.0

140

-65

565379.2

5928220.5

432.3

HQ3

CV13

CV25-948

Land

220.9

0

-70

565294.0

5928610.3

390.2

HQ3

CV13

CV25-953

Land

155.0

345

-70

564235.6

5928355.1

414.4

HQ3

CV13

CV25-957

Land

187.7

200

-65

564176.9

5928325.9

414.4

HQ3

CV13

CV25-962

Land

164.0

200

-55

564218.5

5928149.5

403.2

HQ3

CV13

CV25-964

Land

256.8

50

-70

564552.5

5928183.5

415.7

HQ3

CV13

CV25-967

Land

140.0

220

-70

564859.3

5928147.3

427.5

NQ

CV13

CV25-969

Land

125.9

180

-45

564859.6

5928146.5

427.5

NQ

CV13

CV25-971

Land

146.1

240

-45

564858.5

5928147.1

427.5

NQ

CV13

CV25-973

Land

86.1

200

-65

564744.8

5928140.9

421.1

NQ

CV13

CV25-975

Land

58.9

200

-45

564822.9

5928104.3

423.8

NQ

CV13

CV25-976

Land

146.2

230

-60

564991.6

5928524.0

407.0

HQ3

CV13

CV25-977

Land

79.8

20

-45

564747.0

5928143.9

421.5

NQ

CV13

CV25-980

Land

121.9

0

-75

564777.9

5928210.7

425.8

NQ

CV13

CV25-982

Land

151.8

325

-65

565075.2

5928839.7

396.8

HQ3

CV13

CV25-986

Land

109.3

20

-55

564821.9

5928196.6

427.0

NQ

CV13

CV25-988

Land

198.2

330

-70

565706.4

5928728.9

384.9

HQ3

CV13

CV25-989

Land

161.0

280

-50

564777.3

5928209.8

425.9

NQ

CV13

CV25-992

Land

79.8

180

-85

564923.3

5927904.0

409.0

NQ

CV13

CV25-994

Land

173.0

145

-52

565816.3

5928738.5

384.3

HQ3

CV13

CV25-995

Land

176.0

200

-85

564935.9

5927984.4

421.5

NQ

CV13

CV25-996

Land

160.9

158

-45

566373.5

5928633.7

365.1

NQ

CV13

CV25-998

Land

191.0

275

-45

564858.4

5928019.3

417.6

NQ

CV13

CV25-1000

Land

316.6

158

-45

566411.5

5928545.2

359.0

NQ

CV13

CV25-1001

Land

160.3

20

-70

564724.3

5928234.5

424.3

NQ

CV13

CV25-1003

Land

193.8

180

-52

565230.0

5928538.9

395.6

HQ3

CV13

CV25-1004

Land

188.0

200

-55

564881.3

5928226.8

431.2

NQ

CV13

CV25-1005

Land

124.9

200

-45

564855.5

5928311.2

427.4

NQ

CV13

CV25-1006

Land

227.6

165

-52

565131.6

5928724.8

395.5

HQ3

CV13

CV25-1008

Land

185.0

200

-80

564881.6

5928227.2

431.1

NQ

CV13

CV25-1009

Land

151.9

200

-68

564855.7

5928311.7

427.4

NQ

CV13

CV25-1010

Land

211.7

150

-60

565464.9

5928557.7

387.9

HQ

CV13

CV25-1011

Land

299.3

200

-90

564855.4

5928312.1

427.3

NQ

CV13

CV25-1012

Land

230.0

135

-60

565131.6

5928725.0

395.4

HQ

CV13

CV25-1015

Land

149.0

200

-45

564918.4

5928324.9

426.7

NQ

CV13

CV25-1016

Land

235.9

103

-60

565465.2

5928558.0

387.9

HQ

CV13

CV25-1017

Land

26.0

180

-70

565292.0

5928611.5

390.1

HQ

CV13

CV25-1017A

Land

223.7

180

-70

565291.7

5928611.4

390.2

HQ

CV13

CV25-1019

Land

166.8

200

-70

564918.5

5928325.3

426.7

NQ

CV13

CV25-1021

Land

206.0

65

-60

565465.0

5928558.4

387.9

HQ

CV13

CV25-1022

Land

133.9

200

-45

564812.1

5928337.3

423.6

NQ

CV13

CV25-1023

Land

191.0

85

-60

565293.2

5928611.7

390.0

HQ

CV13

CV25-1024

Land

149.1

180

-57

565600.4

5928536.8

385.4

HQ

CV13

CV25-1025

Land

208.8

215

-62

565280.4

5928733.5

388.4

HQ

CV13


(1) Coordinate system NAD83 / UTM zone 18N; (2) All drill holes are diamond drill; (3) Azimuths and dips presented are those ‘planned’ and may vary off collar/downhole.


Quality Assurance / Quality Control (QAQC)

A Quality Assurance / Quality Control protocol following industry best practices was incorporated into the program and included systematic insertion of quartz blanks and certified/standard reference materials into sample batches at a rate of approximately 5% each. Additionally, analysis of pulp-split sample duplicates was completed to assess analytical precision, and external (secondary) laboratory pulp-split duplicates were prepared at the primary lab for subsequent check analysis and validation.

All core samples collected were shipped to SGS Canada’s laboratory in Val-d’Or, QC, for sample preparation (code PRP90 special) which includes drying at 105°C, crush to 90% passing 2 mm, riffle split 250 g, and pulverize 85% passing 75 microns. The pulps were shipped by air to SGS Canada’s laboratory in Burnaby, BC, where the samples were homogenized and subsequently analyzed for multi-element (including Li, Ta, and Cs) using sodium peroxide fusion with ICP-AES/MS finish (codes GE_ICP91A50 and GE_IMS91A50). Overlimits for Cs were completed at SGS Canada’s laboratory in Lakefield, ON, by borate-fusion XRF (code GC_XRF76V).

Qualified/Competent Person

The technical and scientific information in this news release that relates to the Mineral Resource  Estimate and exploration results for the Company’s properties is based on, and fairly represents, information compiled by Mr. Darren L. Smith, M.Sc., P.Geo., who is a Qualified Person as defined by National Instrument 43-101 – Standards of Disclosure for Mineral Projects (“NI 43-101”), and member in good standing with the Ordre des Géologues du Québec (Geologist Permit number 01968), and with the Association of Professional Engineers and Geoscientists of Alberta (member number 87868). Mr. Smith has reviewed and approved the related technical information in this news release.

Mr. Smith is an Executive and Vice President of Exploration for PMET Resources Inc. and holds common shares, Restricted Share Units (RSUs), Performance Share Units (PSUs), and options in the Company.

The information in this news release that relates to the Mineral Reserve Estimate and Feasibility Study is based on, and fairly represents, information compiled by Mr. Frédéric Mercier-Langevin, Ing. M.Sc., who is a Qualified Person as defined by NI 43-101, and member in good standing with the Ordre des Ingénieurs du Québec. Mr. Mercier-Langevin has reviewed and approved the related technical information in this news release.

Mr. Mercier-Langevin is the Chief Operating and Development Officer for PMET Resources Inc. and holds common shares, RSUs, PSUs, and options in the Company.

About PMET Resources Inc.

PMET Resources Inc. is a pegmatite critical mineral exploration and development company focused on advancing its district-scale 100%-owned Shaakichiuwaanaan Property located in the Eeyou Istchee James Bay region of Quebec, Canada, which is accessible year-round by all-season road and proximal to regional hydro-power infrastructure.

In late 2025, the Company announced a positive lithium-only Feasibility Study on the CV5 Pegmatite for the Shaakichiuwaanaan Property and declared a maiden Mineral Reserve of 84.3 Mt at 1.26% Li2O (Probable)6. The study outlines the potential for a competitive and globally significant high-grade lithium project targeting up to ~800 ktpa spodumene concentrate using a simple Dense Media Separation (“DMS”) only process flowsheet. Further, the results highlight Shaakichiuwaanaan as a potential North American critical mineral powerhouse with significant opportunity for tantalum and caesium in addition to lithium.

The Project hosts a Consolidated Mineral Resource7 totalling 108.0 Mt at 1.40% Li2O and 166 ppm Ta2O5 (Indicated) and 33.4 Mt at 1.33% Li2O and 155 ppm Ta2O5 (Inferred), and ranks as the largest8 lithium pegmatite resource in the Americas, and in the top ten globally. Additionally, the Project hosts the world’s largest pollucite-hosted caesium pegmatite Mineral Resource at the Rigel and Vega zones with 0.69 Mt at 4.40% Cs2O (Indicated), and 1.70 Mt at 2.40% Cs2O (Inferred).

For further information, please contact us at info@pmet.ca or by calling +1 (604) 279-8709, or visit www.pmet.ca. Please also refer to the Company’s continuous disclosure filings, available under its profile at www.sedarplus.ca and www.asx.com.au, for available exploration data.

This news release has been approved by

“KEN BRINSDEN”                                                         

Kenneth Brinsden, President, CEO, & Managing Director

Olivier Caza-Lapointe
Head, Investor Relations
T: +1 (514) 913-5264
E: ocazalapointe@pmet.ca

___________________________
6 See Feasibility Study news release dated October 20, 2025. Probable Mineral Reserve cut-off grade is 0.40% Li2O (open-pit) and 0.70% Li2O (underground). Underground development and open-pit marginal tonnage containing material above 0.37% Li2O are also included in the statement. Effective Date of September 11, 2025.
7 The Consolidated MRE (CV5 + CV13 pegmatites), which includes the Rigel and Vega caesium zones, totals 108.0 Mt at 1.40% Li2O, 0.11% Cs2O, 166 ppm Ta2O5, and 66 ppm Ga, Indicated, and 33.4 Mt at 1.33% Li2O, 0.21% Cs2O, 155 ppm Ta2O5, and 65 ppm Ga, Inferred, and is reported at a cut-off grade of 0.40% Li2O (open-pit), 0.60% Li2O (underground CV5), and 0.70% Li2O (underground CV13). A grade constraint of 0.50% Cs2O was used to model the Rigel and Vega caesium zones. The Effective Date is June 20, 2025 (through drill hole CV24-787). Mineral Resources are not Mineral Reserves as they do not have demonstrated economic viability. Mineral Resources are inclusive of Mineral Reserves.
8 Determination based on Mineral Resource data, sourced through July 11, 2025, from corporate disclosure.

Disclaimer for Forward-Looking Information

This news release contains “forward-looking statements” and “forward-looking information” within the meaning of applicable securities laws.

All statements, other than statements of present or historical facts, are forward-looking statements. Forward-looking statements involve known and unknown risks, uncertainties and assumptions and accordingly, actual results could differ materially from those expressed or implied in such statements. You are hence cautioned not to place undue reliance on forward-looking statements. Forward-looking statements are typically identified by words such as “plan”, “development”, “growth”, “continued”, “intentions”, “expectations”, “emerging”, “evolving”, “strategy”, “opportunities”, “anticipated”, “trends”, “potential”, “outlook”, “ability”, “additional”, “on track”, “prospects”, “viability”, “estimated”, “reaches”, “enhancing”, “strengthen”, “target”, “believes”, “next steps” or variations of such words and phrases or statements that certain actions, events or results “may”, “could”, “would”, “might” or “will” be taken, occur or be achieved. 

Forward-looking statements include, but are not limited to, statements concerning the interpretation of the results from exploration, the exploration and development potential of various zones, including CV4, CV5, CV12, and CV13, the remaining results from the 2025 drill campaign and future exploration work, including the anticipated results therefrom, the advancement of the host rock and pegmatite geological models for the Project, the bulk sample of mineralized pegmatite at CV5, which is currently being permitted, and the preparation and release of an updated Feasibility Study in the second half of 2026.

Forward-looking statements are based upon certain assumptions and other important factors that, if untrue, could cause actual results to be materially different from future results expressed or implied by such statements. There can be no assurance that forward-looking statements will prove to be accurate. Key assumptions upon which the Company’s forward-looking information is based include, without limitation, the ability to make discoveries beyond Vega and to identify a new high-grade zone, the ability to expand the footprint and width of caesium mineralization at Vega, that proposed exploration work on the Property and the results therefrom will continue as expected, the accuracy of reserve and resource estimates, the classification of resources and the assumptions on which the reserve and resource estimates are based, long-term demand for lithium (spodumene), tantalum (tantalite), and caesium (pollucite)  supply, and that exploration and development results continue to support management’s current plans for Property development.

Forward-looking statements are also subject to risks and uncertainties facing the Company’s business, any of which could have a material adverse effect on the Company’s business, financial condition, results of operations and growth prospects. Readers should review the detailed risk discussion in the Company’s most recent Annual Information Form filed on SEDAR+, for a fuller understanding of the risks and uncertainties that affect the Company’s business and operations.

Although the Company believes its expectations are based upon reasonable assumptions and has attempted to identify important factors that could cause actual actions, events or results to differ materially from those described in forward-looking statements, there may be other factors that cause actions, events or results not to be as anticipated, estimated or intended. There can be no assurance that forward-looking information will prove to be accurate. If any of the risks or uncertainties mentioned above, which are not exhaustive, materialize, actual results may vary materially from those anticipated in the forward-looking statements.

The forward-looking statements contained herein are made only as of the date hereof. The Company disclaims any intention or obligation to update or revise any forward-looking statements, whether as a result of new information, future events or otherwise, except to the extent required by applicable law. The Company qualifies all of its forward-looking statements by these cautionary statements.

Competent Person Statement (ASX Listing Rules)

The information in this news release that relates to the Feasibility Study (“FS”) for the Shaakichiuwaanaan Project, which was first reported by the Company in a market announcement titled “PMET Resources Delivers Positive CV5 Lithium-Only Feasibility Study for its Large-Scale Shaakichiuwaanaan Project” dated October 20, 2025 (Montreal time) is available on the Company’s website at www.pmet.ca, on SEDAR+ at www.sedarplus.ca and on the ASX website at www.asx.com.au. The production target from the Feasibility Study referred to in this news release was reported by the Company in accordance with ASX Listing Rule 5.16 on the date of the original announcement. The Company confirms that, as of the date of this news release, all material assumptions and technical parameters underpinning the production target in the original announcement continue to apply and have not materially changed.

The Mineral Resource and Mineral Reserve Estimates in this release were first reported by the Company in accordance with ASX Listing Rule 5.8 in market announcements titled “World’s Largest Pollucite-Hosted Caesium Pegmatite Deposit” dated July 20, 2025 (Montreal time) and “PMET Resources Delivers Positive CV5 Lithium-Only Feasibility Study for its Large-Scale Shaakichiuwaanaan Project” dated October 20, 2025 (Montreal time) and are available on the Company’s website at www.pmet.ca, on SEDAR+ at www.sedarplus.ca and on the ASX website at www.asx.com.au. The Company confirms that, as of the date of this news release, it is not aware of any new information or data verified by the competent person that materially affects the information included in the relevant announcement and that all material assumptions and technical parameters underpinning the estimates in the relevant announcement continue to apply and have not materially changed. The Company confirms that, as at the date of this announcement, the form and context in which the competent person’s findings are presented have not been materially modified from the original market announcement.

Appendix 1 – JORC Code 2012 Table 1 (ASX Listing Rule 5.8.2)

Section 1 – Sampling Techniques and Data

Criteria

JORC Code explanation

Commentary

Sampling techniques

• Nature and quality of sampling (eg cut channels, random chips, or specific specialized industry standard measurement tools appropriate to the minerals under investigation, such as down hole gamma sondes, or handheld XRF instruments, etc). These examples should not be taken as limiting the broad meaning of sampling.

• Include reference to measures taken to ensure sample representivity and the appropriate calibration of any measurement tools or systems used.

•  Aspects of the determination of mineralization that are Material to the Public Report.

• In cases where ‘industry standard’ work has been done this would be relatively simple (eg ‘reverse circulation drilling was used to obtain 1 m samples from which 3 kg was pulverized to produce a 30 g charge for fire assay’). In other cases more explanation may be required, such as where there is coarse gold that has inherent sampling problems. Unusual commodities or mineralization types (eg submarine nodules) may warrant disclosure of detailed information.

• Core sampling protocols meet industry standard practices.

• Core sampling is guided by lithology as determined during geological logging (i.e., by a geologist). All pegmatite intervals are sampled in their entirety (half-core), regardless if spodumene mineralization is noted or not (in order to ensure an unbiased sampling approach) in addition to ~1 to 3 m of sampling into the adjacent host rock (dependent on pegmatite interval length) to “bookend” the sampled pegmatite.

• The minimum individual sample length is typically 0.5 m and the maximum sample length is typically 2.0 m. Targeted individual pegmatite sample lengths are 1.0 to 1.5 m.

• All drill core is oriented to maximum foliation prior to logging and sampling and is cut with a core saw into half-core pieces, with one half-core collected for assay, and the other half-core remaining in the box for reference. 

• Core samples collected from drill holes were shipped to SGS Canada’s laboratory in Val-d’Or, QC, for sample preparation (code PRP90 special) which included drying at 105°C, crush to 90% passing 2 mm, riffle split 250 g, and pulverize 85% passing 75 microns.

• All drill core sample pulps were shipped by air to SGS Canada’s laboratory in Burnaby, BC, where the samples were homogenized and subsequently analysed for multi-element (including Li, Ta, and Cs) using sodium peroxide fusion with ICP-AES/MS finish (codes GE_ICP91A50 and GE_IMS91A50). Overlimits for Cs were completed at SGS Canada’s laboratory in Lakefield, ON, by borate-fusion XRF (code GC_XRF76V).

Drilling techniques

• Drill type (eg core, reverse circulation, open-hole hammer, rotary air blast, auger, Bangka, sonic, etc) and details (eg core diameter, triple or standard tube, depth of diamond tails, face-sampling bit or other type, whether core is oriented and if so, by what method, etc).

• NQ, HQ, or HQ3 size core diamond drilling was completed for all holes. Core was not oriented.

Drill sample recovery

• Method of recording and assessing core and chip sample recoveries and results assessed.

• Measures taken to maximize sample recovery and ensure representative nature of the samples.

• Whether a relationship exists between sample recovery and grade and whether sample bias may have occurred due to preferential loss/gain of fine/coarse material.

• All drill core was geotechnically logged following industry standard practices, and include TCR, RQD, ISRM, and Q-Method (since mid-winter 2023). Core recovery typically exceeds 90%.

Logging

• Whether core and chip samples have been geologically and geotechnically logged to a level of detail to support appropriate Mineral Resource estimation, mining studies and metallurgical studies.

• Whether logging is qualitative or quantitative in nature. Core (or costean, channel, etc) photography.

• The total length and percentage of the relevant intersections logged.

• Upon receipt at the core shack, all drill core is pieced together, oriented to maximum foliation, metre marked, geotechnically logged (including structure), alteration logged, geologically logged, and sample logged on an individual sample basis. Core box photos are also collected of all core drilled, regardless of perceived mineralization. Specific gravity measurements of pegmatite are also collected at systematic intervals for all pegmatite drill core using the water immersion method, as well as select host rock drill core.

• The logging is qualitative by nature, and includes estimates of spodumene grain size, inclusions, and model mineral estimates.

• These logging practices meet or exceed current industry standard practices.

Sub-sampling techniques and sample preparation

• If core, whether cut or sawn and whether quarter, half or all core taken.

• If non-core, whether riffled, tube sampled, rotary split, etc and whether sampled wet or dry.

• For all sample types, the nature, quality and appropriateness of the sample preparation technique.

• Quality control procedures adopted for all sub-sampling stages to maximize representivity of samples.

• Measures taken to ensure that the sampling is representative of the in situ material collected, including for instance results for field duplicate/second-half sampling.

• Whether sample sizes are appropriate to the grain size of the material being sampled.

• Drill core sampling followed industry best practices. Drill core was saw-cut with half-core sent for geochemical analysis and half-core remaining in the box for reference. The same side of the core was sampled to maintain representativeness.

• The minimum individual sample length is typically 0.5 m and the maximum sample length is typically 2.0 m. Targeted individual pegmatite sample lengths are 1.0 to 1.5 m.

• Sample sizes are considered appropriate for the material being assayed.

• A Quality Assurance / Quality Control protocol following industry best practices was incorporated into the program and included systematic insertion of quartz blanks and certified/standard reference materials into sample batches at a rate of approximately 5% each. Additionally, analysis of pulp-split sample duplicates was completed to assess analytical precision, and external (secondary) laboratory pulp-split duplicates were prepared at the primary lab for subsequent check analysis and validation.

• All protocols employed are considered appropriate for the sample type and nature of mineralization and are considered the optimal approach for maintaining representativeness in sampling.

Quality of assay data and laboratory tests

• The nature, quality and appropriateness of the assaying and laboratory procedures used and whether the technique is considered partial or total.

• For geophysical tools, spectrometers, handheld XRF instruments, etc, the parameters used in determining the analysis including instrument make and model, reading times, calibrations factors applied and their derivation, etc.

• Nature of quality control procedures adopted (eg standards, blanks, duplicates, external laboratory checks) and whether acceptable levels of accuracy (ie lack of bias) and precision have been established.

• Core samples collected from drill holes were shipped to SGS Canada’s laboratory in Val-d’Or, QC, for sample preparation (code PRP90 special) which included drying at 105°C, crush to 90% passing 2 mm, riffle split 250 g, and pulverize 85% passing 75 microns.

• All drill core sample pulps were shipped by air to SGS Canada’s laboratory in Burnaby, BC, where the samples were homogenized and subsequently analysed for multi-element (including Li, Ta, and Cs) using sodium peroxide fusion with ICP-AES/MS finish (codes GE_ICP91A50 and GE_IMS91A50). Overlimits for Cs were completed at SGS Canada’s laboratory in Lakefield, ON, by borate-fusion XRF (code GC_XRF76V).

• The Company relies on both its internal QAQC protocols (systematic use of blanks, certified/standard reference materials, and external checks), as well as the laboratory’s internal QAQC.

• All protocols employed are considered appropriate for the sample type and nature of mineralization and are considered the optimal approach for maintaining representativeness in sampling.

Verification of sampling and assaying

• The verification of significant intersections by either independent or alternative company personnel.

• The use of twinned holes.

• Documentation of primary data, data entry procedures, data verification, data storage (physical and electronic) protocols.

• Discuss any adjustment to assay data.

• Intervals are reviewed and compiled by the EVP Exploration and Project Managers prior to disclosure, including a review of the Company’s internal QAQC sample analytical data.

• No twinned holes were completed, although a few were recollared immediately adjacent if initially lost. 

• Data capture utilizes MX Deposit software whereby core logging data is entered directly into the software for storage, including direct import of laboratory analytical certificates as they are received. The Company employs various on-site and post QAQC protocols to ensure data integrity and accuracy.

• Adjustments to data include reporting lithium and tantalum in their oxide forms, as it is reported in elemental form in the assay certificates. Formulas used are Li2O = Li x 2.153, Ta2O5 = Ta x 1.221, and Cs2O = Cs x 1.0602

Location of data points

• Accuracy and quality of surveys used to locate drill holes (collar and down-hole surveys), trenches, mine workings and other locations used in Mineral Resource estimation.

• Specification of the grid system used.

• Quality and adequacy of topographic control.

• Each drill hole collar has been surveyed with a RTK Trimble Zephyr 3, except for a minor number of holes (e.g., holes lost which were re-collared). 

• The coordinate system used is UTM NAD83 Zone 18.

• The Company completed a property-wide LiDAR and orthophoto survey in August 2022, which provides high-quality topographic control.

• The quality and accuracy of the topographic controls are considered adequate for advanced stage exploration and development, including Mineral Resource estimation.

Data spacing and distribution

• Data spacing for reporting of Exploration Results.

•  Whether the data spacing and distribution is sufficient to establish the degree of geological and grade continuity appropriate for the Mineral Resource and Ore Reserve estimation procedure(s) and classifications applied.

•  Whether sample compositing has been applied.

• At CV5, drill hole collar spacing is dominantly grid based. Several collars are typically completed from the same pad at varied orientations targeting pegmatite pierce points of ~50 (Indicated, Li-Ta) to 100 m (Inferred, Li-Ta) spacing.

• At CV13, drill hole spacing is a combination of grid based (at ~100 m spacing) and fan based with multiple holes collared from the same pad. Therefore, collar locations and hole orientations may vary widely, which reflect the varied orientation of the pegmatite body along strike. Pegmatite pierce points of ~50 (Indicated, Li-Ta) to 100 m (Inferred, Li-Ta) spacing are targeted.

• At CV12 and CV8, drill hole collar spacing is dominantly grid based. Several collars are typically completed from the same pad at varied orientations targeting pegmatite pierce points of ~50 m to 100 m spacing.

• At CV4, drill hole spacing is fan based with multiple holes collared from the same pad.

• Based on the nature of the mineralization and continuity in geological modelling, the drill hole spacing is anticipated to be sufficient to support a MRE.

• Core sample lengths typically range from 0.5 to 2.0 m and average ~1.0 to 1.5 m. Sampling is continuous within all pegmatite encountered in the drill hole. 

• Core samples are not composited upon collection or for analysis.

Orientation of data in relation to geological structure

• Whether the orientation of sampling achieves unbiased sampling of possible structures and the extent to which this is known, considering the deposit type.

• If the relationship between the drilling orientation and the orientation of key mineralized structures is considered to have introduced a sampling bias, this should be assessed and reported if material.

• No sampling bias is anticipated based on structure within the mineralized body. 

• The principal mineralized bodies are relatively undeformed and very competent, although have meaningful structural control. 

• At CV5, the principal mineralized body and adjacent lenses are steeply dipping resulting in oblique angles of intersection with true widths varying based on drill hole angle and orientation of pegmatite at that particular intersection point. i.e., the dip of the mineralized pegmatite body has variations in a vertical sense and along strike, so the true widths are not always apparent until several holes have been drilled (at the appropriate spacing) in any particular drill-fence.

• At CV13, the principal pegmatite body has a varied strike and shallow northerly dip. The Rigel and Vega zones are hosted entirely within the CV13 Pegmatite as lenses concordant to the local pegmatite orientation.

• At CV12 and CV8, current interpretation supports a series of shallow, northerly dipping sheets. 

•  At CV4, current interpretation supports a series of steeply, northerly dipping sheets.

Sample security

• The measures taken to ensure sample security.

• Samples were collected by Company staff or its consultants following specific protocols governing sample collection and handling. Core samples were bagged, placed in large supersacs for added security, palleted, and shipped directly to Val-d’Or, QC, being tracked during shipment along with Chain of Custody. Upon arrival at the laboratory, the samples were cross-referenced with the shipping manifest to confirm all samples were accounted for. At the laboratory, sample bags are evaluated for tampering.

Audits or reviews

• The results of any audits or reviews of sampling techniques and data.

•  A review of the sample procedures for the Company’s drill programs has been reviewed by several Qualified/Competent Persons through multiple NI 43-101 technical reports completed for the Company and deemed adequate and acceptable to industry best practices. The most recent Technical Report includes a review of sampling techniques and data through 2024 (drill hole CV24-787) in a technical report titled “CV5 Pegmatite Lithium-Only Feasibility Study NI 43-101 Technical Report, Shaakichiuwaanaan Project” with an Effective Date of October 20, 2025, and Issue Date of November 14, 2025.

• Additionally, the Company continually reviews and evaluates its procedures in order to optimize and ensure compliance at all levels of sample data collection and handling.

Section 2 – Reporting of Exploration Results

Criteria

JORC Code explanation

Commentary

Mineral tenement and land tenure status

• Type, reference name/number, location and ownership including agreements or material issues with third parties such as joint ventures, partnerships, overriding royalties, native title interests, historical sites, wilderness or national park and environmental settings.

• The security of the tenure held at the time of reporting along with any known impediments to obtaining a licence to operate in the area.

• The Shaakichiuwaanaan Property (formerly called “Corvette”) is comprised of 463 CDC claims located in the James Bay Region of Quebec, with Lithium Innova Inc. (wholly owned subsidiary of PMET Resources Inc.) being the registered title holder for all of the claims. The northern border of the Property’s primary claim block is located within approximately 6 km to the south of the Trans-Taiga Road and powerline infrastructure corridor. The CV5 Spodumene Pegmatite is accessible year-round by all-season road is situated approximately 13.5 km south of the regional and all‑weather Trans-Taiga Road and powerline infrastructure. The CV13 and CV9 spodumene pegmatites are located approximately 3 km west-southwest and 14 km west of CV5, respectively.

• The Company holds 100% interest in the Property subject to various royalty obligations depending on original acquisition agreements. DG Resources Management holds a 2% NSR (no buyback) on 76 claims, D.B.A. Canadian Mining House holds a 2% NSR on 50 claims (half buyback for $2M), OR Royalties holds a sliding scale NSR of 1.5-3.5% on precious metals, and 2% on all other products, over 111 claims, and Azimut Exploration holds 2% NSR on 39 claims.

• The Property does not overlap any atypically sensitive environmental areas or parks, or historical sites to the knowledge of the Company. There are no known hinderances to operating at the Property, apart from the goose harvesting season (typically mid-April to mid-May) where the communities request helicopter flying not be completed, and potentially wildfires depending on the season, scale, and location.

• Claim expiry dates range from July 2026 to July 2028. 

Exploration done by other parties

• Acknowledgment and appraisal of exploration by other parties.

• No previous exploration targeting LCT pegmatites has been conducted by other parties at the Project.

• For a summary of previous exploration undertaken by other parties at the Project, please refer to the most recent NI 43-101 Technical Report.

Geology

• Deposit type, geological setting and style of mineralization.

• The Property overlies a large portion of the Lac Guyer Greenstone Belt, considered part of the larger La Grande River Greenstone Belt and is dominated by volcanic rocks metamorphosed to amphibolite facies. The claim block is dominantly host to rocks of the Guyer Group (amphibolite, iron formation, intermediate to mafic volcanics, peridotite, pyroxenite, komatiite, as well as felsic volcanics). The amphibolite rocks that trend east-west (generally steeply south dipping) through this region are bordered to the north by the Magin Formation (conglomerate and wacke) and to the south by an assemblage of tonalite, granodiorite, and diorite, in addition to metasediments of the Marbot Group (conglomerate, wacke). Several regional-scale Proterozoic gabbroic dykes also cut through portions of the Property (Lac Spirt Dykes, Senneterre Dykes).

• The geological setting is prospective for multiple commodities over several different deposit styles including orogenic gold (Au), volcanogenic massive sulphide (Cu, Au, Ag), komatiite-ultramafic (Au, Ag, PGE, Ni, Cu, Co), and LCT pegmatite (Li, Cs, Ta, Ga, Rb).

• Exploration of the Property has outlined three primary mineral exploration trends crossing dominantly east-west over large portions of the Property – Golden Trend (gold), Maven Trend (copper, gold, silver), and CV Trend (lithium, caesium, tantalum). The CV4, CV5, CV8, CV12, and CV13 pegmatites are situated within the CV Trend.

• The pegmatites at Shaakichiuwaanaan are categorized as Li-Cs-Ta (“LCT”) pegmatites. LCT mineralization at the Property is observed to occur within quartz-feldspar pegmatite. The pegmatite is often very coarse-grained and off-white in appearance, with darker sections commonly composed of mica and smoky quartz, and occasional tourmaline.

• Core assays and ongoing mineralogical studies, coupled with field mineral identification and assays confirm spodumene as the dominant lithium-bearing mineral on the Property, with no significant petalite, lepidolite, lithium-phosphate minerals, or apatite present. The spodumene crystal size of the pegmatites is typically decimeter scale, and therefore, very large. The pegmatites also carry significant tantalum (tantalite) and caesium (pollucite). Gallium is present in spodumene and feldspar via substitution with Al.

Drill hole Information

• A summary of all information material to the understanding of the exploration results including a tabulation of the following information for all Material drill holes:

o  easting and northing of the drill hole collar

o  elevation or RL (Reduced Level – elevation above sea level in metres) of the drill hole collar

o  dip and azimuth of the hole

o  down hole length and interception depth

o  hole length.

•  If the exclusion of this information is justified on the basis that the information is not Material and this exclusion does not detract from the understanding of the report, the Competent Person should clearly explain why this is the case.

• Drill hole attribute information is included in a table herein.

• Results for pegmatite intervals <2 m are not typically reported. 

Data aggregation methods

• In reporting Exploration Results, weighting averaging techniques, maximum and/or minimum grade truncations (eg cutting of high grades) and cut-off grades are usually Material and should be stated.

•  Where aggregate intercepts incorporate short lengths of high grade results and longer lengths of low grade results, the procedure used for such aggregation should be stated and some typical examples of such aggregations should be shown in detail.

• The assumptions used for any reporting of metal equivalent values should be clearly stated.

• Length weighted averages were used to calculate grade over width.

• No specific grade cap or cut-off was used during grade width calculations for lithium or tantalum. The lithium, tantalum, and caesium length weighted average grade of the entire pegmatite interval is calculated for all pegmatite intervals over 2 m core length, as well as higher grade zones at the discretion of the geologist. Additionally, for caesium specific zones, a general cut-off of 0.5% Cs2O was used to calculate pegmatite intervals assaying >1% Cs2O, which are reported when applicable.

• Pegmatites have inconsistent mineralization by nature, resulting in some intervals having a small number of poorly mineralized samples included in the calculation. Non-pegmatite internal dilution is limited to typically <3 m where relevant and intervals indicated when assays are reported.

• No metal equivalents have been reported.

Relationship between mineralization widths and intercept lengths

• These relationships are particularly important in the reporting of Exploration Results.

• If the geometry of the mineralization with respect to the drill hole angle is known, its nature should be reported.

•  If it is not known and only the down hole lengths are reported, there should be a clear statement to this effect (eg ‘down hole length, true width not known’).

• At CV5, current interpretation supports a principal, large pegmatite body of near vertical to steeply dipping orientation, flanked by several subordinate pegmatite lenses.

• At CV13, current interpretation supports a series of sub-parallel trending sills with a flat-lying to shallow northerly dip. Within the CV13 Pegmatite body are the Rigel and Vega zones, which follow the local trend of the wider pegmatite body.

• At CV12 and CV8, current interpretation supports a series of shallow, northerly dipping sheets.

• At CV4, current interpretation supports a series of steeply, northerly dipping sheets.

• All reported widths are core length.

Diagrams

• Appropriate maps and sections (with scales) and tabulations of intercepts should be included for any significant discovery being reported. These should include, but not be limited to a plan view of drill hole collar locations and appropriate sectional views.

• Please refer to the figures included herein as well as those posted on the Company’s website.

Balanced reporting

• Where comprehensive reporting of all Exploration Results is not practicable, representative reporting of both low and high grades and/or widths should be practiced to avoid misleading reporting of Exploration Results.

• Reporting is balanced. 

• Please refer to the table(s) included herein.

• Results for pegmatite intervals <2 m are not typically reported. However, all intervals where Cs exceeds 1% Cs2O are reported.

Other substantive exploration data

• Other exploration data, if meaningful and material, should be reported including (but not limited to): geological observations; geophysical survey results; geochemical survey results; bulk samples – size and method of treatment; metallurgical test results; bulk density, groundwater, geotechnical and rock characteristics; potential deleterious or contaminating substances.

• The Company is currently completing site environmental work over the CV5 and CV13 pegmatite area. No endangered flora or fauna have been documented over the Property to date, and several sites have been identified as potentially suitable for mine infrastructure. 

• The Company has completed a bathymetric survey over the shallow glacial lake which overlies a portion of the CV5 Spodumene Pegmatite. The lake depth ranges from <2 m to approximately 18 m, although the majority of the CV5 Spodumene Pegmatite, as delineated to date, is overlain by typically <2 to 10 m of water.

• The Company has completed significant metallurgical testing comprised of HLS and magnetic testing, which has produced 6+% Li2O spodumene concentrates at >70% recovery on both CV5 and CV13 pegmatite material. A DMS test on CV5 Pegmatite material returned a Subsequent and more expansive DMS pilot programs completed, including with non-pegmatite dilution, produced results in line with prior testwork, confirming a DMS-only flowsheet is applicable. The Company has also produced a marketable lithium hydroxide concentrate from CV5’s spodumene concentrate.

• The Company has produced marketable tantalite concentrates at bench-scale from the CV5 Pegmatite’s DMS (spodumene) tailings fractions. The testwork used gravity or gravity + flotation methods to produce tantalite concentrates grading 8.7% Ta2O5 at 45% global recovery (MC001) and 6.6% Ta2O5 at 49% global recovery (MC002).

• The Company has produced marketable pollucite concentrates at bench-scale from the CV13 Pegmatite’s Vega Caesium Zone. The testwork used XRT ore sorting to produce concentrates of 11.5% Cs2O and 20.0% Cs2O at an overall 88% recovery.

• Various mandates required for advancing the Project have been completed or are ongoing, including but not limited to, environmental baseline, metallurgy, geomechanics, hydrogeology, hydrology, stakeholder engagement, geochemical characterization, as well as transportation and logistical studies. A Feasibility Study for lithium-only on the CV5 Pegmatite was announced October 20, 2025.

Further work

• The nature and scale of planned further work (eg tests for lateral extensions or depth extensions or large-scale step-out drilling).

• Diagrams clearly highlighting the areas of possible extensions, including the main geological interpretations and future drilling areas, provided this information is not commercially sensitive.

• The Company intends to continue drilling the pegmatites of the Shaakichiuwaanaan Property, primarily targetting lithium, caesium, and tantalum as the primary commodities of interest. This is anticipated to includes step-out and infill drilling.

• Further drilling is anticipated to support the development of the CV5 and CV13 pegmatites (i.e., resource, geotechnical, geomechanical, and hydrogeological).

• Metallurgical test programs evaluating the recovery of lithium, caesium, and tantalum are ongoing.

•  Surface prospecting, rock sampling, and mapping is planned to continue across the Property focused on LCT pegmatite.

Photo – https://laotiantimes.com/wp-content/uploads/2026/02/pmet_resources_inc__widest_and_highest_grade_caesium_intercepts.jpg
Photo – https://laotiantimes.com/wp-content/uploads/2026/02/pmet_resources_inc__widest_and_highest_grade_caesium_intercepts-1.jpg
Photo – https://laotiantimes.com/wp-content/uploads/2026/02/pmet_resources_inc__widest_and_highest_grade_caesium_intercepts-2.jpg
Photo – https://laotiantimes.com/wp-content/uploads/2026/02/pmet_resources_inc__widest_and_highest_grade_caesium_intercepts-3.jpg
Photo – https://laotiantimes.com/wp-content/uploads/2026/02/pmet_resources_inc__widest_and_highest_grade_caesium_intercepts-4.jpg
Photo – https://laotiantimes.com/wp-content/uploads/2026/02/pmet_resources_inc__widest_and_highest_grade_caesium_intercepts-5.jpg
Photo – https://mma.prnewswire.com/media/2875542/PMET_Resources_Inc__Widest_and_Highest_Grade_Caesium_Intercepts.jpg 

Telix Full Year Results 2025 Investor Webcast Notification

MELBOURNE, Australia and INDIANAPOLIS, Feb. 4, 2026 /PRNewswire/ — Telix Pharmaceuticals Limited (ASX: TLX, NASDAQ: TLX, “Telix”) advises that it will release its full year results for the period ended 31 December 2025 on Friday 20 February 2026 AEDT (Thursday 19 February 2026 EST).

An investor webcast and conference call will be held at 9:30 a.m. AEDT, Friday 20 February 2026 (5:30 p.m. EST, Thursday 19 February 2026).

Participants can register at the following link: https://edge.media-server.com/mmc/p/famdpwzh

About Telix Pharmaceuticals Limited

Telix is a biopharmaceutical company focused on the development and commercialization of therapeutic and diagnostic radiopharmaceuticals and associated medical technologies. Telix is headquartered in Melbourne, Australia, with international operations in the United States, United Kingdom, Brazil, Canada, Europe (Belgium and Switzerland), and Japan. Telix is developing a portfolio of clinical and commercial stage products that aims to address significant unmet medical needs in oncology and rare diseases. Telix is listed on the Australian Securities Exchange (ASX: TLX) and the Nasdaq Global Select Market (NASDAQ: TLX).

Visit www.telixpharma.com for further information about Telix, including details of the latest share price, ASX and U.S. Securities and Exchange Commission (SEC) filings, investor and analyst presentations, news releases, event details and other publications that may be of interest. You can also follow Telix on LinkedIn, X and Facebook.

Telix Investor Relations (Global)

Ms. Kyahn Williamson
Telix Pharmaceuticals Limited
SVP Investor Relations and Corporate Communications
Email: kyahn.williamson@telixpharma.com

Telix Investor Relations (U.S.)  

Annie Kasparian 
Telix Pharmaceuticals Limited 
Director Investor Relations and Corporate Communications 
Email: annie.kasparian@telixpharma.com 


This announcement has been authorized for release by Telix Pharmaceuticals Limited’s Company Secretary, Genevieve Ryan.

Legal Notices

Cautionary Statement Regarding Forward-Looking Statements. 

You should read this announcement together with our risk factors, as disclosed in our most recently filed reports with the Australian Securities Exchange (ASX), U.S. Securities and Exchange Commission (SEC), including our Annual Report on Form 20-F filed with the SEC, or on our website.

The information contained in this announcement is not intended to be an offer for subscription, invitation or recommendation with respect to securities of Telix Pharmaceuticals Limited (Telix) in any jurisdiction, including the United States. The information and opinions contained in this announcement are subject to change without notification.  To the maximum extent permitted by law, Telix disclaims any obligation or undertaking to update or revise any information or opinions contained in this announcement, including any forward-looking statements (as referred to below), whether as a result of new information, future developments, a change in expectations or assumptions, or otherwise. No representation or warranty, express or implied, is made in relation to the accuracy or completeness of the information contained or opinions expressed in the course of this announcement.

This announcement may contain forward-looking statements, including within the meaning of the U.S. Private Securities Litigation Reform Act of 1995, that relate to anticipated future events, financial performance, plans, strategies or business developments. Forward-looking statements can generally be identified by the use of words such as “may”, “expect”, “intend”, “plan”, “estimate”, “anticipate”, “believe”, “outlook”, “forecast” and “guidance”, or the negative of these words or other similar terms or expressions. Forward-looking statements involve known and unknown risks, uncertainties and other factors that may cause our actual results, levels of activity, performance or achievements to differ materially from any future results, levels of activity, performance or achievements expressed or implied by these forward-looking statements. Forward-looking statements are based on Telix’s good-faith assumptions as to the financial, market, regulatory and other risks and considerations that exist and affect Telix’s business and operations in the future and there can be no assurance that any of the assumptions will prove to be correct. In the context of Telix’s business, forward-looking statements may include, but are not limited to, statements about: the initiation, timing, progress, completion and results of Telix’s preclinical and clinical trials, and Telix’s research and development programs; Telix’s ability to advance product candidates into, enroll and successfully complete, clinical studies, including multi-national clinical trials; the timing or likelihood of regulatory filings and approvals for Telix’s product candidates, including the planned NDA resubmission for TLX101-Px and the planned BLA resubmission for TLX250-Px, manufacturing activities and product marketing activities; Telix’s sales, marketing and distribution and manufacturing capabilities and strategies; the commercialization of Telix’s product candidates, if or when they have been approved; Telix’s ability to obtain an adequate supply of raw materials at reasonable costs for its products and product candidates; estimates of Telix’s expenses, future revenues and capital requirements; Telix’s financial performance; developments relating to Telix’s competitors and industry; the anticipated impact of U.S. and foreign tariffs and other macroeconomic conditions on Telix’s business; and the pricing and reimbursement of Telix’s product candidates, if and after they have been approved. Telix’s actual results, performance or achievements may be materially different from those which may be expressed or implied by such statements, and the differences may be adverse. Accordingly, you should not place undue reliance on these forward-looking statements.

Trademarks and Trade Names. All trademarks and trade names referenced in this press release are the property of Telix Pharmaceuticals Limited (Telix) or, where applicable, the property of their respective owners. For convenience, trademarks and trade names may appear without the ® or ™ symbols. Such omissions are not intended to indicate any waiver of rights by Telix or the respective owners. Trademark registration status may vary from country to country. Telix does not intend the use or display of any third-party trademarks or trade names to imply any affiliation with, endorsement by, or sponsorship from those third parties.

©2026 Telix Pharmaceuticals Limited. All rights reserved.

Amcor Reports Solid Second Quarter Results and Reaffirms Fiscal 2026 Guidance

Highlights – Three Months Ended December 31, 2025

  • Net sales $5,449 million, up 68% driven by the Berry acquisition
  • GAAP Net income $177 million including acquisition related costs and GAAP diluted EPS of $0.38
  • Acquisition synergies of $55 million at upper end of expectations and targets reaffirmed
  • Adjusted EBITDA $826 million, up 83% and adjusted EBIT $603 million, up 66%
  • Adjusted EBITDA margin of 15.2%, up from 14% and adjusted EBIT margin of 11.1%, flat
  • Adjusted EPS of $0.86, up 7%
  • Free Cash Flow $289 million including Berry transaction, restructuring and integration costs of $69 million
  • Quarterly dividend of $0.65 declared

Highlights – Fiscal First Half Ended December 31, 2025

  • Net sales $11,194 million, up 70% driven by the Berry acquisition
  • GAAP Net income $439 million including acquisition related costs and GAAP diluted EPS of $0.95
  • Adjusted EBITDA $1,736 million, up 89% and adjusted EBIT $1,290 million, up 77%
  • Adjusted EBITDA margin of 15.5%, up from 13.9% and adjusted EBIT margin of 11.5%, up from 11.0%
  • Adjusted EPS of $1.83, up 14%

Fiscal 2026 Guidance Reaffirmed:

  • Adjusted EPS $4.00–$4.15 representing 12-17% constant currency growth
  • Free Cash Flow $1.8-1.9 billion

ZURICH, Feb. 4, 2026 /PRNewswire/ — Amcor CEO Peter Konieczny said, “Our Q2 financial performance was in line with expectations in a challenging volume environment. Strong Adjusted EPS growth was driven by disciplined execution and synergy benefits from the Berry acquisition at the upper end of expectations. Performance through the first half of the year supports our confidence in reaffirming fiscal 2026 earnings and free cash flow guidance. Portfolio optimization actions are progressing well, positioning us to be the global leader in consumer packaging and dispensing solutions for nutrition, health, beauty and wellness.”

Key Financials (1)(2)(3)

Three Months Ended
December 31,

Six Months Ended
December 31,

GAAP results

2024 $
million

2025 $
million

2024 $
million

2025 $
million

Net sales

3,241

5,449

6,594

11,194

Net income attributable to Amcor plc

163

177

354

439

EPS (diluted, $)

0.56

0.38

1.22

0.95

Reported

∆%

Reported

∆%

Three Months Ended
December 31,

Six Months Ended
December 31,

Adjusted non-GAAP results

2024 $
million

2025 $
million

2024 $
million

2025 $
million

Net sales

3,241

5,449

68

6,594

11,194

70

EBITDA

453

826

83

919

1,736

89

EBIT

363

603

66

728

1,290

77

Net income

233

400

72

467

848

82

EPS ($)

0.80

0.86

7

1.61

1.83

14

Free Cash Flow

358

289

(38)

(53)

All amounts referenced throughout this document are in US dollars unless otherwise indicated and numbers may not add up to the totals provided due to rounding.  

(1)  Adjusted non-GAAP results exclude items not considered representative of ongoing operations. Further details on non-GAAP measures and reconciliations to GAAP measures can be found under “Presentation of non-GAAP information”.

(2)  All prior year results reflect the Amcor plc group, considered the accounting acquirer in the April 30, 2025 combination between Amcor plc and Berry Global.

(3)  All periods presented in this release have been retroactively adjusted to reflect the 1-for-5 reverse stock split effected on January 14, 2026. Further details can be found under ‘Reverse Stock Split.

Financial Results

Three months ended December 31, 2025

Net sales of $5,449 million were 63% higher than last year on a constant currency basis, including approximately $2.2 billion of acquired sales net of divestments, which represents growth of approximately 66%. The pass through of movements in raw material costs had no material impact on net sales and the remaining (3%) year over year variation reflects the impact of lower volumes.

The Company estimates that volumes were approximately 1.5% lower than estimated combined volumes for the legacy Amcor and legacy Berry businesses in the December quarter last year, excluding non-core and divested businesses. The Company estimates that price/mix did not have a material impact on net sales.

Adjusted EBIT of $603 million was 62% higher than last year on a constant currency basis, including approximately $210 million of acquired EBIT net of divestments which represents growth of approximately 58%. The remaining 4% year over year variation mainly reflects synergy benefits from the Berry acquisition of approximately $50 million, continued disciplined execution against cost and productivity initiatives, partly offset by lower volumes, primarily in non-core businesses.

GAAP net interest expense was $154 million and GAAP income tax expense was $3 million. Inclusive of acquisition related financial benefits of approximately $5 million, adjusted net interest expense was $140 million and adjusted tax expense was $63 million representing an effective tax rate of 13.6%. Interest expense was $73 million higher than the prior year primarily as a result of increased acquisition related net debt. The effective tax rate was lower than 18.6% in the prior year primarily as a result of discrete tax events which occurred in the current period.

Free cash flow of $289 million was in-line with expectations after funding approximately $69 million of net acquisition related cash costs. 

Net debt was $14,081 million at December 31, 2025.  

Six months ended December 31, 2025

Net sales of $11,194 million were 66% higher than last year on a constant currency basis, including approximately $4.5 billion of acquired sales net of divestments, which represents growth of approximately 69%. The pass through of movements in raw material costs had no material impact on net sales and the remaining (3%) year over year variation reflects the impact of volumes and price/mix. 

Adjusted EBIT of $1,290 million was 73% higher than last year on a constant currency basis, including approximately $510 million of acquired EBIT net of divestments which represents growth of approximately 69%. The remaining 4% year over year variation mainly reflects synergy benefits from the Berry acquisition of approximately $83 million partly offset by lower volumes. 

GAAP net interest expense was $307 million and GAAP income tax expense was $52 million. Inclusive of acquisition related financial benefits of approximately $10 million, adjusted net interest expense was $281 million and adjusted tax expense was $161 million representing an effective tax rate of 16.0%.

Free cash outflow was $53 million after funding approximately $184 million of net acquisition related cash costs. Prior to funding of acquisition related cash costs cash flow increased by approximately $170 million compared with last year.

Dividend

The Board’s confidence in Amcor’s near and long term growth opportunities and ability to generate significant free cash flow is reflected in today’s declaration of a quarterly cash dividend of 65.0 cents per share, compared with 63.75 cents per share in the same quarter last year, declared as 12.75 cents per share before adjusting for the 1-for-5 reverse stock split effected on January 14, 2026. The dividend will be paid in US dollars to holders of Amcor’s ordinary shares trading on the NYSE. Holders of CDIs trading on the ASX will receive an unfranked dividend of 93.0 Australian cents per share, which reflects the quarterly dividend of 65.0 cents per share converted at an AUD:USD average exchange rate of 0.6970 over the five trading days ended January 30, 2026.

The ex-dividend date will be February 24, 2026 for holders of CDIs trading on the ASX and February 25, 2026 for holders of shares trading on the NYSE. For all shareholders, the record date will be February 25, 2026 and the payment date will be March 17, 2026. 

Fiscal 2026 Guidance Reaffirmed

For the fiscal year ending June 30, 2026, the Company expects:

  • Adjusted EPS of $4.00 to $4.15
    • Remains unchanged from the previous $0.80 to $0.83 cents per share range, which has been updated to reflect the 1-for-5 reverse stock split effected on January 14, 2026
    • Represents constant currency growth of 12% to 17% compared with $3.56, reported as 71.2 cents per share before adjusting for the 1-for-5 reverse stock split which became effective on January 14, 2026, in fiscal 2025
    • Includes pre-tax synergy benefits related to the Berry acquisition of at least $260 million
  • Free Cash Flow of $1.8 billion to $1.9 billion.

Amcor’s guidance for fiscal 2026 reflects a full 12 months ownership of the Berry business and does not take into account the impact of potential portfolio optimization actions that may be completed through the year.

Conference Call

Amcor is hosting a conference call with investors and analysts to discuss these results on Tuesday February 3, 2026 at 5:30pm US Eastern Standard Time / Wednesday February 4, 2026 at 9:30am Australian Eastern Daylight Time. Investors are invited to listen to a live webcast of the conference call at our website, www.amcor.com, in the “Investors” section.

Those wishing to access the call should use the following toll-free numbers, with the Conference ID: 8282712

  • USA: 800 715 9871 (toll free)
  • USA: 646 307 1963 (local)
  • Australia: 1800 519 630 (toll free), 02 9133 7103 (local)
  • United Kingdom: 0800 358 0970 (toll free), 020 3433 3846 (local)
  • Singapore: +65 3159 5133 (local)
  • Hong Kong: +852 3002 3410 (local)

From all other countries, the call can be accessed by dialing +1 646 307 1963 (toll).

A replay of the webcast will also be available in the ‘Investors” section at www.amcor.com following the call.

Segment Information

Global Flexible Packaging Solutions segment – December 2025 quarter

Three Months Ended December 31,

Reported
∆%

Constant
currency ∆%

2024 $ million

2025 $ million

Net sales

2,511

3,188

27

23

Adjusted EBIT

322

402

25

22

Adjusted EBIT / Sales %

12.8

12.6

Net sales of $3,188 million, were 23% higher than last year on a constant currency basis including approximately $605 million of acquired sales net of divestments, which represents growth of approximately 24%. The pass through of movements in raw material costs had no material impact on net sales and the remaining (1%) year over year variation reflects the impact of volumes and price/mix. 

The Company estimates that volumes for the Global Flexible Packaging Solutions segment were approximately 2% lower compared to volumes for the combined legacy Amcor and Berry businesses in the December quarter last year. By market category, volumes were higher in pet food and meat proteins. This was offset by lower volumes in other nutrition, liquids and unconverted film and foil. By region, volumes were lower across North America and Europe. Volumes in emerging markets were in line with the prior year, with growth in Asia Pacific offset by volume declines in Latin America. The Company estimates that price/mix had no material impact on net sales.

Adjusted EBIT of $402 million was 22% higher than last year on a constant currency basis, reflecting approximately $65 million of acquired EBIT, net of divestments which represents growth of approximately 20%. The remaining 2% year over year growth mainly reflects synergy benefits from the Berry acquisition, favorable cost performance and productivity benefits, partly offset by lower volumes.  

Global Flexible Packaging Solutions segment – December 2025 YTD

Six Months Ended December 31,

Reported
∆%

Constant
currency ∆%

2024 $ million

2025 $ million

Net sales

5,062

6,445

27

24

Adjusted EBIT

651

828

27

25

Adjusted EBIT / Sales %

12.9

12.9

Net sales of $6,445 million, were 24% higher than last year on a constant currency basis including approximately $1.2 billion of acquired sales net of divestments, which represents growth of approximately 25%.  The pass through of movements in raw material costs had no material impact on net sales and the remaining (1%) year over year variation reflects the impact of volumes and price/mix. 

Adjusted EBIT of $828 million was 25% higher than last year on a constant currency basis, reflecting approximately $140 million of acquired EBIT, net of divestments which represents growth of approximately 22%.  The remaining 3% year over year growth mainly reflects synergy benefits from the Berry acquisition partly offset by lower volumes.  

Global Rigid Packaging Solutions segment – December 2025 quarter

Three Months Ended December 31,

Reported
∆%

Constant
currency ∆%

2024 $ million

2025 $ million

Net sales

730

2,264

210

200

Adjusted EBIT

53

228

327

308

Adjusted EBIT / Sales %

7.3

10.1

Net sales of $2,264 million, were 200% higher than last year on a constant currency basis, including approximately $1.5 billion of acquired sales net of divestments, which represents growth of approximately 212% and an unfavorable impact of approximately (1%) from the pass through of lower raw material costs.  The remaining (11%) year over year variation reflects price/mix and lower non-core business volumes. 

Excluding non-core and divested businesses, the Company estimates that volumes for the Global Rigid Packaging Solutions segment were flat compared with volumes for the combined legacy Amcor and Berry businesses in the December quarter last year.  By market category, volumes were higher in pet food, beauty & wellness and specialty containers.  This offset softer volumes in healthcare and foodservice.  By region, volumes were in line with the prior year in North America.  Volumes were lower across Europe and this was partly offset by volume growth across emerging markets, primarily in Latin America.  The Company estimates that price/mix had no material impact on net sales.

Adjusted EBIT of $228 million was 308% higher than last year on a constant currency basis, including approximately $165 million of acquired EBIT net of divestments which represents growth of approximately 306%.  The remaining 2% year over year variation mainly reflects synergy benefits from the Berry acquisition and cost reduction initiatives which offset lower volumes and performance in non-core businesses. 

Adjusted EBIT margins of 10.1% were 280 basis points higher than the prior year reflecting the improved quality of the combined business.

Global Rigid Packaging Solutions segment – December 2025 YTD

Six Months Ended December 31,

Reported
∆%

Constant
currency ∆%

2024 $ million

2025 $ million

Net sales

1,532

4,752

210

202

Adjusted EBIT

115

523

354

339

Adjusted EBIT / Sales %

7.5

11.0

Net sales of $4,752 million, were 202% higher than last year on a constant currency basis, including approximately $3.3 billion of acquired sales net of divestments, which represents growth of approximately 213% and an unfavorable impact of approximately (3%) from the pass through of lower raw material costs.  The remaining (8%) year over year variation reflects price mix and lower non-core business volumes. 

Adjusted EBIT of $523 million was 339% higher than last year on a constant currency basis, including approximately $405 million of acquired EBIT net of divestments which represents growth of approximately 352%.  The remaining 13% year over year variation mainly reflects lower volumes and performance in non-core businesses, partly offset by synergy benefits from the Berry acquisition and cost reduction initiatives. 

Adjusted EBIT margins of 11.0% were 350 basis points higher than the prior year reflecting the improved quality of the combined business.

About Amcor

Amcor is the global leader in developing and producing responsible consumer packaging and dispensing solutions across a variety of materials for nutrition, health, beauty and wellness categories. Our global product innovation and sustainability expertise enables us to solve packaging challenges around the world every day, producing a range of flexible packaging, rigid packaging, cartons and closures that are more sustainable, functional and appealing for our customers and their consumers. We are guided by our purpose of elevating customers, shaping lives and protecting the future. Supported by a commitment to safety, over 75,000 people generate $23 billion in annualized sales from operations that span over 400 locations in more than 40 countries. NYSE: AMCR; ASX: AMC 

www.amcor.com I LinkedIn I YouTube


U.S. GAAP Condensed Consolidated Statements of Income (Unaudited)

Three Months Ended December 31,

Six Months Ended December 31,

$ in millions, except per share data

2024

2025

2024

2025

Net sales

3,241

5,449

6,594

11,194

Cost of sales

(2,615)

(4,410)

(5,309)

(9,031)

Gross profit

626

1,039

1,285

2,163

Selling, general, and administrative expenses

(255)

(440)

(531)

(875)

Amortization of acquired intangible assets

(40)

(144)

(79)

(277)

Research and development expenses

(27)

(38)

(55)

(84)

Restructuring, transaction and integration expenses, net

(33)

(118)

(39)

(193)

Other income, net

26

32

28

58

Operating income

297

331

609

792

Interest expense, net

(72)

(154)

(147)

(307)

Other non-operating income/(expenses), net

(1)

1

(2)

2

Income before income taxes and equity in income of affiliated
companies

224

178

460

487

Income tax expense

(58)

(3)

(101)

(52)

Equity in income of affiliated companies, net of tax

1

2

1

4

Net income

167

177

360

439

Net income attributable to non-controlling interests

(4)

—

(6)

—

Net income attributable to Amcor plc

163

177

354

439

USD:EUR average FX rate

0.9379

0.8592

0.9238

0.8575

Basic earnings per share attributable to Amcor

0.57

0.38

1.22

0.95

Diluted earnings per share attributable to Amcor

0.56

0.38

1.22

0.95

Weighted average number of shares outstanding – Basic

288.50

463.10

288.30

462.60

Weighted average number of shares outstanding – Diluted

289.10

463.80

288.90

463.00

All periods have been retroactively adjusted to reflect the 1 for 5 reverse stock split effected on January 14, 2026.


U.S. GAAP Condensed Consolidated Statements of Cash Flows (Unaudited)

Six Months Ended December 31,

($ million)

2024

2025

Net income

360

439

Depreciation, amortization and impairment

267

737

Changes in operating assets and liabilities, excluding effect of acquisitions, divestitures, and
currency

(503)

(761)

Other non-cash items

35

(45)

Net cash provided by operating activities

159

370

Purchase of property, plant and equipment and other intangible assets

(243)

(459)

Proceeds from sales of property, plant and equipment and other intangible assets

7

36

Business acquisitions

(11)

(18)

Proceeds from divestitures, net of cash divested

113

—

Net debt proceeds

267

955

Dividends paid

(366)

(594)

Purchase of treasury shares, proceeds from exercise of options and tax withholdings for share-
based incentive plans

(38)

(58)

Other, including effect of exchange rate on cash and cash equivalents

(31)

(2)

Net increase/(decrease) in cash and cash equivalents

(143)

230

Cash and cash equivalents balance at beginning of the year

588

827

Cash and cash equivalents balance at end of the period

445

1,057


U.S. GAAP Condensed Consolidated Balance Sheets (Unaudited)

($ million)

June 30, 2025

December 31, 2025

Cash and cash equivalents

827

1,057

Trade receivables, net

3,426

3,161

Inventories, net

3,471

3,481

Property, plant, and equipment, net

8,202

7,766

Goodwill and other intangible assets, net

18,679

18,900

Other assets

2,461

2,681

Total assets

37,066

37,046

Trade payables

3,490

3,045

Short-term debt and current portion of long-term debt

257

519

Long-term debt, less current portion

13,841

14,619

Accruals and other liabilities

7,738

7,216

Shareholders’ equity

11,740

11,647

Total liabilities and shareholders’ equity

37,066

37,046


Components of Fiscal 2026 Net Sales growth

Three Months Ended December 31,

Six Months Ended December 31,

($ million)

Global
Flexible
Packaging
Solutions


Global Rigid
Packaging
Solutions


Total


Global
Flexible
Packaging
Solutions


Global Rigid
Packaging
Solutions


Total


Net sales fiscal 2026

3,188

2,264

5,449

6,445

4,752

11,194

Net sales fiscal 2025

2,511

730

3,241

5,062

1,532

6,594

Reported Growth %

27

210

68

27

210

70

FX %

4

10

5

3

8

4

Constant Currency Growth %

23

200

63

24

202

66

RM Pass Through %

—

(1)

—

—

(3)

—

Items affecting comparability %

24

212

66

25

213

69

Organic Growth %

(1)

(11)

(3)

(1)

(8)

(3)

Volume %

(2)

(6)

(3)

(2)

(5)

(3)

Price/Mix %

1

(6)

—

2

(3)

1


Reconciliation of Non-GAAP Measures

Reconciliation of adjusted Earnings before interest, tax, depreciation, and amortization (EBITDA), Earnings before interest
and tax (EBIT), Net income, Earnings per share (EPS) and Adjusted Free Cash Flow

Three Months Ended December 31, 2024

Three Months Ended December 31, 2025

($ million)

EBITDA

EBIT

Net
Income

EPS
(Diluted)

EBITDA

EBIT

Net
Income

EPS
(Diluted)

Net income attributable to Amcor

163

163

163

0.56

177

177

177

0.38

Net income attributable to non-controlling interests

4

4

—

—

Tax expense

58

58

3

3

Interest expense, net

72

72

154

154

Depreciation and amortization

130

368

EBITDA, EBIT, Net income, and EPS

427

297

163

0.56

702

334

177

0.38

Impact of hyperinflation

3

3

3

0.01

4

4

4

0.01

Restructuring, integration and related expenses,
net(1)

23

23

23

0.08

112

112

112

0.24

Transaction costs

10

10

10

0.03

6

6

6

0.01

Other

(10)

(10)

(10)

(0.03)

3

3

3

0.01

Amortization of acquired intangibles(2)

40

40

0.14

144

144

0.31

Interest expense Berry Transaction

—

—

13

0.03

Tax effect of above items

4

0.01

(59)

(0.13)

Adjusted EBITDA, EBIT, Net income and EPS

453

363

233

0.80

826

603

400

0.86

Reconciliation of adjusted growth to constant currency growth

% growth – Adjusted EBITDA, EBIT, Net income, and EPS

83

66

72

7

% currency impact

(5)

(5)

(5)

(3)

% constant currency growth

77

62

67

4

% items affecting comparability(3)

75

58

% from all other sources

2

4

Adjusted EBITDA

453

826

Interest paid, net

(91)

(114)

Income tax paid

(52)

(86)

Purchase of property, plant and equipment and

other intangible assets

(98)

(222)

Proceeds from sales of property, plant and

equipment and other intangible assets, net of
restructuring

6

8

Movement in working capital

153

(42)

Other

(13)

(12)

Adjusted Free Cash Flow

358

358

Berry Transaction, restructuring and Integration
costs, net

—

(69)

Free Cash Flow

358

289

All periods have been retroactively adjusted to reflect the 1 for 5 reverse stock split effected on January 14, 2026.

(1) Three months ended December 31, 2025 primarily reflects restructuring and integration costs incurred in connection with the Berry Global acquisition, inclusive of inventory discrepancies of $15 million, including errors from prior periods, tied to manufacturing inefficiencies and other management issues which supported the decision to close three facilities in Asia.

(2) Amortization of acquired intangible assets from business combinations.

(3) Reflects the impact of acquired, disposed, and ceased operations.


Six Months Ended December 31, 2024

Six Months Ended December 31, 2025

($ million)

EBITDA

EBIT

Net
Income

EPS
(Diluted)
(1)

EBITDA

EBIT

Net
Income

EPS
(Diluted)
(1)

Net income attributable to Amcor

354

354

354

1.22

439

439

439

0.95

Net income attributable to non controlling
interests

6

6

—

—

Tax expense

101

101

52

52

Interest expense, net

147

147

307

307

Depreciation and amortization

270

723

EBITDA, EBIT, Net income and EPS

878

608

354

1.22

1,521

798

439

0.95

Impact of hyperinflation

5

5

5

0.02

15

15

15

0.03

Restructuring, integration and related expenses,
net(2)

29

29

29

0.10

165

165

165

0.35

Transaction costs

10

10

10

0.03

28

28

28

0.06

Other

(3)

(3)

(3)

(0.01)

7

7

7

0.01

Amortization of acquired intangibles(3)

79

79

0.27

277

277

0.60

Interest expense Berry Transaction

—

—

26

0.06

Tax effect of above items

(7)

(0.02)

(109)

(0.24)

Adjusted EBITDA, EBIT, Net income and EPS

919

728

467

1.61

1,736

1,290

848

1.83

Reconciliation of adjusted growth to constant currency growth

% growth – Adjusted EBITDA, EBIT, Net income, and EPS

89

77

82

14

% currency impact

(4)

(4)

(4)

(3)

% constant currency growth

85

73

77

11

% items affecting comparability(4)

83

69

% from all other sources

2

4

Adjusted EBITDA

919

1,736

Interest paid, net

(127)

(263)

Income tax paid

(127)

(191)

Purchase of property, plant and equipment and

other intangible assets

(243)

(459)

Proceeds from sales of property, plant and

equipment and other intangible assets, net of
restructuring

7

10

Movement in working capital

(433)

(611)

Other

(34)

(91)

Adjusted Free Cash Flow

(38)

131

Berry Transaction, restructuring and Integration
costs, net

—

(184)

Free Cash Flow

(38)

(53)

All periods have been retroactively adjusted to reflect the 1 for 5 reverse stock split effected on January 14, 2026.

(1) Calculation of diluted EPS for the six months ended December 31, 2024 excludes net income attributable to shares to be repurchased under
forward contracts of $1 million.

(2) Six months ended December 31, 2025 primarily reflects restructuring and integration costs incurred in connection with the Berry Global
acquisition.

(3) Amortization of acquired intangible assets from business combinations.

(4) Reflects the impact of acquired, disposed, and ceased operations.


Reconciliation of adjusted EBIT by reportable segment

Three Months Ended December 31, 2024

Three Months Ended December 31, 2025

($ million)

Global
Flexible
Packaging
Solutions

Global
Rigid
Packaging
Solutions

Other

Total

Global
Flexible
Packaging
Solutions

Global
Rigid
Packaging
Solutions

Other

Total

Net income attributable to Amcor

163

177

Net income attributable to non-
controlling interests

4

—

Tax expense

58

3

Interest expense, net

72

154

EBIT

259

62

(24)

297

250

137

(53)

334

Impact of hyperinflation

—

3

—

3

1

3

—

4

Restructuring, integration and related
expenses, net(1)

23

—

—

23

70

25

16

112

Transaction costs

—

—

10

10

—

1

5

6

Other

3

(14)

1

(10)

6

(7)

4

3

Amortization of acquired intangibles(2)

37

2

1

40

75

68

1

144

Adjusted EBIT

322

53

(12)

363

402

228

(27)

603

Adjusted EBIT / sales %

12.8 %

7.3 %

11.2 %

12.6 %

10.1 %

11.1 %

Reconciliation of adjusted growth to comparable constant currency growth

% growth – Adjusted EBIT

25

327

—

66

% currency impact

(3)

(18)

—

(5)

% constant currency growth

22

308

—

62

% items affecting comparability(3)

20

306

—

58

% from all other sources

2

2

—

4

(1) Three months ended December 31, 2025 primarily includes costs incurred in connection with the Berry Global acquisition.

(2) Amortization of acquired intangible assets from business combinations.

(3) Reflects the impact of acquired, disposed, and ceased operations.


Six Months Ended December 31, 2024

Six Months Ended December 31, 2025

($ million)

Global
Flexible
Packaging
Solutions

Global
Rigid
Packaging
Solutions

Other

Total

Global
Flexible
Packaging
Solutions

Global
Rigid
Packaging
Solutions

Other

Total

Net income attributable to Amcor

354

439

Net income attributable to non-
controlling interests

6

—

Tax expense

101

52

Interest expense, net

147

307

EBIT

539

121

(52)

608

572

338

(111)

798

Impact of hyperinflation

—

5

—

5

3

12

—

15

Restructuring, integration and related
expenses, net(1)

29

—

—

29

84

54

26

165

Transaction costs

—

—

10

10

8

2

18

28

Other

9

(14)

2

(3)

8

(4)

3

7

Amortization of acquired intangibles(2)

74

3

2

79

153

121

3

277

Adjusted EBIT

651

115

(38)

728

828

523

(61)

1,290

Adjusted EBIT / sales %

12.9 %

7.5 %

11.0 %

12.9 %

11.0 %

11.5 %

Reconciliation of adjusted growth to comparable constant currency growth

% growth – Adjusted EBIT

27

354

—

77

% currency impact

(2)

(15)

—

(4)

% constant currency growth

25

339

—

73

% items affecting comparability(3)

22

352

—

69

% from all other sources

3

(13)

—

4

(1) Six months ended December 31, 2025 primarily includes costs incurred in connection with the Berry Global acquisition.

(2) Amortization of acquired intangible assets from business combinations.

(3) Reflects the impact of acquired, disposed, and ceased operations.


Reconciliation of net debt 

($ million)

June 30, 2025

December 31, 2025

Cash and cash equivalents

(827)

(1,057)

Short-term debt

116

83

Current portion of long-term debt

141

436

Long-term debt, less current portion

13,841

14,619

Net debt

13,271

14,081

Cautionary Statement Regarding Forward-Looking Statements

Unless otherwise indicated, references to “Amcor,” the “Company,” “we,” “our,” and “us” in this document refer to Amcor plc and its consolidated subsidiaries. This document contains certain statements that are “forward-looking statements” within the meaning of the safe harbor provisions of the U.S. Private Securities Litigation Reform Act of 1995. Forward-looking statements are generally identified with words like “believe,” “expect,” “target,” “project,” “may,” “could,” “would,” “approximately,” “possible,” “will,” “should,” “intend,” “plan,” “anticipate,” “commit,” “estimate,” “potential,” “ambitions,” “outlook,” or “continue,” the negative of these words, other terms of similar meaning, or the use of future dates. Such statements are based on the current expectations of the management of Amcor and are qualified by the inherent risks and uncertainties surrounding future expectations generally. Actual results could differ materially from those currently anticipated due to a number of risks and uncertainties. Neither Amcor nor any of its respective directors, executive officers, or advisors, provide any representation, assurance, or guarantee that the occurrence of the events expressed or implied in any forward-looking statements will actually occur or if any of them do occur, what impact they will have on the business, results of operations or financial condition of Amcor. Should any risks and uncertainties develop into actual events, these developments could have a material adverse effect on Amcor’s business, including the ability to successfully realize the expected benefits of the merger of Amcor and Berry Global Group, Inc. Risks and uncertainties that could cause actual results to differ from expectations include, but are not limited to: risks arising from the integration of the Amcor and Berry Global Group, Inc., (“Berry”) businesses as a result of the merger completed on April 30, 2025 (the “Transaction” or “Merger”); risk of continued substantial and unexpected costs or expenses resulting from the Transaction; risk that the anticipated benefits of the Transaction may not be realized when expected or at all; risk that the Company’s significant indebtedness may limit its flexibility and increase its borrowing costs; risk that the Merger-related tax liabilities could have a material impact on the Company’s financial results; risk that the strategic review of our portfolio may cause disruptions to our business or may not result in completion of a transaction to restructure or divest non-core businesses or may not create additional value for our shareholders; changes in consumer demand patterns and customer requirements in numerous industries; risk of loss of key customers, a reduction in their production requirements, or consolidation among key customers; significant competition in the industries and regions in which we operate; an inability to expand our current business effectively through either organic growth, including product innovation, investments, or acquisitions; challenging global economic conditions; impacts of operating internationally; price fluctuations or shortages in the availability of raw materials, energy and other inputs, which could adversely affect our business; production, supply, and other commercial risks, including counterparty credit risks, which may be exacerbated in times of economic volatility; pandemics, epidemics, or other disease outbreaks; an inability to attract, develop, and retain our skilled workforce and manage key transitions; labor disputes and an inability to renew collective bargaining agreements at acceptable terms; physical impacts of climate change; significant disruption at a key manufacturing facility; cybersecurity risks, which could disrupt our operations or risk of loss of our sensitive business information; failures or disruptions in our information technology systems which could disrupt our operations, compromise customer, employee, supplier, and other data; rising interest rates that increase our borrowing costs on our variable rate indebtedness and could have other negative impacts; foreign exchange rate risk; a significant write-down of goodwill and/or other intangible assets; a failure to maintain an effective system of internal control over financial reporting; an inability of our insurance policies, including our use of a captive insurance company, to provide adequate protection against all of the key operational risks we face; an inability to defend our intellectual property rights or intellectual property infringement claims against us; litigation, including product liability claims or litigation related to Environmental, Social, and Governance (“ESG”) matters, or regulatory developments; increasing scrutiny and changing expectations from investors, customers, suppliers, and governments with respect to our ESG practices and commitments resulting in additional costs or exposure to additional risks; changing ESG government regulations including climate-related rules; changing environmental, health, and safety laws; changes in tax laws or changes in our geographic mix of earnings; and changes in trade policy, including tariff and custom regulations or failure to comply with such regulations.  These risks and uncertainties are supplemented by those identified from time to time in our filings with the Securities and Exchange Commission (the “SEC”), including without limitation, those described under Part I, “Item 1A – Risk Factors” in our Annual Report on Form 10-K for the fiscal year ended June 30, 2025, and as updated by our quarterly reports on Form 10-Q. You can obtain copies of Amcor’s filings with the SEC for free at the SEC’s website (www.sec.gov). Forward-looking statements included herein are made only as of the date hereof and Amcor does not undertake any obligation to update any forward-looking statements, or any other information in this communication, as a result of new information, future developments or otherwise, or to correct any inaccuracies or omissions in them which become apparent, except as expressly required by law. All forward-looking statements in this communication are qualified in their entirety by this cautionary statement. 

Presentation of non-GAAP information

Included in this release are measures of financial performance that are not calculated in accordance with U.S. GAAP. These measures include adjusted EBITDA and EBITDA (calculated as earnings before interest and tax and depreciation and amortization), adjusted EBIT and EBIT (calculated as earnings before interest and tax), adjusted net income, adjusted earnings per share, adjusted free cash flow, and net debt.  In arriving at these non-GAAP measures, we exclude items that either have a non-recurring impact on the income statement or which, in the judgment of our management, are items that, either as a result of their nature or size, could, were they not singled out, potentially cause investors to extrapolate future performance from an improper base. Note that while amortization of acquired intangible assets is excluded from non-GAAP adjusted financial measures, the revenue of the acquired entities and all other expenses unless otherwise stated, are reflected in our non-GAAP financial performance earnings measures. While not all inclusive, examples of these items include: material restructuring programs, including associated costs such as employee severance, pension and related benefits, impairment of property and equipment and other assets, accelerated depreciation, termination payments for contracts and leases, contractual obligations, and any other qualifying costs related to restructuring plans; material sales and earnings from disposed or ceased operations and any associated profit or loss on sale of businesses or subsidiaries; changes in the fair value of economic hedging instruments on commercial paper and contingent purchase consideration; pension settlements; impairments in goodwill and equity method investments; material acquisition compensation and transaction costs such as due diligence expenses, professional and legal fees, financing-related expenses; and integration costs; material purchase accounting adjustments for inventory; amortization of acquired intangible assets from business combination; gains or losses on significant property and divestitures and significant property and other impairments, net of insurance recovery; certain regulatory and legal matters; impacts from highly inflationary accounting; expenses related to the Company’s CEO and CFO  transition; and impacts related to the Russia–Ukraine conflict.

Amcor also evaluates performance on a comparable constant currency basis, which measures financial results assuming constant foreign currency exchange rates used for translation based on the average rates in effect for the comparable prior year period. In order to compute comparable constant currency results, we multiply or divide, as appropriate, current-year U.S. dollar results by the current year average foreign exchange rates and then multiply or divide, as appropriate, those amounts by the prior-year average foreign exchange rates. We then adjust for other items affecting comparability. While not all inclusive, examples of items affecting comparability include the difference between sales or earnings in the current period and the prior period related to disposed, or ceased operations. Comparable constant currency net sales performance also excludes the impact from passing through movements in raw material costs.  

Management has used and uses these measures internally for planning, forecasting and evaluating the performance of the Company’s reporting segments and certain of the measures are used as a component of Amcor’s Board of Directors’ measurement of Amcor’s performance for incentive compensation purposes. Amcor believes that these non-GAAP measures are useful to enable investors to perform comparisons of current and historical performance of the Company. For each of these non-GAAP financial measures, a reconciliation to the most directly comparable U.S. GAAP financial measure has been provided herein. These non-GAAP financial measures should not be construed as an alternative to results determined in accordance with U.S. GAAP. The Company provides guidance on a non-GAAP basis as we are unable to predict with reasonable certainty the ultimate outcome and timing of certain significant forward-looking items without unreasonable effort.  These items include but are not limited to the impact of foreign exchange translation, restructuring program costs, asset impairments, possible gains and losses on the sale of assets, certain tax related events, and difficulty in making accurate forecasts and projections in connection with the legacy Berry Global business given recency of access to all relevant information. These items are uncertain, depend on various factors, and could have a material impact on U.S. GAAP earnings and cash flow measures for the guidance period.

Reconciliations of  fiscal 2026 projected non-GAAP measures are not included herein because the individual components are not known with certainty as individual financial statements for fiscal 2026 have not been completed.

Reverse Stock Split

On January 14, 2026, the Company filed a an amendment to its memorandum of association to effect a 1-for-5 reverse stock split (the “Reverse Split”) of the Company’s ordinary shares. The Reverse Split became effective on January 14, 2026 and reduced the number of authorized ordinary shares to 1,800,000,000 and increased the par value of the ordinary shares to $0.05 per share. Accordingly, all share and per share amounts for all periods presented in the discussion within this release have been adjusted retroactively, where applicable, to reflect the Reverse Split.

Presentation of combined volume performance

In order to provide the most meaningful comparison of results of volume performance by region and end market for Amcor plc and for each of its reportable segments, the Company has included commentary to reflect Amcor’s estimate of year-over-year volume performance for the three and six months ended December 31, 2025 compared with estimated combined volumes for the legacy Amcor and Berry Global businesses for the three and six months ended December 31, 2024. The combined volume performance information has been presented for informational purposes and Amcor believes this information reflects the impact of the combination including allocation of volumes across the combined production footprint since May 1, 2025.  For the avoidance of doubt, combined volume performance information is not intended to be, and was not, prepared on a basis consistent with pro forma financial information required by Article 11 of Regulation S-X.

Dividends

Amcor has received a waiver from the ASX’s settlement operating rules, which will allow the Company to defer processing conversions between its ordinary share and CDI registers from February 24, 2026 to February 25, 2026 inclusive. 


IFS Nexus Black Launches Resolve for Utilities

  • Resolve addresses most costly inefficiencies facing Utility providers: workforce shortages, aging infrastructure, and extreme weather response
  • Next-generation technician management, fault reporting, and predictive maintenance for Field Service Management embeds Industrial AI to transform disaster response and grid modernization 

SAN DIEGO, Feb. 4, 2026 /PRNewswire/ — IFS, the world’s leading provider of Industrial AI software, today launched IFS Nexus Black Resolve for Utilities – purpose-built and combining decades of utilities expertise with cutting-edge AI capabilities to revolutionize the most inefficient element of field service operations. The announcement was made at DISTRIBUTECH® International 2026, where IFS is demonstrating how utilities can apply AI to navigate increasingly complex challenges – from aging infrastructure and extreme weather to workforce constraints, rising customer expectations, and increasing regulatory pressure. 

Resolve for Utilities represents a breakthrough in how energy and utilities companies respond to disasters, manage daily operations, and modernize the grid. Developed by IFS Nexus Black, the solution extends proven IFS Field Service Management technology with AI to deliver rapid innovation that gets results in weeks, not months – while maintaining the reliability, scalability, and security that utilities demand. 

AI That Understands the Realities of Utilities Operations

Unlike generic AI solutions designed for white-collar workers, Resolve for Utilities is designed for the field technicians, planners, and crews who keep the lights on and water flowing. The solution addresses the stark realities facing utilities: skilled workforce shortages, extreme weather events increasing in frequency and severity, aging infrastructure requiring urgent modernization, and communities expecting faster restoration times.

Transformative Capabilities for Modern Utilities Built on a Foundation of Innovation 

Resolve for Utilities introduces a powerful suite of capabilities to revolutionize field service operations in the face of these compounding challenges, ensuring that the “last mile” to the customer is state-of-the-art, setting the bar for Workforce Management today and tomorrow, regardless of work or worker type. 

  • Intelligent Crew Callout for Rapid Response: Resolve uses AI to coordinate crews for essential work – from planned maintenance on aging infrastructure to emergency response during floods, storms, or wildfires. The system provides real-time visibility into crew availability, seamlessly communicates with field workers, and manages operations across regions and states – freeing up planners to focus on strategic decisions while AI handles coordination friction.
  • Mutual Aid Technology for Large-Scale Disasters: When major storms strike, utilities must rapidly coordinate with neighboring companies. Resolve’s Mutual Aid capabilities use AI to enable seamless communication and resource sharing across organizational boundaries, protecting communities faster when they need it most. 
  • Intelligent Support for Field Crews: Resolve’s enhanced mobile capability dramatically improves field crew productivity through intelligent guidance based on real-time data, equipment images, and historical patterns. 

The new solution extends IFS’s track record as the trusted* partner for utilities worldwide. IFS already delivers the most comprehensive Asset Lifecycle Management platform on the market, including Asset Investment Planning, Capital Project Management, Supply Management, and AI-based Scheduling Optimization, integrated with the recognized #1 Enterprise Asset Management** solution. 

Carol Johnston, Vice President, Energy & Utilities, IFS, said: “Utilities are navigating an increasingly complex operating environment — from workforce constraints to extreme weather and grid modernization, with increasingly high customer expectations. Our intense attention to this area reflects both our heritage in Utilities FSM and our commitment to evolving alongside our customers with modern, practical innovation. Nobody understands the utilities market like IFS, and it’s this industry-specific application of AI that is enabling the Utility providers we work with to radically improve efficiencies and deliver better moments of service to their own customers.” 

Kriti Sharma, CEO of IFS Nexus Black, said: “Our approach is simple: listen closely to our utility customers, innovate quickly where it matters most, and deliver solutions that perform under real-world conditions – fast. This is AI designed for the workers who restore power in treacherous conditions, who scale transmission poles after disasters, and who keep critical infrastructure running 24/7. When lives are on the line, safe, reliable AI isn’t optional – it’s everything.” 

Experience Resolve for Utilities at DISTRIBUTECH® International 2026, booth #6025: IFS is demonstrating how Resolve for Utilities translates into real-world outcomes – from everyday field service execution to large-scale emergency response in the wake of floods, storms, and fires. Attendees are invited to engage with IFS product and industry experts to learn more about the future of Utilities FSM. 

Learn more: IFS Nexus Black (Opens in a new tab)

* Only vendor named Customers’ Choice for 2025 Field Service Management category on Gartner® Peer Insights™ 

** Gartner, “Market Guide for Enterprise Asset Management Software”, Kristian Steenstrup, Nicole Foust, 24 July 2024 

CONTACT:

IFS Press Contacts:
EUROPE / MEA / APJ: Adam Gillbe
IFS, Director of Corporate & Executive Communications
Email: adam.gillbe@ifs.com

NORTH AMERICA / LATAM: Mairi Morgan
IFS, Director of Corporate & Executive Communications
Email: mairi.morgan@ifs.com 

This information was brought to you by Cision http://news.cision.com

The following files are available for download:

KHUFU’S IN EGYPT NAMED NO.1 AT MIDDLE EAST & NORTH AFRICA’S 50 BEST RESTAURANTS 2026

ABU DHABI, United Arab Emirates, Feb. 4, 2026 /PRNewswire/ — Khufu’s in Giza, Egypt, has been crowned The Best Restaurant in the Middle East & North Africa 2026, sponsored by S.Pellegrino & Acqua Panna, following the awards ceremony for the fifth edition of Middle East & North Africa’s 50 Best Restaurants 2026, held at Emirates Palace Mandarin Oriental, Abu Dhabi. The list features restaurants from 14 cities across the region, including Marrakech, Beirut, Doha, Casablanca and Amman, with 16 new entries making a debut this year.

Khufu’s in Giza, Egypt, takes the No.1 spot in Middle East & North Africa’s 50 Best Restaurants 2026, sponsored by S.Pellegrino & Acqua Panna

For the full 1-50 list, click here.

Founded on a deep respect for Egyptian culinary heritage, Khufu’s celebrates the flavours of the Nile Valley through refined modern interpretation. Set in the shadow of the Great Pyramids, it delivers a dining experience that blends contemporary Egyptian gastronomy with one of the world’s most iconic locations.

Three Dubai-based restaurants follow with Kinoya (No.2), Trèsind Studio (No.3) and Orfali Bros (No.4); the latter having previously maintained the No.1 position for three consecutive years. Beihouse in Beirut (No.5) completes the top five and wins the Highest New Entry Award. 

Among the special awards winners, Reif Kushiyaki Cairo (No.20) claims the Highest Climber Award after rising 27 places. Sara Aqel of Dara Dining by Sara Aqel (No.30) is named MENA’s Best Female Chef, sponsored by Elle & Vire Professionnel, while Omar and Wassim Orfali take home the MENA’s Best Pastry Chef Award, sponsored by Valrhona. Salam Dakkak of Sufret Maryam (No.7) and Bait Maryam wins the Sevenrooms Icon Award. Himanshu Saini from Trèsind Studio (No.3) earns the Estrella Damm 0.0% Chefs’ Choice Award and Farmers (No.49) receives the Sustainable Restaurant Award, sponsored by illy.

Three special award winners were also announced ahead of the awards ceremony. Muna Haddad, founder of Baraka Destinations, received the Champions of Change Award for her community-driven approach to hospitality and tourism in Jordan. La Grande Table Marocaine (No.19) at Royal Mansour Marrakech won the Art of Hospitality Award, acknowledging its dedication to Moroccan fine dining. Dubai’s Middle Child was presented with the One To Watch Award for its potential to break into future lists of MENA’s 50 Best Restaurants.

The list is compiled by the MENA’s 50 Best Restaurants Academy, comprised of 250 independent experts across the region. Please find more details here.

Media Centre: https://mediacentre.theworlds50best.com

PDF – https://mma.prnewswire.com/media/2872087/50_Best.pdf


Blockchain.com & Ondo Finance Launch Onchain Tokenized U.S. Stocks Across Europe

In partnership with Ondo Global Markets, NYSE-listed equities and ETFs are now accessible to millions of eligible users across Europe directly via the Blockchain.com wallet

LONDON and NEW YORK, Feb. 4, 2026 /PRNewswire/ — Blockchain.com and Ondo Finance today announced an expansion of their partnership to offer real-world assets (RWAs) onchain to the European market. Eligible users across Europe can now gain direct access to regulated, tokenized U.S. stocks and ETFs seamlessly within the Blockchain.com DeFi wallet.

Last year, through its DeFi wallet, Blockchain.com and Ondo Global Markets introduced over 200 tokenized stocks and ETFs to users in Africa and South America, offering onchain exposure to some of the most recognizable companies.

“By bringing U.S. equities onchain for our European users, we are providing self-custody solutions through our DeFi wallet that are faster, more efficient and completely self-owned that remain unmatched by traditional banks,” said Peter Smith, CEO, Founder and Executive Chairman at Blockchain.com. “Building on our momentum in Africa and South America through this partnership with Ondo, we are making a more inclusive and secure financial system a reality for millions across Europe and beyond.”

Since its launch in September 2025, Ondo Global Markets has seen explosive growth, reflecting the surging demand for institutional-grade assets on the blockchain. With a total value locked (TVL) surpassing $556 million and trading volume exceeding $8.7 billion, the platform is a dominant force in the Real World Asset (RWA) sector.

“Extending availability to users across the EEA through the Blockchain.com DeFi wallet allows Ondo tokenized stocks and ETFs to reach a previously unavailable segment of the platform’s global user base,” said Ian De Bode, President at Ondo Finance. “We look forward to seeing how this expansion supports adoption as we continue to drive tokenization across global markets.”

This announcement marks a significant shift for European investors who can now access institutional-grade assets with the ease of a digital wallet, including:

  • Users across 30 EEA states can now buy, sell, and hold over 200 tokenized U.S. stocks and ETFs via the DeFi wallet.
  • Assets are managed directly within the familiar Blockchain.com Wallet interface, removing the friction of traditional brokerage accounts.
  • Amid strong performance in precious metals markets, Ondo Global markets offers onchain access to tokenized precious metals ETFs, including SLVon (Silver) and IAUon (Gold), enabling commodities exposure within its existing tokenized ETF lineup.

About Blockchain.com
Blockchain.com is connecting the world to the future of finance. The global leader in crypto services helping millions across the globe safely access cryptocurrency. Since its inception in 2011, Blockchain.com has earned the trust of more than 90 million wallets and over 40 million verified users, and has facilitated over $1.2 trillion in crypto transactions. Visit Blockchain.com for more information.

About Ondo Finance:
Ondo Finance is a blockchain-based platform focused on tokenizing real-world assets and bringing institutional-quality financial products on-chain. By bridging traditional finance and decentralized infrastructure, Ondo aims to make capital markets more accessible, transparent, and efficient.

Media Contact: press@blockchain.com

Role of CathWorks FFRangio for the Assessment of Coronary Artery Disease Now Reinforced by SCAI Expert Opinion

NEWPORT BEACH, Calif., Feb. 4, 2026 /PRNewswire/ — CathWorks, a global leader in digital health innovations, announced that the Society for Cardiovascular Angiography & Interventions (SCAI) published an expert opinion discussing the expanding role of angiography-derived physiology (ADP), a wire-free method for coronary physiologic assessment. By applying different principles, in some cases in conjunction with artificial intelligence (AI), ADP provides physiologic insights from routine angiograms, representing a paradigm shift in the catheterization lab.

Role of CathWorks FFRangio for the Assessment of Coronary Artery Disease Now Reinforced by SCAI Expert Opinion

The expert opinion focused on the technological differences between current FDA-approved ADP technologies and their peer-reviewed validation and outcomes studies. The CathWorks FFRangio® System is a unique ADP that combines AI and advanced computational science to obtain physiologic information from three routine angiograms leveraging a resistance-based computational approach. “FFRangio is the only technology that provides multivessel FFR values across the entire coronary tree, including side branches. It also offers a simulated pullback to differentiate functional disease and supports PCI planning, which is more limited in other systems,” as stated in the expert opinion.

CathWorks FFRangio has demonstrated excellent diagnostic accuracy and promising clinical outcomes while eliminating the drawbacks associated with traditional physiology including the need for an invasive pressure wire, anticoagulation or hyperemic agents. In a pooled analysis of five prospective studies including the FAST-FFR pivotal study, CathWorks FFRangio demonstrated an excellent diagnostic accuracy of 93%.1 CathWorks FFRangio has also shown comparable one-year major adverse cardiac event (MACE) rates to invasive FFR in both real-world registries2-3 and the PROVISION randomized controlled trial (RCT) that included 400 patients.4

The SCAI expert opinion clearly outlines that ADP systems vary widely between imaging requirements, workflow integration and computational approaches and that clinical data should be interpreted in the context of platform-specific validation. The published document highlights that CathWorks FFRangio is the only FDA-approved ADP platform that:

  • Provides comprehensive multi-vessel coronary physiology and a suite of PCI planning tools
  • Demonstrated excellent diagnostic accuracy consistently across multiple peer-reviewed validation studies1
  • Showed comparable clinical outcomes to invasive FFR at one year in both real-world registries2-3 and a RCT4

“With the rapidly expanding clinical evidence base for CathWorks FFRangio, we look forward to the U.S. and European guidelines incorporating peer-reviewed evidence-based technology specific recommendations that will broaden adoption of physiology overall, ultimately optimizing procedural decision-making and improving patient outcomes,” said Ramin Mousavi, President and CEO of CathWorks.

ARTICLE URL: https://www.jscai.org/article/S2772-9303(25)01602-3/fulltext

  1. Witberg G et al. Diagnostic performance of angiogram-derived fractional flow reserve: a pooled analysis of 5 retrospective cohort studies. J Am Coll Cardiol Intv. 2020;13(4):488-97.
  2. Witberg G et al. Mid-term clinical outcomes of FFRangio guided treatment for coronary artery disease: insights from an international multicentre registry. Cardiovasc Revasc Med. 2026;23:S1533-8389(26)00013-8.
  3. Sara JDS et al. Clinical implementation of FFRangio for resvascularization guidance: multicenter U.S. experience, as presented at TCT 2025.
  4. Tanigaki T et al. Prospective randomized clinical outcomes of angiography-based fractional flow reserve guidance versus wire-based fractional flow reserve, PROVISION Trial, as presented at EuroPCR 2025. UMIN clinical registry ID: UMIN000049230.

ABOUT CATHWORKS

CathWorks is the leader in digital health innovations that can improve the lives of patients globally. The CathWorks FFRangio® System combines artificial intelligence and advanced computational science, transforming how cardiovascular disease is diagnosed and treated. The FFRangio System obtains physiologic information from routine angiograms, eliminating the need for drug stimulation and invasive pressure wires. It provides physicians with quick and reliable intraprocedural FFRangio values for the entire coronary tree. For more information on CathWorks, visit www.cath.works and follow @CathWorks on LinkedIn. 

Investors:
Mike Feher
mike.feher@cath.works

Media:
Sarita Monico
sarita.monico@cath.works


/DISREGARD RELEASE: EverMind/

We are advised by EverMind that journalists and other readers should disregard the news release, End the Agentic Amnesia: EverMind Launches EverMemOS Cloud and Kicks Off “Memory Genesis 2026” Global Developer Hackathon Supported by OpenAI, issued 03-Feb-2026 over PR Newswire.