Home Blog Page 1690

Real Estate and Hospitality Conferences in Southeast Asia – WeHub Event Series 2026 Dates Released

HO CHI MINH CITY, Vietnam, Dec. 17, 2025 /PRNewswire/ — In a period where companies’ positions and leadership roles are constantly evolving and changing, WeHub stands out as a leading regional platform that connects professionals in the real estate and hospitality sectors effectively. With some of the best-in-class events, conferences, and seminars in Southeast Asia, the WeHub community allows its members, sponsors, and attendees to connect, create leads, and expose their products to the largest real estate developers and hotel owners across the region.

Active across Southeast Asia, WeHub specializes in curating high-level conferences, networking events, and knowledge-driven programs that bring together developers, hotel owners, operators, designers, and senior industry leaders.

Following a remarkable year in 2025, with more than 6,600 registrations and 3,700 high-level attendees across Southeast Asia, including 1,000+ representatives from real estate developers, 150+ hotel owners, 200+ designers and architects, 500+ general managers and senior hotel operations team members, WeHub is excited to introduce its full event series for 2026, featuring both the Meet The Experts (MTE) conference and the HoSkar Night networking events across Southeast Asia. Last year’s calendar brought together thousands of industry professionals across Ho Chi Minh City, Bangkok, Phnom Penh, Hanoi, and Manila, reaffirming WeHub’s position as one of the region’s most anticipated platforms for meaningful connection and knowledge exchange.

Mark your calendar for the 2026 event series, taking place across key cities in the region. Highlights include the MTE conference in Ho Chi Minh City (31 March) and Hanoi (October), as well as HoSkar Night events in Ho Chi Minh City (31 March), Bangkok (May), Manila (June), Ho Chi Minh City (July), Hanoi (October), and Phnom Penh (November).

Source: Grand ballroom at MTE HCMC 2025 - WeHub
Source: Grand ballroom at MTE HCMC 2025 – WeHub

The first major event of the year – MTE Ho Chi Minh City 2026 – will take place on 31 March from 1 PM to 9 PM at Vinpearl Landmark 81, Autograph Collection. As the region’s most well-attended conference, it aims to bring together developers, hotel owners, operators, consultants, and designers for an immersive program of keynote sessions, masterclasses, exclusive exhibitions, and networking opportunities. This will set the momentum for the rest of the year, leading into the regional HoSkar Night series and culminating in MTE Hanoi 2026, which will welcome the northern market’s development and hospitality community for another gathering of insights and collaboration.

WeHub’s annual program would not be possible without the incredible support of its sponsors and partners. If you’d like to showcase your brand, share your expertise, or explore collaboration opportunities for the 2026 season, we would be delighted to connect with you.

For sponsorship and collaboration inquiries, contact us at Host@wehubyou.com.

Visit WeHub website at https://wehub.asia/ or find out more information at WeHub LinkedIn.

Vision Asia Pacific is a registered company which owns WeHub and organizes many event series, including Meet The Experts conference (MTE) and HoSkar Night networking event. PR Newswire is the Media partner of those events.

About Meet The Experts (MTE)

One of the most attended conferences for Hospitality & Real Estate in Southeast Asia, MTE is a perfect bridge between international expertise & local industry. Latest trends, market insights, new products & services will be defined & displayed exclusively to the leading developers, consultants & industry players in one single event.

About HoSkar Night

HoSkar Night is the most vibrant networking event for Real Estate and Hospitality professionals. An easier way to connect to senior industry people, expand the network and build long-lasting relationships.

SEMIFIVE Strengthens AI ASIC Market Position Through IPO “Targeting Global Markets with Advanced-nodes, Large-Die Designs, and 3D-IC Technologies”

  • As demand shifts from general-purpose semiconductors toward AI ASICs, SEMIFIVE provides customized chip development solutions to fabless companies and device manufacturers.
  • New orders have increased from KRW 57.2 billion in 2022 to KRW 123.9 billion in 2024, driven by Big-Tech-Ready high-performance AI ASIC technologies, a highly efficient and scalable design platform, and turnkey services.
  • Profitability is expected to improve as more projects transition from development to mass production in the second half of this year.
  • The subscription period is scheduled for December 18–19, with listing expected within this year.

SEOUL, South Korea, Dec. 17, 2025 /PRNewswire/ — SEMIFIVE, a leading provider of custom AI semiconductor (ASIC) design, held an IPO press conference on December 17 at 63 Square in Seoul, outlining its post-listing growth strategy and long-term vision.

At the press conference, Brandon Cho, CEO and co-founder of SEMIFIVE, said, “Just as TSMC has platformized semiconductor manufacturing, SEMIFIVE is lowering barriers to entry by platformizing semiconductor design, enabling anyone to develop AI semiconductors quickly and easily. Through this IPO, we aim to secure leadership in next-generation technologies such as 3D-IC and further expand our engineering infrastructure, positioning SEMIFIVE at the forefront of the paradigm shift in the global AI ASIC industry.”

SEMIFIVE was established in 2019 with the motto, “A company that enables cheaper, faster, and easier development of system semiconductors,” specializing in the development of AI ASICs. The company provides comprehensive engineering services covering the entire process from design to mass production for a broad customer base that includes fabless companies, device manufacturers, and service providers. Its business model generates recurring revenue through a combination of development services, mass production, and IP-related revenues.

SEMIFIVE collaborates with major device manufacturers such as Hanwha Vision and a global NAND memory company (S company), as well as AI fabless firms including Furiosa AI, Rebellions, and HyperAccel. Its AI solutions are used across a wide range of applications, including data centers, edge computing, storage, cameras, smart glasses, and mobile devices. By expanding its customer portfolio across the United States, China, Japan, Europe, and India, SEMIFIVE has secured stable turnkey supply capabilities and long-term growth drivers in the global market.

SEMIFIVE’s business is broadly divided into three segments: Development Services, Mass Production Supply, and IP Business. Development Services encompass the entire ASIC process, offering an End-to-End solution from chip specification definition and IP selection to logic and physical design, sample production, packaging, testing, and software development. Mass Production Supply refers to the direct mass production and supply of developed ASICs through a foundry. This structure reinforces long-term customer relationships based on exclusive production rights and generates stable revenue. The demand for mass production continues throughout the product lifecycle following the development completion, resulting in long-term product sales.

Through its subsidiary Analog Bits, SEMIFIVE also operates an IP licensing business, generating annual licensing revenue of several tens of billions of KRW. Analog Bits is a global leader in low-power mixed-signal IP, supplying critical IP to leading foundries such as TSMC, Samsung Foundry, Intel, and Rapidus. By embedding proprietary IP into its design platform, SEMIFIVE has established a structural competitive advantage over general DSP providers with limited proprietary IP.

One of SEMIFIVE’s core strengths is its “Big-Tech-Ready” capability for developing highly complex AI ASICs. The company possesses comprehensive expertise across the entire value chain, spanning advanced process nodes (2nm–4nm), large-die chip design, and critical IP development required for high-performance AI semiconductor development and mass production.

At Samsung Foundry’s second-generation 2nm GAA process, SEMIFIVE is executing the first turnkey DSP project in the industry. Revenue contribution from leading-edge processes (2nm–4nm) increased sharply from 5% in 2022 to 41.4% as of cumulative Q3 2025. With the growing importance of large-die design in high-performance AI semiconductor development, SEMIFIVE has secured unique capabilities in this area. The company recently completed the design of a 500mm² chip for a domestic LLM-based AI semiconductor company and is currently developing an ultra-large 800mm² big-die HPC chip for an Asian AI semiconductor company.

In particular, SEMIFIVE is undertaking a globally advanced project applying 3D-IC technology to vertically stack four DRAM memory chips on an 800mm² accelerator chip. 3D-IC technology is regarded as a core enabler for next-generation AI chips, as it reduces chip area and minimizes the distance between compute logic and memory, thereby improving both performance and power efficiency.

Driven by growing demand in the AI ASIC market, SEMIFIVE’s order intake has increased rapidly year over year. New orders rose from KRW 5.7 billion in 2020 to KRW 57.2 billion in 2022 and surged to KRW 123.9 billion in 2024. As of cumulative Q3 2025, new orders reached KRW 125.7 billion, exceeding the full-year total for 2024.

This surge in new orders is attributed to SEMIFIVE’s platform-based design strategy and turnkey execution capabilities. The company enables AI fabless companies and device manufacturers with limited development resources to swiftly develop and mass-produce custom AI chips through a semiconductor design platform that maximize development efficiency and scalability and End-to-End (E2E) solutions covering the entire process from design to production.

Overseas revenue increased significantly from KRW 4.5 billion (4.4% of total revenue) in 2024 to KRW 55.0 billion (59.8%) on a cumulative basis as of the third quarter of 2025. The company is expanding its global sales network, primarily through its existing subsidiaries in the United States and China. To strengthen its ability to support global customers, the company also established its subsidiary in Japan in November 2025. As a result of this strategy, the company has successfully secured 14 global customers to date and is currently in discussions with 59 prospective customers regarding additional orders.

SEMIFIVE’s design platform applies software development methodologies to semiconductor design. Semiconductors are composed of multiple subsystems, including CPUs, high-speed interfaces, and memory. Rather than designing these elements for a single fixed product, the company develops them as modular building blocks that can be automatically reconfigured to meet diverse requirements, forming a design component library. Its proprietary “Design Automation Engine” retrieves, redesigns, integrates, and verifies modules according to chip specifications, significantly reducing development time, cost, and risk while accelerating time-to-market.

A SEMIFIVE representative commented, “Given the current AI ASIC market characteristics that demand a time-to-market strategy, it is fair to say that SEMIFIVE is one of very few companies, besides Broadcom which primarily serves Big Tech, capable of assisting across the entire spectrum of rapid ASIC product development.”

On its growth trajectory, SEMIFIVE plans to use the proceeds obtained from the IPO for expanding engineering resources, strengthening technology leadership through the acquisition of advanced global technologies and IP, and supporting business expansion and working capital needs as the share of mass production projects increases.

Key projects transitioning into full-scale mass production include AI security camera chips supported by a stable captive market from a major domestic conglomerate, data center AI chips such as AI accelerators, and core display driver chips for smart glasses, where demand from big tech companies is increasing. As these projects enter mass production sequentially, the company expects growth momentum to accelerate from 2026 onward.

SEMIFIVE IPO Schedule (Tentative)

Filing of Registration Statement

November 24, 2025

Bookbuilding

December 10–16, 2025

Subscription Period

December 18–19, 2025

KOSDAQ Listing (Expected)

December 29, 2025


Shares Offered

5,400,000 shares

Offering Price Range

KRW 21,000–24,000 per share

Expected Offering Amount

KRW 113.4–129.6 billion

Total Shares Outstanding Post-IPO

33,716,419 shares

Expected Market Capitalization

KRW 708.0–809.2 billion

Media Contact
Robin Kim, Senior Director, robin.kim@semifive.com

About SEMIFIVE
SEMIFIVE is the pioneer of platform based SoC design, working with customers to implement innovative ideas into custom silicon in the most efficient way. Our SoC platforms offer a powerful springboard for new chip designs and leverage configurable domain-specific architectures and pre-validated key IP pools. We offer comprehensive spec-to-system capabilities with end-to-end solutions so that custom SoCs can be realized faster, with reduced cost and risks for key applications such as data center or AI-enabled IoT. With a strong partnership with Samsung Foundry as a leading SAFE™ DSP partner, as well as the larger ecosystem, SEMIFIVE provides a one-stop shop solution for any SoC design needs. For more information, please visit www.semifive.com.

MoEngage Secures Additional $180 million in Series F Funding; Completes Liquidity Event for Employees & Investors

The round, led by ChrysCapital and Dragon Funds, underscores MoEngage’s global momentum as enterprises move beyond legacy marketing clouds to adopt MoEngage’s insights-led customer engagement platform for both marketing and product teams.

Demand for Merlin AI and MoEngage’s unified engagement suite continues to surge across North America, EMEA, Australia, New Zealand, and Southeast Asia as brands invest in deeper insights and connected customer experiences.

SINGAPORE, Dec. 17, 2025 /PRNewswire/ — MoEngage, the customer engagement platform for consumer brands, announced it has raised an additional $180 million as part of its Series F round. This follows the $100 million secured in November 2025, taking the total Series F raise to $280 million. The latest investment was led by new investors ChrysCapital and Dragon Funds, alongside Schroders Capital, with continued participation from current investors TR Capital and B Capital.

The capital will be used to accelerate innovation for the Merlin AI suite, scale go-to-market teams in North America and EMEA, and explore strategic acquisitions that extend the platform’s capabilities. MoEngage continues to deepen its presence across Australia, New Zealand, and Southeast Asia, where enterprise brands are modernizing their customer engagement stacks and unifying marketing and product workflows.

Alongside these growth investments, MoEngage has completed its second employee tender offer, totalling approximately $15 million, which benefits 259 current & former employees in their wealth creation journey. The round included select secondary transactions for early investors, namely Eight Roads, Helion Venture Partners, Matrix Partners, and Ventureast.

“At MoEngage, we believe our success is a collective effort, built on a culture of ownership and innovation. It is vital that we recognize the people who brought us to this stage,” said Raviteja Dodda, CEO & Co-founder, MoEngage. “This liquidity program reflects that commitment by ensuring that the builders of MoEngage, our employees, and early investors have the opportunity to directly share in the milestones we achieve together. We are grateful for the partnership of ChrysCapital, Dragon Funds, Schroders Capital, TR Capital, and B Capital as we continue to scale globally.”

Accelerating Growth in Southeast Asia and ANZ

Southeast Asia and ANZ are key growth markets for MoEngage, with enterprises in Singapore, Indonesia, the Philippines, Australia, and New Zealand rapidly adopting AI-powered, insights-led engagement platforms.

MoEngage partners with leading regional brands – including Kredivo, Alfamart, Blibli, XL Axiata, Trust Bank, Stan Entertainment, 13Cabs, Canstar, and TFE Hotels, as well as global names such as 7-Eleven, Coca-Cola, Starbucks, Samsung, Domino’s, KFC, and Nestlé, to unify customer data and deliver personalized, omnichannel experiences.

Building on its leadership as the customer engagement platform for marketers, MoEngage is strengthening its suite for Product Teams with MoEngage Analytics and MoEngage Inform. As modern customer engagement isn’t driven solely by marketing, product, and marketing teams must operate on shared data to ensure customer experiences are connected, not fragmented.

MoEngage Inform streamlines critical transactional messaging, such as OTPs, account updates and service updates, via a single API across messaging channels and delivery providers, ensuring reliability distinct from marketing campaigns. Meanwhile, the enhanced Product Analytics capabilities in MoEngage Analytics bridge the gap between insight and action. By unifying behavioral data with immediate engagement, MoEngage empowers Product Managers to uncover the ‘why’ behind user behavior and instantly trigger experiences that drive retention and LTV.

“Customer engagement has never belonged to just one team. Customers move through many moments, and those moments should feel connected and supportive,” added Dodda. “When product, engineering, and marketing work from the same data and tools, they can show up more naturally for their audiences. That’s the experience we want to help companies deliver so they can grow their brands.”

Rishabh Iyer, Vice President at ChrysCapital, stated, “ChrysCapital is excited to partner with MoEngage for its next phase of AI-led growth. This investment aligns with our strategy to back technology platforms, built in India for global enterprises, leveraging deep talent, capital efficiency, and a sophisticated understanding of enterprise needs. We are impressed by MoEngage’s disciplined operating model, sustained US execution, and broad product capabilities. We look forward to helping the team become the world’s leading marketing technology platform.”

Ridhi Chaudhary, CIO of Dragon Funds, said, “We are pleased to partner with MoEngage, impressed by its strong management, continuous product innovation, and durable growth. We believe MoEngage’s best-in-class product and AI capabilities position it well to lead the martech category.” Aakash Tulsani, Managing Director at Dragon Funds, added, “MoEngage sets the bar for innovation by leveraging AI on first-party data, making it essential for marketers. It is a privilege to partner with MoEngage again, having invested previously.”

“At Zeta, we are building the modern banking stack for the world’s leading financial institutions. As a data-driven company, we rely on deep customer insights to drive our product strategy,” said Bhavin Turakhia, Co-founder & CEO, Zeta. “MoEngage Analytics has helped us optimize critical journeys like onboarding, activation, and cross-sell, while their messaging capabilities allow us to instantly nudge customers. Effectively bridging the gap between insight and action. As a user of the product, I am impressed by the constant innovation. Additionally, MoEngage Inform has become essential for powering our mission-critical communications, delivering account and transaction updates with high reliability and speed.”

“MoEngage Inform has become a core part of how we run our e-commerce experience at Loblaw across our lines of business,” said Charu Pujari, SVP, AI and Engineering at Loblaw Digital. “It keeps customers updated on their delivery and pickup orders with the speed and reliability they expect, which has made a meaningful difference in how engaged and confident they feel throughout the process.”

Avendus Capital acted as the exclusive financial advisor to the company and its shareholders.

About MoEngage

Bengaluru and San Francisco-headquartered MoEngage is an insights-led customer engagement platform, trusted by over 1,350 global consumer brands, including SoundCloud, McAfee, Flipkart, Kayak, Domino’s, Deutsche Telekom, Travelodge, and more. MoEngage empowers marketers and product owners with insights into customer behavior, enabling them to act on those insights and engage customers across web, mobile, email, social, and messaging channels. Its Merlin AI suite, a team of AI agents, enables marketers to launch campaigns faster and scale conversions with AI Decisioning. Consumer brands across 75 countries utilize MoEngage to deliver digital experiences to over 2 billion consumers every month.

MoEngage was recognized as “Customers’ Choice” in Gartner Peer Insights™ Voice of the Customer for Multichannel Marketing Hubs, May 2025 and a “Strong Performer” in The Forrester Wave™: Cross-Channel Marketing Hubs, Q4 2024.

To learn more, visit www.moengage.com

For more information, please contact:
Pooja Poddar Jain, Lead – Communications
Email: pooja.poddar@moengage.com 

Young Lao Baseball Team Shines at Southeast Asia Games

Young Lao Baseball Team Shines at Southeast Asia Games
(photo supplied)

On 15 December, the Lao Men’s National Baseball Team finished fifth at the 33rd Southeast Asian (SEA) Games 2025 in Thailand, ending the tournament with a 2–4 record in a round-robin competition.

Transport Ministry Orders Changes to BRT Design as Project Faces Safety, Funding Challenges

BRT stop at Vientiane's That Foun Temple. (Photo: Laotian Times)

The Ministry of Public Works and Transport has ordered adjustments to the Bus Rapid Transit (BRT) project, shifting from concrete curbs to painted lane markings, according to an official notice issued on 16 December.

Under the directive, all concrete curbs already installed along the BRT route must be completely removed by the end of December.

The notice also states that if donor funding for the project is discontinued, the BRT project must be suspended.

The ministry clarified that the government or the project itself will bear the cost of removing the concrete curbs.

Contractors and the public will not be held responsible for any related removal work.

Prime Minister Approves Contractor Payments

The directive builds on an earlier decision by the Prime Minister, who approved payments to contractors for work already completed under the Vientiane Urban Sustainable Transport Project (VSUTP).

In an urgent notice issued by the Office of the Prime Minister on 12 December, authorities were instructed to proceed with contractor payments based on verified completion of works. The notice also ordered adjustments to the project, including the removal of road curbs and changes to BRT lane arrangements, following public concern over traffic congestion and safety.

The PM also tasked the Ministry of Public Works and Transport, the Vientiane Capital Administration, and the Ministry of Public Security with coordinating efforts to reduce traffic congestion during peak hours as authorities continue reviewing the BRT trial.

Traffic Safety

Public scrutiny intensified after several traffic accidents involving BRT lanes during the system’s trial phase in November, with five incidents reported within weeks of the free trial launch. On 23 November, a collision between a BRT bus and a motorbike in Phonsaath village injured a rider, while another crash later that day involved a car and motorbike at a different station. Additional accidents on 8 and 10 November damaged three cars and a motorbike.

In response, authorities restricted BRT lane operations to weekdays from 7:00 AM to 7:00 PM and banned private vehicles from entering or parking in the lanes during those hours, imposing fines on violators. The incidents immediately sparked debate on social media, with residents questioning lane design and enforcement, and some arguing the dedicated lanes worsened congestion on narrow roads.

The BRT system, launched in late November under the Vientiane Urban Sustainable Transport Project, features electric buses operating along six main stations and forms part of a USD 99.7 million project funded by the Lao government and international partners.

Otis Elevates Passenger Experience at Malaysia’s Armani Hallson KLCC

  • Otis vertical mobility solutions will power a new luxury residence in downtown Kuala Lumpur 
  • Otis will supply 26 advanced high-rise SkyRise® elevators

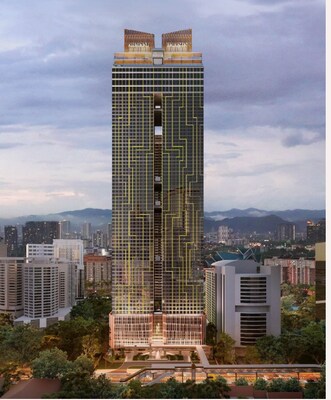
KUALA LUMPUR, Malaysia, Dec. 17, 2025 /PRNewswire/ — Otis is collaborating with construction company Vestland in Malaysia to deliver state of the art SkyRise® elevators, Compass® 360 Destination Management System and Otis ONE® IoT solution, with eView™ smart screens for the upscale residential development Armani Hallson KLCC, in downtown Kuala Lumpur City Centre (KLCC). Otis Worldwide Corporation (NYSE: OTIS) is the world’s leading elevator and escalator manufacturing, installation and service company.  

Armani Hallson KLCC
Armani Hallson KLCC

“We are honoured to be working with Armani Group development, in collaboration with Vestland, the project developer, to bring our cutting-edge technology and innovative design to Armani Hallson KLCC. Otis is proud to bring smart, modern and efficient vertical mobility experience for residents and visitors,” said Nicolas Lopez, Senior Vice President & Managing Director, Otis Southeast Asia.

How is Otis powering vertical transportation at Armani Hallson KLCC?

  • The building has three towers. The two SOVO towers rise 80 stories featuring 18 high-speed SkyRise® elevators travelling at up to 7 meters per second in banks of 9 elevators in each tower. The third tower, SOHO tower, reaches 70 stories and has 8 high-speed SkyRise elevators travelling at up to 6 meters per second in two banks of four elevators.
  • Otis will deliver exceptional passenger experience and optimized travel time with the Compass® 360 smart destination management system that dynamically adapts to passenger usage patterns in the building – and can take passengers to their destination as much as 50 percent faster than conventional systems.
  • The elevators will feature Otis ONE® technology with eView™ in-car display screens, delivering real-time information and an enhanced passenger experience, while also connecting passengers via voice or video calls to the OTISLINE™ customer care center in case of an emergency.
  • Each elevator has a ReGen™ drive, which captures energy usually wasted as heat and returns it to the building for use as power. It reduces energy consumption compared to conventional systems without regenerative technology.

About Otis

Otis gives people freedom to connect and thrive in a taller, faster, smarter world. The global leader in the manufacture, installation and servicing of elevators and escalators, we move 2.4 billion people a day and maintain approximately 2.4 million customer units worldwide – the industry’s largest Service portfolio. You’ll find us in the world’s most iconic structures, as well as residential and commercial buildings, transportation hubs and everywhere people are on the move. Headquartered in Connecticut, USA, Otis is 72,000 people strong, including 44,000 field professionals, all committed to manufacturing, installing and maintaining products to meet the diverse needs of our customers and passengers in more than 200 countries and territories. To learn more, visit www.otis.com and follow us on LinkedIn, YouTube, Instagram and Facebook @OtisElevatorCo.

LightingWay Counselling Offers Affordable Therapy Amid Rising Job Market Uncertainty in Singapore

SINGAPORE, Dec. 17, 2025 /PRNewswire/ — Recent employment data reveals heightened job market pressures affecting mental health needs. In light of these circumstances, LightingWay Counselling & Therapy continues to provide affordable therapy services to help Singaporeans cope better with a complex, evolving job market.


Singaporeans Continue to Face Job Market Challenges Going into 2026

As artificial intelligence (AI) continues to reshape job markets and global economic uncertainty persists, new graduates are especially hard hit. The Private Education Institution Graduate Employment Survey, released by SkillsFuture Singapore in April 2024, showed that only 46.4 per cent of fresh graduates found full-time work in 2024, compared with 58.7 per cent in 2023.

This trend has persisted, with WorkforceSG’s Q3 2025 report indicating that hiring processes are slower and the share of firms expecting to hire has dropped from 44.0 per cent to 43.7 per cent, while those expecting to raise wages fell from 24.4 per cent to 22.4 per cent.

Stella Ong, therapist and founder of LightingWay Counselling & Therapy, stresses that “In times of economic uncertainty, more people do opt for free mental healthcare resources, namely government ones, as those are subsidised or free.” The link between financial stress and mental health is supported by a 2022 survey by TODAY that highlighted that the cost of living was the most significant contributing factor to mental health issues in Singapore at 52%, followed by work-related stress at 49 per cent.

However, free or subsidised mental health resources tend to have longer waiting times and limited flexibility, with the median waiting time for appointments at the Institute of Mental Health being 25 days across all channels of referral. For those requiring more immediate support or flexible scheduling to accommodate job searches and interviews, private practice options like LightingWay can offer accessible alternatives.

LightingWay: Providing Affordable and Flexible Mental Health Support for Singaporeans from All Walks of Life

LightingWay Counselling & Therapy offers online therapy and in-person therapy services in Singapore for adults aged 18 and above. The practice also provides same-day urgent appointments to accommodate immediate mental health needs.

Ong, who holds a Master of Arts (Counselling & Guidance) from Nanyang Technological University and is currently a Doctor of Psychology (PsyD) Candidate at California Southern University, provides support for young professionals and fresh graduates navigating career uncertainty, anxiety, depression, work-related stress, and burnout.

Her practice uses evidence-based modalities including Cognitive Behavioural Therapy (CBT), Acceptance & Commitment Therapy (ACT), and Choice Theory Reality Therapy (CTRT).

CBT, considered the gold standard for the treatment of anxiety disorders, helps individuals identify and challenge the negative thought patterns that often emerge during prolonged job searches. ACT complements this by teaching acceptance of uncertainty while maintaining values-based action—an approach proven effective for anxiety and depression. CTRT focuses on what individuals can control, such as their actions and responses, rather than external factors like the job market, which has been associated with improved self-esteem and happiness.

By integrating different therapeutic approaches, Ong provides dynamic support tailored to different situations, individual needs, and changing circumstances to ensure a truly inclusive practice for her clients.

About Lightingway Counselling & Therapy

We are inclusive and welcoming of people from all walks of life, regardless of age, gender, religion or race.

Facebook: https://www.facebook.com/people/LightingWay-Counselling-Therapy/61556217249028/
Instagram: https://www.instagram.com/lightingwaytherapysg/
Tiktok: https://www.tiktok.com/@lightingwaytherapysg

111, Inc. Announces Third Quarter 2025 Unaudited Financial Results

  • Transition from An Asset-Heavy Business Model to An Asset-Light Business Model
  • Achieved Quarterly Non-GAAP Net Profitability
  • Maintained Non-GAAP Operational Profitability for Three Consecutive Quarters
  • Achieved Quarterly Positive Operating Cash Flow

SHANGHAI, Dec. 17, 2025 /PRNewswire/ — 111, Inc. (“111” or the “Company”) (NASDAQ: YI), a leading tech-enabled healthcare platform company committed to reshaping the value chain of healthcare industry by digitally empowering the upstream and downstream in China, today announced its unaudited financial results for the third quarter ended September 30, 2025.

Third Quarter 2025 Highlights

  • Total operating expenses were RMB180.3 million (US$25.3 million), representing a decrease of 13.4% compared to RMB208.2 million in the same quarter of last year.
  • Non-GAAP income from operations (1) was RMB0.2 million (US$0.03 million), compared to RMB7.1 million in the same quarter of last year. As a percentage of net revenues, non-GAAP income from operations accounted for 0.01% this quarter as compared to 0.2% in the same quarter of last year.
  • Non-GAAP net income (2) was RMB1.1 million (US$0.2 million), compared to RMB1.3 million in the same quarter of last year. As a percentage of net revenues, non-GAAP net income accounted for 0.04% this quarter, consistent with the same quarter last year.
  • Net cash from operating activities was RMB38.1 million (US$5.4 million). The Company also generated positive operating cash flow of RMB89.3 million (US$12.5 million) on a year-to-date basis.

(1) Non-GAAP income from operations represents income from operations excluding share-based compensation expenses.
(2) Non-GAAP net income represents net income excluding share-based compensation expenses, net of tax. Considering the impact of accretion of redeemable non-controlling interest for the third quarter 2025, non-GAAP net income is used as a meaningful measurement of the operation performance of the Company.

Mr. Junling Liu, Co-Founder, Chairman, and Chief Executive Officer of 111, commented, “In the third quarter of 2025, we once again demonstrated resilience despite a challenging macroeconomic landscape. I am pleased to report that we have achieved non-GAAP operational profitability for the third consecutive quarter and generated positive operating cash flow both in the quarter and on a year-to-date basis.”

“We are decisively executing a strategic shift towards an asset-light business model. During and subsequent to the quarter, we completed the divestiture of three self-operated subsidiaries. Crucially, this represents a change in ownership structure, not a reduction in service capability. These facilities have now joined our ecosystem as fulfillment partners and will be dedicated to service our customers exclusively. While this structural optimization may create a temporary headwind for our top-line revenue, it meaningfully strengthens our liquidity and profitability. It allows us to maintain a robust logistics network without the associated capital burden, accelerating our transition from an asset-heavy model to a high-margin, technology-enabled service model.”

“Our strategic initiatives are delivering strong results. We have made substantial progress in enhancing our supply chain capabilities through the ongoing “MANTIANXING” initiative. The nationwide network of fulfillment centers continues to grow. As of the end of the quarter, the initiative has generated inventory value of RMB498 million, driving growth of 20.5% in GMV and 31.0% in customer count compared to Q2. In optimizing our supply chain, we have systematically enhanced overall competitiveness through initiatives such as traceability code scanning, relay picking by warehouse personnel, and optimal carrier matching. These measures have significantly improved operational efficiency, reduced total fulfillment costs, and provided a solid, reliable foundation for our business growth.”

“Looking ahead, our vision is to build the industry’s AI-powered transaction platform for pharmaceutical procurement. We are actively leveraging AI capabilities to create a unified, intelligent platform that optimizes decision-making for pharmacies and maximizes reach for suppliers. By aggregating industry information and streamlining transactions on a single interface, we are committed to providing a superior customer experience which will unlock long-term value for our shareholders.”

Third Quarter 2025 Financial Results

Net revenues were RMB3.0 billion (US$421.5 million), representing a decrease of 16.7% from RMB3.6 billion in the same quarter of last year.

Gross segment profit (3) was RMB178.0 million (US$25.0 million), representing a decrease of 15.5% from RMB210.6 million in the same quarter of last year.

(In thousands RMB)

For the three months ended

September 30,

2024

2025

YoY

B2B Net Revenue

Product

3,514,298

2,925,641

-16.8 %

Service

21,731

14,245

-34.4 %

Sub-Total

3,536,029

2,939,886

-16.9 %

Cost of Products Sold (4)

3,340,998

2,773,020

-17.0 %

Segment Profit

195,031

166,866

-14.4 %

Segment Profit %

5.5 %

5.7 %

(In thousands RMB)

For the three months ended

September 30,

2024

2025

YoY

B2C Net Revenue

Product

61,031

58,294

-4.5 %

Service

3,615

2,640

-27.0 %

Sub-Total

64,646

60,934

-5.7 %

Cost of Products Sold

49,061

49,765

1.4 %

Segment Profit

15,585

11,169

-28.3 %

Segment Profit %

24.1 %

18.3 %


(3) Gross segment profit represents net revenues less cost of goods sold.
(4) For segment reporting purposes, purchase rebates are allocated to the B2B segment and B2C segments primarily based on the amount of cost of products sold for each segment. Cost of products sold does not include other direct costs related to cost of product sales such as shipping and handling expense, payroll and benefits of logistic staff, logistic centers rental expenses and depreciation expenses, which are recorded in the fulfillment expenses. Cost of service revenue is recorded in the operating expense.

Operating costs and expenses were RMB3.0 billion (US$421.8 million), representing a decrease of 16.5% from RMB3.6 billion in the same quarter of last year, broadly in line with the decline in net revenues.

  • Cost of products sold was RMB2.8 billion (US$396.5 million), representing a decrease of 16.7% from RMB3.4 billion in the same quarter of last year.
  • Fulfillment expenses were RMB87.4 million (US$12.3 million), representing a decrease of 12.6% from RMB100.0 million in the same quarter of last year. Fulfillment expenses accounted for 2.9% of net revenues this quarter as compared to 2.8% in the same quarter of last year.
  • Selling and marketing expenses were RMB61.8 million (US$8.7 million), representing a decrease of 19.7% from RMB77.0 million in the same quarter of last year. Excluding the share-based compensation expenses of RMB0.8 million for the quarter and RMB1.6 million for the same quarter last year, selling and marketing expenses accounted for 2.0% of net revenues this quarter as compared to 2.1% in the same quarter of last year.
  • General and administrative expenses were RMB15.7 million (US$2.2 million), representing an increase of 9.2% from RMB14.4 million in the same quarter of last year. Excluding the share-based compensation expenses of RMB1.5 million for the quarter and RMB2.3 million for the same quarter last year, respectively, general and administrative expenses as a percentage of net revenues accounted for 0.5% this quarter as compared to 0.3% in the same quarter of last year.
  • Technology expenses were RMB15.3 million (US$2.1 million), representing a decrease of 12.8% from RMB17.5 million in the same quarter of last year. Excluding the share-based compensation expenses of RMB0.2 million for the quarter and RMB0.9 million for the same quarter last year, respectively, technology expenses as a percentage of net revenues accounted for 0.5% this quarter, maintaining the same as last year.

Loss from operations was RMB2.3 million (US$0.3 million), compared to income from operations of RMB2.4 million in the same quarter of last year.

Non-GAAP income from operations was RMB0.2 million (US$0.03 million), compared to RMB7.1 million in the same quarter of last year. As a percentage of net revenues, non-GAAP income from operations accounted for 0.01% this quarter as compared to 0.2% in the same quarter of last year.

Net loss was RMB1.5 million (US$0.2 million), representing an improvement of 58.0% from RMB3.5 million in the same quarter of last year.

Non-GAAP net income was RMB1.1 million (US$0.2 million), compared to RMB1.3 million in the same quarter of last year. As a percentage of net revenues, non-GAAP net income accounted for 0.04% this quarter, consistent with the same quarter last year.

Net loss attributable to ordinary shareholders was RMB13.0 million (US$1.8 million), compared to RMB17.1 million in the same quarter of last year. As a percentage of net revenues, net loss attributable to ordinary shareholders accounted for 0.4% this quarter as compared to 0.5% in the same quarter of last year.

Non-GAAP net loss attributable to ordinary shareholders (5) was RMB10.5 million (US$1.5 million), compared to RMB12.4 million in the same quarter of last year. As a percentage of net revenues, non-GAAP net loss attributable to ordinary shareholders accounted for 0.3% of net revenues this quarter, consistent with the same period last year.

(5) Non-GAAP net loss attributable to ordinary shareholders represents net loss attributable to ordinary shareholders excluding share-based compensation expenses, net of tax.

As of September 30, 2025, the Company held cash and cash equivalents, restricted cash and short-term investments totaling RMB557.5 million (US$78.3 million), compared to RMB518.3 million as of December 31, 2024. To date, amount of RMB1.1 billion has been included in the balances of redeemable non-controlling interests and accrued expenses and other current liabilities. This amount is owed to a group of investors of 1 Pharmacy Technology pursuant to equity investments made in 2020, as previously disclosed. 111 has received redemption requests from certain of such investors in accordance with the terms of their initial investments in 1 Pharmacy Technology. Following communication and negotiation, the Company has reached agreements with, or received commitment letters from, all investors to reschedule the repayments, allowing for phased repayments at extended periods, if the investors exercise their redemption rights. A portion of the redemption has been paid upon signing of these agreements. For further details about such investors’ investments in 1 Pharmacy Technology, please see “Item 4. Information on the Company-A. History and Development of the Company” in the Company’s annual report for the fiscal year ended December 31, 2024.

Executing Strategic Optimization: Embraces Asset-Light Partnership Network Growth

In the third quarter of 2025 and subsequent to third quarter, the Company proactively executed a strategic structural optimization by divesting its 100% equity interests in three subsidiaries, namely Shanxi Yihao Yaofang Pharmacy Co., Ltd., Liaoning Yihao Pharmacy Co., Ltd. and Tianjin Yihao Pharmacy Co., Ltd. to several independent third-party buyers. In connection with the divestiture, these buyers continue to operate on our platform as warehouse partners, providing fulfillment services to our customers exclusively, as part of our core warehouse partnership strategy to drive asset-light, high-margin growth.

This transaction was as part of our broader strategic initiative to shift away from a capital-intensive, self-operated warehouse business model (which put pressure on our overall profitability and liquidity) toward an asset-light partnership structure. Historically, the three subsidiaries were operated as self-run facilities and incurred operating losses. In 2024, they generated a total revenue of RMB2.86 billion and a total net loss of RMB417 million and RMB407 million in net liabilities as of the divestment date. Through the divestiture of these entities and the transition of our business model to a warehouse partnership model—where we generate recurring commission income rather than assuming the operational and capital burdens—we have strengthened our ability to further improve our profitability and liquidity profile.

We believe that this transaction reinforces our focus on pursuing asset-light, profitable growth, strengthening our ability to scale the warehouse partnership network efficiently while maintaining a healthier financial structure.

Use of Non-GAAP Financial Measures

In evaluating the business, the Company considers and uses non-GAAP income from operations, non-GAAP net income (loss), non-GAAP net loss attributable to ordinary shareholders, and non-GAAP loss per ADS, as supplemental measures to review and assess its operating performance. The Company defines non-GAAP income from operations as income from operations excluding share-based compensation expenses. The Company defines non-GAAP net income (loss) as net loss excluding share-based compensation expenses, net of tax. The Company defines non-GAAP net loss attributable to ordinary shareholders as net loss attributable to ordinary shareholders excluding share-based compensation expenses, net of tax. The Company defines non-GAAP loss per ADS as net loss attributable to ordinary shareholders per ADS excluding share-based compensation expenses, net of tax per ADS. The presentation of these non-GAAP financial measures is not intended to be considered in isolation or as a substitute for the financial information prepared and presented in accordance with U.S. GAAP.

The Company believes that non-GAAP income from operations, non-GAAP net income (loss), non-GAAP net loss attributable to ordinary shareholders, and non-GAAP loss per ADS help identify underlying trends in its business that could otherwise be distorted by the effect of certain expenses that it includes in income from operations and net loss. Share-based compensation expenses is a non-cash expense that varies from period to period. As a result, management excludes the items from its internal operating forecasts and models. Management believes that the adjustments for share-based compensation expenses provide investors with a reasonable basis to measure the company’s core operating performance, in a more meaningful comparison with the performance of other companies. The Company believes that non-GAAP income from operations, non-GAAP net income (loss), non-GAAP net loss attributable to ordinary shareholders, and non-GAAP loss per ADS provide useful information about its operating results, enhances the overall understanding of its past performance and future prospects and allow for greater visibility with respect to key metrics used by the management in their financial and operational decision-making.

The non-GAAP financial measures are not defined under U.S. GAAP and are not presented in accordance with U.S. GAAP. The non-GAAP financial measures have limitations as analytical tools. One of the key limitations of using non-GAAP income from operations, non-GAAP net income (loss), non-GAAP net loss attributable to ordinary shareholders, or non-GAAP loss per ADS is that it does not reflect all items of income and expense that affect the Company’s operations. Further, the non-GAAP financial measures may differ from the non-GAAP information used by other companies, including peer companies, and therefore their comparability may be limited.

The Company compensates for these limitations by reconciling the non-GAAP financial measures to the most comparable U.S. GAAP measures, all of which should be considered when evaluating the Company’s performance. The Company encourages you to review its financial information in its entirety and not rely on a single financial measure.

Reconciliation of the non-GAAP financial measures to the most comparable U.S. GAAP measures is included at the end of this press release.

Exchange Rate Information Statement

This announcement contains translations of certain RMB amounts into U.S. dollars at specified rates solely for the convenience of the reader. Unless otherwise noted, all translations from RMB to U.S. dollars are made at a rate of RMB7.1190 to US$1.00, the exchange rate set forth in the H.10 statistical release of the Board of Governors of the Federal Reserve System as of September 30, 2025.

Forward-Looking Statements

This press release contains forward-looking statements. These statements constitute “forward-looking” statements within the meaning of Section 21E of the Securities Exchange Act of 1934, as amended, and as defined in the U.S. Private Securities Litigation Reform Act of 1995. These forward-looking statements can be identified by terminology such as “will,” “expects,” “anticipates,” “future,” “intends,” “plans,” “believes,” “estimates,” “target,” “confident” and similar statements. Among other things, the Business Outlook and quotations from management in this announcement, as well as 111’s strategic and operational plans, contain forward-looking statements. 111 may also make written or oral forward-looking statements in its periodic reports to the U.S. Securities and Exchange Commission, in its annual report to shareholders, in press releases and other written materials and in oral statements made by its officers, directors or employees to third parties. Such statements are based upon management’s current expectations and current market and operating conditions and relate to events that involve known or unknown risks, uncertainties and other factors, all of which are difficult to predict and many of which are beyond the Company’s control. Forward-looking statements involve inherent risks, uncertainties and other factors that could cause actual results to differ materially from those contained in any such statements. Potential risks and uncertainties include, but are not limited to, uncertainties as to the Company’s ability comply with extensive and evolving regulatory requirements, its ability to compete effectively in the evolving PRC general health and wellness market, its ability to manage the growth of its business and expansion plans, its ability to achieve or maintain profitability in the future, its ability to control the risks associated with its pharmaceutical retail and wholesale businesses, and the Company’s ability to meet the standards necessary to maintain listing of its ADSs on the Nasdaq Global Market, including its ability to cure any non-compliance with Nasdaq’s continued listing criteria. Further information regarding these and other risks, uncertainties or factors is included in the Company’s filings with the U.S. Securities and Exchange Commission. All information provided in this press release is as of the date of this press release, and 111 does not undertake any obligation to update any forward-looking statement as a result of new information, future events or otherwise, except as required under applicable law.

About 111, Inc.

111, Inc. (NASDAQ: YI) (“111” or the “Company”) is a leading tech-enabled healthcare platform company committed to reshaping the value chain of healthcare industry by digitally empowering the upstream and downstream in China. The Company provides consumers with better access to pharmaceutical products and healthcare services directly through its online retail pharmacy, 1 Pharmacy, and indirectly through its offline virtual pharmacy network. The Company also offers online healthcare services through its internet hospital, 1 Clinic, which provides consumers with cost-effective and convenient online consultation, electronic prescription service, and patient management service. In addition, the Company’s online platform, 1 Medicine, serves as a one-stop shop for pharmacies to source a vast selection of pharmaceutical products. With the largest virtual pharmacy network in China, 111 enables offline pharmacies to better serve their customers with cloud-based services. 111 also provides an omni-channel drug commercialization platform to its strategic partners, which includes services such as digital marketing, patient education, data analytics, and pricing monitoring.

For more information on 111, please visit: http://ir.111.com.cn/.

For more information, please contact:

111, Inc.
Investor Relations
Email: ir@111.com.cn 

111, Inc.
Media Relations
Email: press@111.com.cn
Phone: +86-021-2053 6666 (China) 


111, Inc.

UNAUDITED CONDENSED CONSOLIDATED BALANCE SHEETS

(In thousands, except for share and per share data)

As of

As of

December 31, 2024

September 30, 2025

RMB

RMB

US$

ASSETS

Current assets:

Cash and cash equivalents

462,289

463,615

65,124

Restricted cash

56,043

63,934

8,981

Short-term investments

–

30,000

4,214

Accounts receivable, net 

413,101

281,549

39,549

Notes receivable

78,827

76,786

10,786

Inventories

1,387,403

1,253,988

176,147

Prepayments and other current assets

251,994

218,534

30,697

Total current assets

2,649,657

2,388,406

335,498

Property and equipment, net

32,903

23,630

3,319

Intangible assets, net

1,437

1,022

144

Long-term investments

–

–

–

Other non-current assets

14,682

11,537

1,621

Operating lease right-of-use assets

89,071

57,788

8,117

Total assets

2,787,750

2,482,383

348,699

LIABILITIES, MEZZANINE EQUITY AND SHAREHOLDERS’ DEFICIT

Current liabilities:

Short-term borrowings

160,981

170,000

23,880

Accounts payable

1,721,425

1,550,309

217,771

Accrued expense and other current liabilities 

460,173

506,350

71,127

Total current liabilities

2,342,579

2,226,659

312,778

Long-term operating lease liabilities

55,448

34,730

4,878

Other non-current liabilities

8,961

2,181

306

Total liabilities

2,406,988

2,263,570

317,962

MEZZANINE EQUITY

Redeemable non-controlling interests

1,038,914

923,141

129,673

SHAREHOLDERS’ DEFICIT

Ordinary shares Class A 

33

34

5

Ordinary shares Class B 

25

25

3

Treasury shares 

(5,887)

(5,887)

(827)

Additional paid-in capital

3,172,820

3,183,053

447,121

Accumulated deficit

(3,883,992)

(3,934,163)

(552,629)

Accumulated other comprehensive income

74,357

73,045

10,261

Total shareholders’ deficit

(642,644)

(683,893)

(96,066)

Non-controlling interest

(15,508)

(20,435)

(2,870)

Total deficit

(658,152)

(704,328)

(98,936)

Total liabilities, mezzanine equity and deficit

2,787,750

2,482,383

348,699


111, Inc.

UNAUDITED CONDENSED CONSOLIDATED STATEMENTS OF COMPREHENSIVE LOSS

 (In thousands, except for share and per share data)

For the three months ended September 30,

For the nine months ended September 30,

2024

2025

2024

2025

RMB

RMB

US$

RMB

RMB

US$

Net revenues

3,600,675

3,000,820

421,523

10,553,474

9,735,859

1,367,588

Operating costs and expenses:

 Cost of products sold

(3,390,059)

(2,822,785)

(396,514)

(9,926,727)

(9,177,349)

(1,289,135)

 Fulfillment expenses

(99,977)

(87,396)

(12,276)

(276,559)

(271,164)

(38,090)

 Selling and marketing expenses

(76,954)

(61,827)

(8,685)

(237,724)

(195,897)

(27,517)

 General and administrative expenses

(14,367)

(15,685)

(2,203)

(50,747)

(51,428)

(7,224)

 Technology expenses

(17,549)

(15,294)

(2,148)

(54,225)

(45,622)

(6,408)

 Other operating income (expenses), net

602

(129)

(18)

1,941

3,545

498

Total Operating costs and expenses

(3,598,304)

(3,003,116)

(421,844)

(10,544,041)

(9,737,915)

(1,367,876)

Income (Loss) from operations

2,371

(2,296)

(321)

9,433

(2,056)

(288)

 Interest income

1,533

682

96

5,574

2,953

415

 Interest expense

(7,810)

(7,053)

(991)

(23,067)

(24,243)

(3,405)

 Foreign exchange gain (loss)

642

181

25

40

290

41

 Other (loss) income, net

(193)

7,032

988

(116)

7,043

989

Loss before income taxes

(3,457)

(1,454)

(203)

(8,136)

(16,013)

(2,248)

 Income tax expense

(5)

–

–

(93)

(13)

(2)

Net loss

(3,462)

(1,454)

(203)

(8,229)

(16,026)

(2,250)

Net loss (income) attributable to non-controlling interest

848

2,192

308

(431)

3,885

546

Net loss (income) attributable to redeemable non-controlling interest

438

(100)

(14)

1,168

790

111

Adjustment attributable to redeemable non-controlling interest

(14,931)

(13,611)

(1,912)

(37,410)

(38,820)

(5,453)

Net loss attributable to ordinary shareholders

(17,107)

(12,973)

(1,821)

(44,902)

(50,171)

(7,046)

Other comprehensive loss

 Unrealized gains of available-for-sale securities,

(407)

–

–

(753)

–

–

 Realized gains of available-for-sale debt securities

407

–

–

896

–

–

 Foreign currency translation adjustments

(1,184)

(377)

(53)

(55)

(1,312)

(184)

Comprehensive loss

(18,291)

(13,350)

(1,874)

(44,814)

(51,483)

(7,230)

Loss per ADS:

 Basic and diluted

(2.00)

(1.40)

(0.20)

(5.20)

(5.80)

(0.80)

Weighted average number of shares used in computation of loss per share

 Basic and diluted

171,938,537

174,218,134

174,218,134

171,526,062

173,639,805

173,639,805


111, Inc.

UNAUDITED CONDENSED CONSOLIDATED STATEMENTS OF CASH FLOWS

(In thousands)

For the three months ended

September 30,

For the nine months ended

September 30,

2024

2025

2024

2025

RMB

RMB

US$

RMB

RMB

US$

Net cash provided by operating activities

109,865

38,082

5,351

311,563

89,271

12,538

Net cash provided by (used in) investing activities

49,845

(29,974)

(4,211)

(141)

(31,285)

(4,394)

Net cash (used in) provided by financing activities

(110,510)

6,553

920

(370,453)

(47,755)

(6,707)

Effect of exchange rate changes on cash and cash equivalents, and

restricted cash

(313)

(210)

(29)

(106)

(1,014)

(142)

Net increase (decrease) in cash and cash equivalents, and restricted cash

48,887

14,451

2,031

(59,137)

9,217

1,295

Cash and cash equivalents, and restricted cash at the beginning of the

period

515,524

513,098

72,074

623,548

518,332

72,810

Cash and cash equivalents, and restricted cash at the end of the period

564,411

527,549

74,105

564,411

527,549

74,105


 111, Inc.

Unaudited Reconciliation of GAAP and Non-GAAP Results

 (In thousands, except for share and per share data)

For the three months ended

September 30,

For the nine months ended

September 30,

2024

2025

2024

2025

RMB

RMB

US$

RMB

RMB

US$

Income (Loss) from operations

2,371

(2,296)

(321)

9,433

(2,056)

(288)

Add: Share-based compensation expenses

4,756

2,521

354

15,122

9,503

1,335

Non-GAAP income from operations

7,127

225

33

24,555

7,447

1,047

Net loss

(3,462)

(1,454)

(203)

(8,229)

(16,026)

(2,250)

Add: Share-based compensation expenses, net of tax

4,756

2,521

354

15,122

9,503

1,335

Non-GAAP net income (loss)

1,294

1,067

151

6,893

(6,523)

(915)

Net loss attributable to ordinary shareholders

(17,107)

(12,973)

(1,821)

(44,902)

(50,171)

(7,046)

Add: Share-based compensation expenses, net of tax

4,756

2,521

354

15,122

9,503

1,335

Non-GAAP net loss attributable to ordinary shareholders

(12,351)

(10,452)

(1,467)

(29,780)

(40,668)

(5,711)

Loss per ADS(6): Basic and diluted

(2.00)

(1.40)

(0.20)

(5.20)

(5.80)

(0.80)

Add: Share-based compensation expenses per ADS(6), net of tax

0.60

0.20

0.00

1.80

1.00

0.20

Non-GAAP loss per ADS(6)

(1.40)

(1.20)

(0.20)

(3.40)

(4.80)

(0.60)

(6) Every one ADS represents twenty Class A ordinary shares.