Home Blog Page 17

News Lounge Comes to Türkiye, Fostering Dialogue Across Borders


ANTALYA, TURKEY – Media OutReach Newswire – 14 November 2026 – News Lounge, the flagship program of China News Service, welcomed its first group of international guests since its overseas debut in Türkiye on Tuesday on the sidelines of COP31 in Antalya.

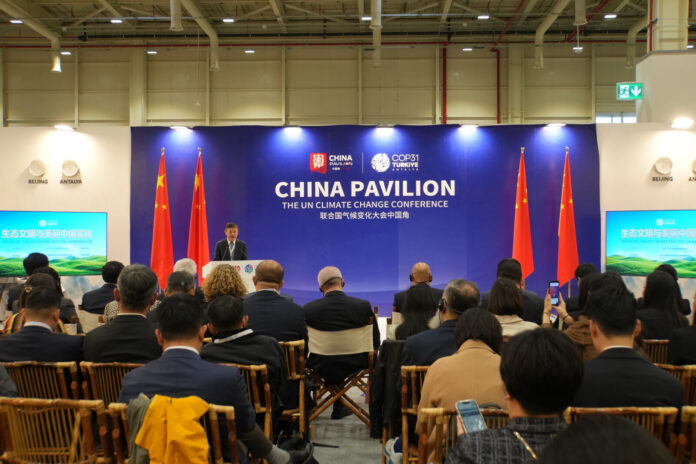
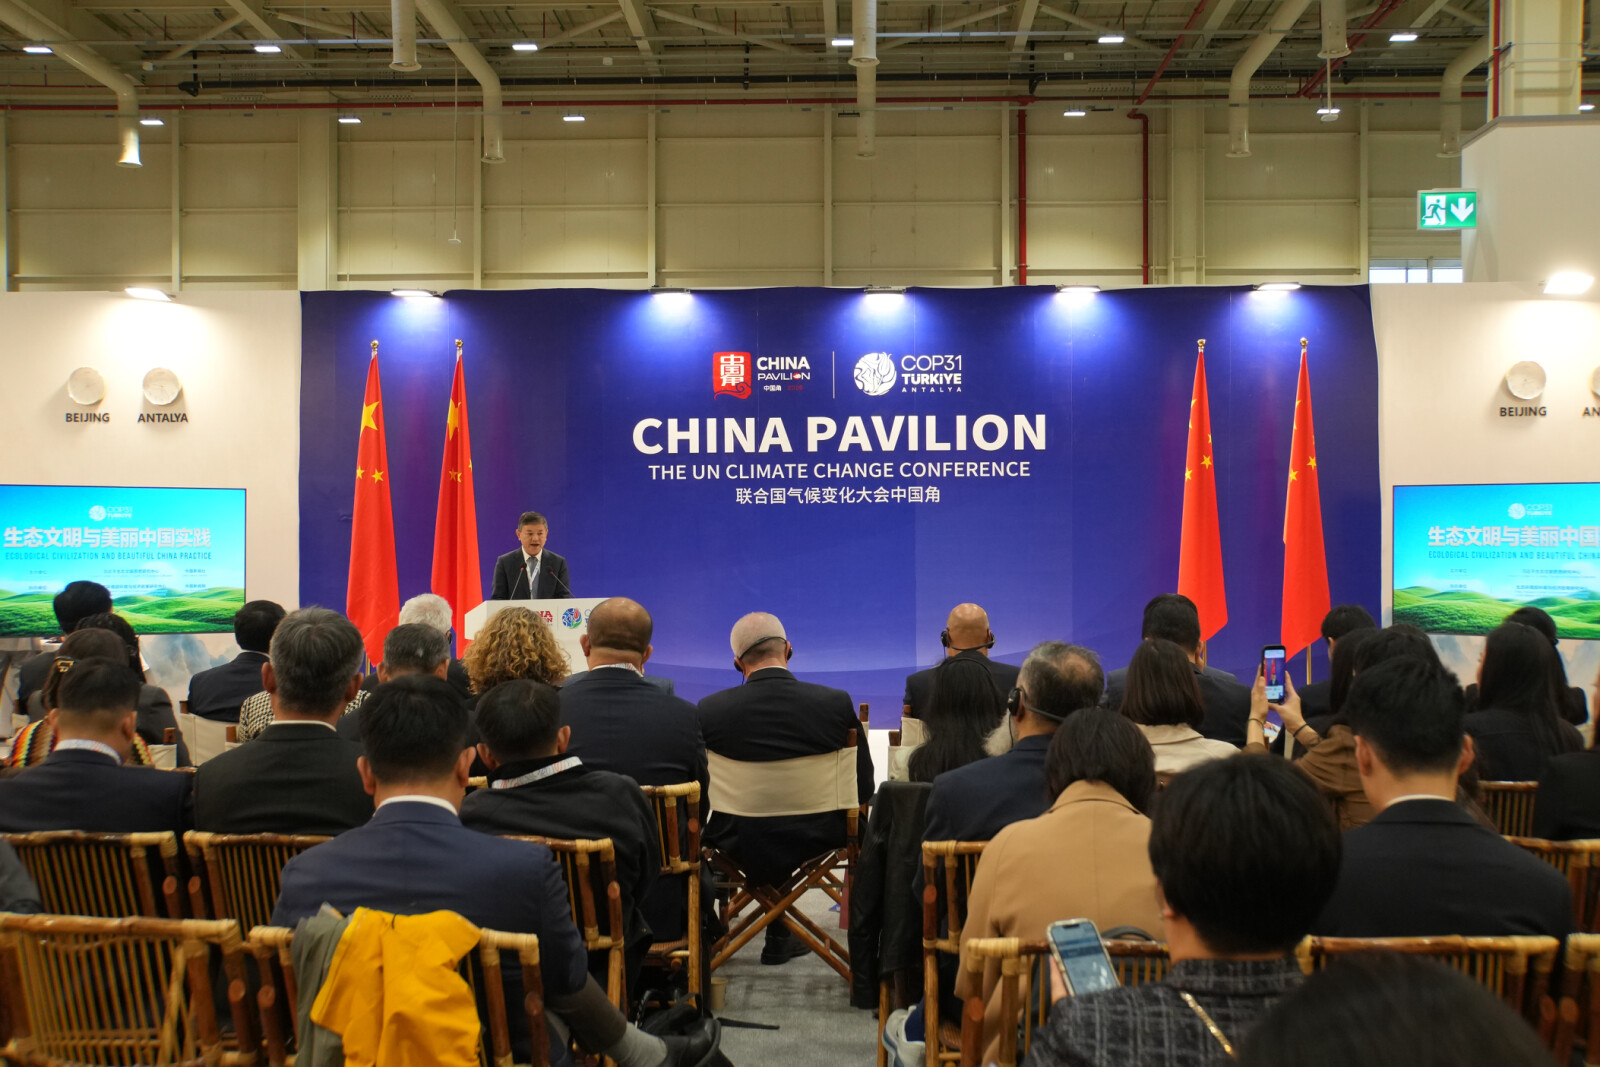
The side event Ecological Civilization and Beautiful China Practice is held at the China Pavilion on Nov.10, 2026, in Antalya, Türkiye, on the sidelines of the 31st Conference of the Parties to the UN Framework Convention on Climate Change (COP31). (Photo: Wang Qingkai, Xu Junjie)

Themed Ecological Civilization and Beautiful China Practice and held at China Pavilion, the side event was jointly hosted by the Research Center for Xi Jinping Thought on Ecological Civilization and China News Service, with the Policy Research Center for Environment and Economy of the Ministry of Ecology and Environment and China News Network serving as co-organizers.

At the event, Huang Runqiu, minister of the Ministry of Ecology and Environment of China, delivered remarks. Li Gao, head of the Chinese Delegation to COP31, vice minister of the Ministry of Ecology and Environment of China, presided over the speech session. Hu Jun, director general of Research Center for Xi Jinping Thought on Ecological Civilization and Policy Research Center for Environment and Economy of the Ministry of Ecology and Environment, and Yu Lan, deputy editor-in-chief of China News Service and president of China News Network, attended the event.

The international guests included Simon Stiell, executive secretary of the United Nations Framework Convention on Climate Change; Chris Bowen, COP31 President of Negotiations, Australian Minister for Climate Change and Energy; and Fatih Birol, executive director of the International Energy Agency.

Drawing on their professional expertise, the international guests shared perspectives on global climate governance and discussed opportunities stemming from China’s green transition.

The scene was marked by dynamic exchanges across borders and disciplines. Participants agreed that global climate governance requires multilateral cooperation, and China’s ongoing ecological and energy transition offers actionable lessons for the world.

China’s contribution to global climate governance

Simon Stiell, executive secretary of the UNFCCC, spoke highly of China’s practical green transition efforts, saying China’s energy transition achievements are “like nowhere else on Earth.”

Stiell said China has long been a firm friend of multilateralism and consistently engaged across the UN’s broader agenda, notably UN Climate Change work, giving strong impetus to the steady advancement of global climate governance.

He observed that “China’s South-South cooperation has also supported the transition to clean energy and climate resilience in many developing countries.” China’s domestic energy transition has also spurred innovation and driven lower costs across the globe.

He singled out China’s commitment to strive for enhanced outcomes beyond its updated nationally determined contribution (NDC). To him, this shows great wisdom and foresight.

Stewart Maginnis, deputy director-general of the International Union for Conservation of Nature, shared his views on China’s efforts to build an ecological civilization. From his observations, what truly impressed him about China’s ecological civilization is not merely a green agenda, but a strategic choice and a fundamental asset of coexistence.

“People can prosper without undermining the ecosystems that sustain them,” Maginnis said, adding that environmental protection and economic development need not compete in China.

Maginnis also praised China’s efforts in carrying out pioneering ecological work. China’s ecological restoration work covers not only forests, but also rivers and wetlands. It goes beyond tree planting to removing pressures that prevent ecosystems from effectively functioning, he said.

Economic opportunities in green and low-carbon development

Fatih Birol, executive director of the International Energy Agency (IEA) took notice of the trend of electrification and said it is expanding to more areas in the world. He spoke highly of China’s pioneering efforts in energy transition, noting that China has achieved remarkable progress in electric vehicles, renewable energy and battery storage, and boasts competitive industrial chains covering hydropower, solar, wind power, energy storage and clean fuels.

During his visit to China in September 2026, he held discussions with relevant Chinese authorities and visited Tsinghua University. He was deeply impressed by China’s vibrant innovation momentum.

“The world is entering the electric age,” Birol stated, adding that advancing electrification brings multiple benefits: it boosts economic growth and safeguards energy security, while helping tackle climate change and improve air quality. China’s role in clean energy is indisputable and it has shown the way for the world. He called on all countries to build consensus and jointly set targets for electrification.

Beneath the electrification wave, the scale and cost of renewable energy supply remain a key market focus.

Chris Bowen, president of negotiations for COP31, highly recognized China’s key role in the global renewable energy transition. He also agreed that accelerating the renewable energy transition and electrification is the way forward in the face of increasing living costs driven up by the energy crisis, fossil fuel reliance and rising power demand from artificial intelligence.

Citing the IEA’s Renewables 2025 report, he said global renewable energy capacity will expand by 4,600 gigawatts between 2025 and 2030, with China standing pivotal thanks to its scale and influence. Bowen stated that China’s sustained investment in renewables and efforts to bring down solar and battery costs “support its own deep decarbonization while delivering benefits across the globe.”

Laura Clarke, chief executive officer of ClientEarth said that China in recent years has witnessed a remarkable green transition, becoming a global leader in green technology. Meanwhile, she also pointed out that China’s ambitions for ecological civilization and Beautiful China also have major global implications.

“China is also showing the major economic opportunities in green and low-carbon sectors,” commended Clarke. Additionally, Clarke noticed that the country is increasing partnerships with other countries, which will help advance the global green transition.

A people-centered just transition

As green technologies gain industrial momentum, their impacts on people’s daily lives and human health also merit attention.

Barbara Vrede, global head of Social Impact and Sustainability Strategy, Novartis, said human health and planetary health are closely linked. China is a key country where Novartis translates its global sustainability ambitions into local action.

Vrede highlighted Novartis’ Sichuan Forestry Carbon Sink, Community and Biodiversity Project, launched in 2010. The project has established nearly 4,000 hectares of forest and planted approximately 21 million trees, benefiting more than 4,200 households and over 18,000 residents while generating approximately 40 million yuan in labor income for local communities. “This experience has shown us that environmental action can create ecological, social and economic value,” Vrede said.

She expressed Novartis’ willingness to deepen cooperation with partners in China on ecological restoration, biodiversity protection and sustainable community development, contributing to a healthier and more sustainable future for people and the planet.

Yamide Dagnet, senior vice president, international, at the Natural Resources Defense Council (NRDC), described COP31 as an “implementation and transition COP,” emphasizing the need to translate climate commitments into concrete action. She stressed that climate action must put people at the center, improve lives, create opportunities and bring local communities along in the green transition.

Dagnet said the concept of a just transition aligns with the essence of China’s ecological civilization. Renewable energy can not only support the energy transition but also drive economic growth and shared prosperity.

She expressed hope that China’s green transition experience could offer useful insights to other countries through South-South cooperation, South-North cooperation and international exchanges, helping turn transition challenges into opportunities for shared prosperity and sustainable development.

Centered on climate issues, the dialogue leveraged international guests’ on-the-ground observations and first-hand accounts, translating China’s ecological progress into resonant narratives for a global audience.

Leveraging this event, News Lounge extended its reach to a major multilateral platform, marking a meaningful breakthrough in its international outreach.

Hashtag: #NewsLounge


The issuer is solely responsible for the content of this announcement.

Zai Lab Announces First-Time Inclusion of KarXT and VYVGART Hytrulo® in China’s 2026 National Reimbursement Drug List, Expanding Access to Key Growth Products

SHANGHAI and CAMBRIDGE, Mass, Nov. 14, 2026 /PRNewswire/ — Zai Lab Limited (NASDAQ: ZLAB; HKEX: 9688), an innovation-driven, global biopharma company, today announced that five of its commercial medicines in China have been included in the country’s 2026 National Reimbursement Drug List (NRDL). The update includes two first-time listings, expanding patient access to treatments for gMG and schizophrenia, and three renewals, which maintain access across oncology and infectious disease.

Zai Lab Products Newly Added or Renewed in 2026 NRDL:

First-time listings:

  • VYVGART Hytrulo® (efgartigimod alfa, subcutaneous injection): for the treatment of adult patients with anti-acetylcholine receptor (AChR) antibody-positive generalized myasthenia gravis (gMG).
  • KarXT (xanomeline and trospium chloride capsules): for the treatment of schizophrenia in adults.

Renewals:

  • NUZYRA® (omadacycline for injection): for the treatment of community-acquired bacterial pneumonia and acute bacterial skin and skin structure infections.
  • QINLOCK® (ripretinib tablets): for the treatment of adult patients with advanced gastrointestinal stromal tumor (GIST) who have received prior treatment with three or more kinase inhibitors, including imatinib.
  • AUGTYRO® (repotrectinib capsules): for the treatment of adult patients with ROS1-positive locally advanced or metastatic non-small cell lung cancer (NSCLC), and adult patients with solid tumors harboring a neurotrophic tyrosine receptor kinase (NTRK) gene fusion.

“The inclusion of KarXT and VYVGART Hytrulo in the NRDL represents an important milestone for Zai Lab and the patients we serve,” said Dr. Yizhe Wang, Zai Lab Operating Partner. “These listings will help broaden access to two important therapies, including KarXT’s novel mechanism of action for schizophrenia and the convenience of VYVGART Hytrulo’s subcutaneous administration for patients with gMG. Together with the renewal of our other listed products, we are grateful to the National Healthcare Security Administration for its continued support of innovative medicines and remain committed to delivering greater benefit to patients.”

The 2026 National Reimbursement Drug List will take effect on January 1, 2027.

Notice:

*xanomeline and trospium chloride capsules included in the 2026 NRDL covers the following specifications: (I) xanomeline tartrate 50 mg (calculated as C14H23N3OS) and trospium chloride 20 mg per capsule; (II) xanomeline tartrate 100 mg (as C14H23N3OS) and trospium chloride 20 mg per capsule; (III) xanomeline tartrate 125 mg (as C14H23N3OS) and trospium chloride 30 mg per capsule. All are indicated for schizophrenia in adults.

*For AUGTYRO® included in the 2026 NRDL, the reimbursement scope for adult patients with NTRK gene fusion-positive solid tumors is specifically: adult patients diagnosed, by a well-validated testing method, with solid tumors harboring a neurotrophic tyrosine receptor kinase (NTRK) gene fusion, and who meet one of the following conditions: having locally advanced or metastatic disease, or for whom surgical resection is likely to result in severe complications, or who have failed prior treatment or have no satisfactory alternative treatment options.

About Zai Lab

Zai Lab Limited (NASDAQ: ZLAB; HKEX: 9688) is an innovative, research-based, commercial-stage biopharmaceutical company based in China and the United States. We are focused on discovering, developing, and commercializing innovative products that address medical conditions with significant unmet needs in the areas of oncology, immunology, neuroscience, and infectious disease. Our goal is to leverage our competencies and resources to positively impact human health.

For additional information about Zai Lab, please visit www.zailaboratory.com or follow us at www.linkedin.com/company/zai-lab or https://x.com/ZaiLab_Global.

Zai Lab Forward-Looking Statements

This press release contains forward-looking statements about our future expectations, plans, and prospects for Zai Lab, including, without limitation, statements relating to the benefits and potential of VYVGART Hytrulo, KarXT, QINLOCK, AUGTYRO, and NUZYRA and the treatment of gMG, schizophrenia, NSCLC, certain solid tumors, and community-acquired bacterial pneumonia and acute bacterial skin and skin structure infections in China. All statements, other than statements of historical facts, included in this press release are forward-looking statements, and can be identified by terms such as “aims,” “anticipates,” “believes,” “could,” “estimates,” “expects,” “forecasts,” “goal,” “intends,” “may,” “plans,” “possible,” “potential,” “will,” “would,” and similar expressions. Such statements constitute forward-looking statements within the meaning of the Private Securities Litigation Reform Act of 1995. Forward-looking statements are neither promises nor guarantees of future performance, and are based on our expectations and assumptions as of the date of this press release, and are subject to inherent uncertainties, risks, and changes in circumstances that may cause actual results to differ materially from those anticipated. Actual results may differ materially as a result of various important factors, including but not limited to: (1) our ability to successfully commercialize and generate revenue from our approved products; (2) our ability to obtain funding for our operations and business activities; (3) the results of clinical and preclinical development of our product candidates; (4) the content and timing of decisions made by the relevant regulatory authorities regarding our product candidates; (5) risks related to doing business in China; and (6) other factors identified in our most recent annual and quarterly reports and in other reports we have filed with the U.S. Securities and Exchange Commission (SEC). We undertake no obligation to update or revise any forward-looking statements, whether as a result of new information, future events, or otherwise, except as may be required by law. For access to the company’s filings with the SEC, please visit www.zailaboratory.com and the SEC’s website at www.SEC.gov.

The NYSE Welcomes vVARDIS as a Publicly Listed Company

NEW YORK, Nov. 14, 2026 /PRNewswire/ — vVARDIS (NYSE: VVVV) co-founders Dr. Haley Abivardi and Dr. Goly Abivardi aim to reshape the future of dental care with a drill-free treatment for the world’s #1 non-communicable disease: cavities.


The NYSE welcomes vVARDIS as a publicly listed company! vVARDIS co-founders Dr. Haley Abivardi and Dr. Goly Abivardi aim to reshape the future of dental care with a drill-free treatment for the world’s #1 non-communicable disease: cavities.

  • vVARDIS Solves a Problem that Millions Face
    • Tooth decay affects billions of people worldwide, and dental anxiety keeps millions from getting the care they need.
    • vVARDIS is a Swiss dental technology company focused on changing the way early tooth decay is treated.
    • vVARDIS has introduced a new approach that aims to treat decay earlier and more comfortably for patients.
    • Its flagship product, Curodont® Repair Fluoride Plus, uses proprietary peptide technology to help repair early-stage tooth decay by supporting the natural remineralization of enamel — simply put No drill, No needle, or No filling.
  • Tooth Decay is One of the Most Common Health Issues in the World
    • 2.5 billion people globally live with untreated tooth decay.
    • Nearly 90% of U.S. adults have experienced tooth decay.
    • Nearly 73% of U.S. adults report dental fear.
    • 21% avoid the dentist because of anxiety.
  • The Story that Helped Shape vVARDIS
    • For decades, treating early tooth decay often meant waiting until it worsened or getting a filling. 
    • The founders spent 25 years developing Curodont® Repair Fluoride Plus, a treatment that helps repair early tooth decay before it becomes a cavity.
    • Curodont® gives dentists a way to treat early decay while making the experience easier and less intimidating for patients.
      • The technology has already treated more than 2.5 million teeth
      • Available in more than 20% of U.S. dental practices

Click Here to Learn More about vVARDIS: https://www.youtube.com/watch?v=T1p9hUR5Glk

The NYSE celebrates vVardis (NYSE: VVVV) IPO

Innovative Immunology Biotech Windward Bio Lists on Nasdaq

SHANGHAI, Nov. 14, 2026 /PRNewswire/ — Windward Bio, a portfolio company of Qiming Venture Partners and a clinical-stage biotechnology company, successfully listed on Nasdaq on November 13, 2026. Windward Bio (Nasdaq: WWB) priced its IPO at $17.00 per share. Its shares closed at $28.50 on the first trading day, up 68% from the IPO price, giving the company a market capitalization of approximately $1.69 billion. This is Qiming Venture Partners’ 11th IPO in 2026.

Qiming Venture Partners invested in Windward Bio’s inaugural Series A financing in 2025 and continued to support the company in its Series B financing in 2026. Qiming also participated in this IPO financing round.

Windward Bio was founded in 2024 with a mission to transform the treatment paradigm for patients living with chronic inflammatory diseases through the development of differentiated biologic therapies targeting clinically validated disease pathways. Led by a team with extensive expertise across discovery, development, and commercialization, Windward Bio is advancing a pipeline of ultra-long-acting antibody medicines to improve clinical outcomes, reduce treatment burden and expand treatment options for patients with serious respiratory and dermatologic diseases, including asthma, chronic obstructive pulmonary disease (COPD) and atopic dermatitis.

Windward Bio’s lead program, WIN378, is a potentially novel anti-TSLP monoclonal antibody engineered for improved potency and extended half-life. WIN378 is currently being evaluated in POLARIS-1, a Phase 2/3 study in severe uncontrolled asthma, and SIRIUS, a Phase 2 study in COPD. The company’s pipeline also includes WIN027, a clinical-stage, long-acting bispecific antibody targeting TSLP and IL-13 with potential applications across multiple inflammatory and immunological diseases. Windward Bio holds exclusive global rights (excluding Greater China and certain Asian countries) to WIN378 through a licensing agreement with Kelun-Biotech and Harbour BioMed, and has separately licensed WIN027 from Qyuns Therapeutics.

“Qiming Venture Partners invests in differentiated, globally competitive biotech innovation designed to address significant unmet needs for patients, and Windward Bio exemplifies this approach. We believe novel, long-acting biologics will reshape the treatment of severe chronic respiratory and skin diseases, and that WIN378 and WIN027 have the potential to expand and meaningfully improve the treatment options available to patients. In the hands of Luca and his team, with their expertise and proven track record, Windward is well-positioned to deliver on this potential, and we look forward to supporting the company through its next phase of growth,” said Alexander Sinclair Wilson, Principal at Qiming Venture Partners.

About Qiming Venture Partners

Qiming Venture Partners was founded in 2006. Currently, Qiming Venture Partners manages eleven US Dollar funds and seven RMB funds with $9.5 billion in capital raised. Since our establishment, we have invested in outstanding companies in the Technology and Healthcare industries at the early and growth stages.

Since our debut, we have backed over 630 fast-growing and innovative companies. Over 290 of our portfolio companies have achieved exits through IPOs at the NYSE, NASDAQ, HKEX, Shanghai Stock Exchange, or Shenzhen Stock Exchange, or through M&A or other means. There are also over 110 portfolio companies that have achieved unicorn or super unicorn status.

Many of our portfolio companies are today’s most influential firms in their respective sectors, including Xiaomi, Meituan, Bilibili, Zhihu, Roborock, Hesai Technology, UBTech, WeRide, HyperStrong, Insta360, Unisound, Biren Technology, Z.AI, Gan & Lee Pharmaceuticals, Tigermed, Zai Lab, CanSino Biologics, Schrödinger, APT Medical, Sanyou Medical, AmoyDx, SinocellTech, Insilico Medicine, AusperBio, Yuanxin Technology, Medilink Therapeutics, LaNova Medicines, StepFun, among many others.

Innovent Announces Seven Innovative Products Including Mazdutide and PECONDLE® Successfully Included in the 2026 National Reimbursement Drug List

PALO ALTO, Calif. and SUZHOU, China, Nov. 14, 2026 /PRNewswire/ — Innovent Biologics, Inc. (HKEX Stock Code: 01801), a biopharmaceutical company dedicated to the research, development, manufacturing, and commercialization of innovative drugs for major diseases including oncology, autoimmune, metabolic, and ophthalmic diseases, announced that seven innovative products of Innovent were successfully included in the updated National Reimbursement Drug List (2026) (the “NRDL”).

Products included in the NRDL for the first time include mazdutide (a GCG/GLP-1 dual receptor agonist), PECONDLE® (picankibart injection, an IL-23p19 inhibitor), TABOSUN® (Ipilimumab N01 injection, a CTLA-4 inhibitor), and Vanflyta® (quizartinib, a Type II FLT3 inhibitor). Products with newly added indications included in the NRDL comprise TYVYT® (sintilimab injection, an anti-PD-1 monoclonal antibody) and Jaypirca® (pirtobrutinib, a non-covalent BTK inhibitor); and SINTBILO® (tafolecimab injection, a fully human PCSK9 monoclonal antibody) was successfully renewed. The updated NRDL will officially take effect from January 1, 2027.

Dr. Michael Yu, the Founder, Chairman of the Board and CEO of Innovent, stated: “We are highly pleased that the seven innovative drugs of Innovent have been successfully included in the National Reimbursement Drug List this time, covering disease areas with heavy societal burdens such as oncology (colon cancer, renal cancer, and hematological malignancies), cardiovascular and metabolic diseases, as well as autoimmune diseases. The inclusion of the innovative drugs in the NRDL will further enhance the accessibility and affordability for patients, allowing more of the public to benefit. With this, the lineup of Innovent’s innovative drugs covered by the NRDL has expanded to 17, cumulatively benefiting over 20 million patients, and continuously fortifying the medication safeguards for patients through innovative achievements. Adhering to our corporate mission to ’empower patients worldwide with affordable, high-quality biopharmaceuticals’, Innovent consistently places patient needs at its core, actively responds to the strategic call of ‘Healthy China 2030’, facilitates the construction of a universal health safeguard system through practical actions, and promotes the continuous improvement of people’s health. We will actively cooperate with the implementation of medical insurance policies, ensuring that high-quality innovative medicines benefit countless households faster and more broadly.

Mazdutide
Innovent entered into an exclusive license agreement with Eli Lilly and Company for the development and commercialization of OXM3 (also known as mazdutide), a GLP-1R and GCGR dual agonist, in China. As a mammalian oxyntomodulin (OXM) analogue, mazdutide may offer additional benefits beyond those of GLP-1 receptor agonists—such as promoting insulin secretion, lowering blood glucose and reducing body weight. Mazdutide has demonstrated excellent weight loss and glucose-lowering effects in clinical studies. It has also shown benefits in reducing waist circumference, blood lipids, blood pressure, blood uric acid, liver enzymes, and liver fat content, as well as improving insulin sensitivity.

Mazdutide is newly included in the updated NRDL for: type 2 diabetes in adults. Mazdutide is the first and only approved GCG/GLP-1 dual receptor agonist globally. This inclusion into the NRDL will provide a better option for the comprehensive management of Chinese patients with type 2 diabetes.

PECONDLE® (picankibart injection)

Picankibart (IBI112) is a recombinant anti-interleukin-23p19 subunit (IL-23p19) antibody injection. It is a monoclonal antibody with independent intellectual property rights independently developed by Innovent, which specifically binds to the IL-23p19 subunit. By preventing IL-23 from binding to cell surface receptors, it blocks the IL-23 receptor-mediated signaling pathway to exert anti-inflammatory effects.

Picankibart injection is newly included in the updated NRDL for: adult patients with moderate to severe plaque psoriasis eligible for systemic therapy. Picankibart is the first and only domestic IL-23p19 inhibitor. It is also the first product among global IL-23p19 drugs with the same target to achieve a PASI 90 response rate exceeding 80% at 16 weeks in a Phase III registrational clinical trial, and possesses the longest maintenance dosing interval in its class (once every 12 weeks). This inclusion in the NRDL will effectively improve treatment convenience and patient compliance.

TABOSUN® (Ipilimumab N01 injection)

Ipilimumab N01 (IBI310) is a recombinant fully human anti-CTLA-4 monoclonal antibody independently developed by Innovent. Ipilimumab N01 can specifically bind to CTLA-4, thereby blocking CTLA-4-mediated T cell inhibition, promoting the activation and proliferation of T cells, enhancing the tumor immune response, and achieving anti-tumor effects.

Ipilimumab N01 injection is newly included in the updated NRDL for: use in combination with sintilimab for the neoadjuvant treatment of patients with resectable stage IIB-III microsatellite instability-high (MSI-H) or mismatch repair deficient (dMMR) colon cancer. As the world’s only approved dual-immunotherapy combination regimen for this indication, it synergistically activates anti-tumor immunity through both the CTLA-4 and PD-1 pathways, providing patients with a short-course, chemotherapy-free, and 0-recurrence neoadjuvant treatment option, which fills the dual gaps in clinical practice and medical insurance coverage.

VANFLYTA® (quizartinib)

Quizartinib is an oral, highly potent type II FLT3 inhibitor that targets FLT3-ITD mutations, developed by Daiichi Sankyo and solely commercialized in Mainland China by Innovent.

Quizartinib is newly included in the updated NRDL for: newly diagnosed acute myeloid leukemia (AML) that is FMS-like tyrosine kinase 3 internal tandem duplication (FLT3-ITD) positive as detected by an adequate validated diagnostic test. It has effectively filled the gap in the NRDL coverage, addressed the shortcomings in clinical treatment, and practically alleviated the treatment burden of AML patients.

TYVYT® (sintilimab injection)

Sintilimab injection (IBI308) is an innovative PD-1 inhibitor drug jointly developed by Innovent and Eli Lilly and Company.

Sintilimab has been approved in China for ten indications, covering squamous non-small cell lung cancer, non-squamous non-small cell lung cancer (including EGFR/ALK wild type non-squamous NSCLC and EGFR-TKI treatment failed non-squamous NSCLC), hepatocellular carcinoma, gastric or gastroesophageal junction adenocarcinoma, esophageal squamous cell cancer, endometrial cancer, colon cancer, renal cell carcinoma and classical Hodgkin’s lymphoma.

Two additional indications have been successfully included in the updated NRDL: sintilimab in combination with ipilimumab N01 as neoadjuvant treatment for patients with resectable stage IIB–III microsatellite instability-high (MSI-H) or mismatch repair-deficient (dMMR) colon cancer; and sintilimab in combination with fruquintinib for patients with locally advanced or metastatic renal cell carcinoma who have failed prior vascular endothelial growth factor receptor (VEGFR) tyrosine kinase inhibitors (TKI) therapy and have not received programmed death receptor-1 (PD-1) or programmed death ligand 1 (PD-L1) inhibitor therapy in the first-line setting. The NRDL inclusion of two indications further broadens reimbursement coverage for the neoadjuvant treatment of patients with MSI-H/dMMR colon cancer and the combination treatment of targeted therapy and immunotherapy for second-line renal cell carcinoma patients.

Jaypirca® (pirtobrutinib)

Pirtobrutinib is a highly selective, non-covalent (reversible) Bruton’s tyrosine kinase (BTK) inhibitor developed by Eli Lilly and Company, for which Innovent is responsible for the exclusive commercialization in Mainland China. In preclinical studies, pirtobrutinib is 300 times more selective for BTK versus 98% of other kinases tested[i]. BTK is a validated molecular target found across numerous B-cell leukemias and lymphomas including mantle cell lymphoma (MCL) and chronic lymphocytic leukemia (CLL)[ii],[iii].

Pirtobrutinib was approved in China in October 2024 and was officially included in the NRDL on January 1, 2026. One additional indication has now been successfully included in the updated NRDL: treatment of adult patients with chronic lymphocytic leukemia (CLL)/small lymphocytic lymphoma (SLL) who have received at least one prior systemic therapy that included a Bruton’s tyrosine kinase (BTK) inhibitor. This further broadens NRDL coverage for the treatment of this disease.

SINTBILO® (tafolecimab injection)

Tafolecimab injection (IBI306) is the first domestic fully human anti-PCSK9 monoclonal antibody independently developed by Innovent. By inhibiting proprotein convertase subtilisin/kexin type 9 (PCSK9) in blood plasma, it blocks its binding to the low-density lipoprotein receptor(LDLR), thereby preventing the endocytosis and degradation of LDLR, increasing the expression level and quantity of LDLR on the cell surface, enhancing the reuptake of low-density lipoprotein cholesterol (LDL-C) by LDLR, and decreasing the circulating LDL-C level, ultimately achieving the purpose of lowering blood lipids.

Tafolecimab was approved for marketing in August 2023 and was officially included in the NRDL on January 1, 2025. This successful contract renewal will further alleviate the financial burden on patients, enabling this advanced lipid-lowering therapy to benefit a broader patient population.

Looking towards the goals of the China’s “15th Five-Year Plan”, Innovent will remain committed to innovation-driven development, focus on the unmet clinical needs in the field of major diseases, and continuously advance the R&D, manufacturing and commercialization of high-quality innovative drugs, to serve people’s lives and health with more innovative achievements, and contribute to the high-quality development of the biopharmaceutical industry and the building of a “Healthy China”.

About Innovent

Innovent is a leading biopharmaceutical company founded in 2011 with the mission to empower patients worldwide with affordable, high-quality biopharmaceuticals. The company discovers, develops, manufactures and commercializes innovative medicines that target some of the most intractable diseases. Its pioneering therapies treat cancer, cardiovascular and metabolic, autoimmune and eye diseases. Innovent has launched 20 products in the market. It has 1 asset under NMPA review, 6 assets in phase 3 or pivotal clinical trials, and 20 more molecules in early clinical stage.

Innovent has entered into more than 30 strategic partnerships with global players such as Eli Lilly, Roche, Takeda, Pfizer, Sanofi, Incyte, and MD Anderson Cancer Center, representing an aggregate value of over RMB 350 billion. These efforts have set a benchmark for the high quality outbound internationalization of China’s innovative drug industry.

Guided by the motto, “Start with Integrity, Succeed through Action,” Innovent maintains the highest standard of industry practices and works collaboratively to advance the biopharmaceutical industry so that first-rate pharmaceutical drugs can become widely accessible.

For more information, visit www.innoventbio.com, or follow Innovent on Facebook and LinkedIn.

Statement: (1)Innovent does not recommend the use of any unapproved drug (s)/indication (s).

(2) Ramucirumab Injection (Cyramza®), Selpercatinib Capsules (Retsevmo®), Pirtobrutinib Tablets (Jaypirca®) and abemaciclib (Verzenios®) are products discovered and developed by Eli Lilly.

Forward-Looking Statements

This news release may contain certain forward-looking statements that are, by their nature, subject to significant risks and uncertainties. The words “anticipate”, “believe”, “estimate”, “expect”, “intend” and similar expressions, as they relate to Innovent, are intended to identify certain of such forward-looking statements. Innovent does not intend to update these forward-looking statements regularly.

These forward-looking statements are based on the existing beliefs, assumptions, expectations, estimates, projections and understandings of the management of Innovent with respect to future events at the time these statements are made. These statements are not a guarantee of future developments and are subject to risks, uncertainties and other factors, some of which are beyond Innovent’s control and are difficult to predict. Consequently, actual results may differ materially from information contained in the forward-looking statements as a result of future changes or developments in our business, Innovent’s competitive environment and political, economic, legal and social conditions.

References

[i] Mato AR, Shah NN, Jurczak W, et al. Pirtobrutinib in relapsed or refractory B-cell malignancies (BRUIN): a phase 1/2 study. Lancet. 2021;397(10277):892-901. doi:10.1016/S0140-6736(21)00224-5

[ii] Hanel W, Epperla N. Emerging therapies in mantle cell lymphoma. J Hematol Oncol. 2020;13(1):79. Published 2020 Jun 17. doi:10.1186/s13045-020-00914-1

[iii] Gu D, Tang H, Wu J, Li J, Miao Y. Targeting Bruton tyrosine kinase using non-covalent inhibitors in B cell malignancies. J Hematol Oncol. 2021;14(1):40. Published 2021 Mar 6. doi:10.1186/s13045-021-01049-7


WeFetch AI Corp. Is the New Name of GreenCore Solutions Corp.

gtinfetch.ai, WeFetch.ai’s lead product, removes the guess from artificial intelligence (AI) shopping: the right barcode, and signed proof of it.

VANCOUVER, BC and LONDON, Nov. 14, 2026 /PRNewswire/ — WeFetch AI Corp., the artificial intelligence (AI) shopping company formerly named GreenCore Solutions Corp., has completed its change of name. The Registrar of Companies for British Columbia issued the Certificate of Change of Name on November 13, 2026.

One Answer for Every Barcode

An AI agent picks a product in words. The same words can match a dozen barcodes: the right brand in the wrong size, last year’s pack, a look-alike from another maker. When the agent guesses, the shopper gets the wrong product, the brand loses a sale it had already won, and the retailer pays for the return.

The Company’s lead product, gtinfetch.ai, removes the guess. It answers for 84,810,515 barcodes from 376,271 makers across 3,520,471 points of sale. An AI agent sends a barcode and gets a firm answer: verified, not verified or unknown, with the sources behind it.

Who it matters to:

  • The shopper gets the product they asked for.
  • The brand keeps the sale the AI already gave it.
  • The retailer does not pay for a wrong order.

A Signed Receipt of Every Check

When an AI agent buys on a shopper’s behalf, someone has to be able to show it bought the right product. Today nobody can: the agent’s choice leaves no record. gtinfetch.ai gives the agent a signed receipt of the check, written at rco.wefetch.ai and open to public verification. The retailer, the brand and the auditor can each see what was checked, when, and what the answer was. The mark is “Barcode verified”.

Three Regions, One Record

The full record now answers from France, Singapore and the United States. Every barcode also has its own free public page at gtinfetch.ai. The three regions are where AI shopping starts. Singapore has the highest consumer use of generative AI in Asia, at 64.3% of working-age people. France stands at 49.6% and the United States at 33.0%, against 18.8% worldwide. (Source: Microsoft AI Diffusion Report, Q2 2026.) They are also the home markets of the AI that shoppers ask: ChatGPT and Claude in the United States, Mistral in France, and Singapore among the top countries in the world for Claude use per head. (Source: Anthropic Economic Index.)

What we built

WeFetch.ai, the barcode fetch system for AI agents. It answers for 84 million products in 70 countries, with 3.5 million points of sale on its own record, and includes:

  • triggerfetch for brands;
  • shopfetch for shoppers;
  • matchfetch for AI agents;
  • gtinfetch, the record itself.

It is AI native, and works with ChatGPT, Claude, Gemini, Grok, Mistral, Perplexity and Muse. Every answer is signed.

“Words were the first generation of AI answers. Barcodes are agentic commerce,” said Matthew Keddy, Chief Executive Officer of WeFetch AI Corp. “Every AI agent that moves from search results to shopping needs barcode precision. wefetch has it, signed, in three regions.”

The market: Gartner forecasts $2.7 trillion in AI spending in 2026. McKinsey projects that AI agents will orchestrate $3 trillion to $5 trillion in global commerce by 2030, up to $1 trillion of it in US retail. Every one of those AI agent purchases needs the right barcode.

About WeFetch AI Corp.

WeFetch AI Corp. develops AI software products for AI shopping, retail, grocery and fast-moving consumer goods (FMCG). Its lead product, gtinfetch.ai, is the AI agentic shopping barcode engine: 84 million barcodes, answered for the agents of seven AI labs. WeFetch is headquartered in Vancouver, Canada, with sales offices in London, UK. Please visit: wefetch.ai

11 Boutique Xinjiang Wineries to Debut in Singapore

The launch programme includes a one-day trade exhibition, Master of Wine masterclass and Michelin-starred pairing dinner, highlighting Xinjiang terroir.


SINGAPORE – Media OutReach Newswire – 14 November 2026 – Eleven boutique wineries from China’s Xinjiang Uygur Autonomous Region will make their collective Singapore debut on Nov. 19 & 20. This campaign, titled “Xinjiang Wine: A World of Chinese Terroir”, will introduce Southeast Asian sommeliers, importers and fine wine collectors to 68 labels spanning four distinct Xinjiang viticultural subregions.

博格达峰

Organized by the Forestry and Grassland Administration of Xinjiang Uygur Autonomous Region alongside campaign lead Up-Chinese Wine (UCW) and strategic partners Vinexpo Asia and Jin Ting Wan Chinese Restaurant, the tripartite initiative aims to establish an international trade platform bridging production with distribution, expand on-trade dining channels and elevate the regional identity of Xinjiang wine across Southeast Asia.

The showcase features 68 core labels—including 60 domestic and international award winners—presented across three invitation-only trade and gastronomic sessions:

  • Nov. 19 — Gala Pairing Dinner: Hosted at Singapore’s Michelin-starred Jin Ting Wan Chinese Restaurant overlooking Marina Bay, the opening dinner pairs one flagship vintage from each of the 11 participating wineries with bespoke Cantonese fine dining. Jin Ting Wan head sommelier Joe Yang, recipient of the 2026 Michelin Guide Singapore Sommelier Award, will spearhead an ongoing initiative to integrate Xinjiang vintages into the restaurant’s wine program.
  • Nov. 20 — Regional Masterclass: Master of Wine Xing Wei, who curated the lineup for both the gala dinner and educational programming, will lead an analytical masterclass examining the viticultural evolution, macroclimates, soil compositions and varietal profiles of Xinjiang’s four primary wine-producing subregions.
  • Nov. 20 — Trade Exhibition and Walk-Around Tasting: Open by invitation to certified sommeliers, wine importers, distributors, high-end restaurateurs, trade media and collectors, the exhibition enables side-by-side comparative tastings across all 68 labels and 60 award winning wines.

Government Backing and Market Expansion The Singapore debut follows seven policy measures issued by the General Office of the People’s Government of Xinjiang Uygur Autonomous Region to modernize the regional wine sector. The directives focus on upgrading vineyard grape bases, expanding corporate vinification and processing infrastructure, strengthening regional brand equity, advancing wine tourism and industry integration, reinforcing viticultural research and expanding financial guarantees for overseas market entry.

Concurrently, an official delegation from the Forestry and Grassland Administration of Xinjiang Uygur Autonomous Region will conduct market research in Singapore—evaluating local consumption patterns, import regulations and distribution networks—while meeting with major importers, restaurant groups and trade associations to build long-term commercial partnerships.

Four Distinct Terroirs of the Tianshan Mountains Fed by glacial snowmelt from the Tianshan Mountains, Xinjiang’s vineyards span vast geographic distances north and south of the range, producing contrasting mesoclimates and varietal expressions:

  • Turpan-Hami (Tu-Ha) Basin: Characterized by an arid, high-heat continental climate suited to ripe, concentrated styles.
  • Yanqi Basin: Naturally moderated by surrounding mountains and nearby lake systems that temper seasonal extremes.
  • Northern Slopes of the Tianshan Mountains: Home to Xinjiang’s largest wine-producing cluster and a center for modern, large-scale experimental viticulture.
  • Ili Valley: Uniquely tempered by warm, humid Atlantic airflows that create a markedly distinct growing environment.

Participating Wineries The 11 exhibiting producers representing all four subregions are:

Turpan-Hami Basin

  • Puchang Vineyard

Yanqi Basin

  • Château Aroma
  • Tiansai Vineyards
  • Bainian Manor
  • Château Zhong Fei

Northern Foothills of Tianshan Mountains

  • Château Xianghai
  • Château Lixuan
  • Yaochixiye Winery
  • Tangting Xialu Winery

Ili River Valley

  • Silk Road Vineyards
  • Château Crescent

Notes to Editors: Two Millennia of Silk Road Viticulture
Modern Xinjiang producers combine contemporary vineyard management, clonal selection, terroir mapping and international winemaking technology with a viticultural history spanning more than 2,000 years. Historically known as the Western Regions (Xiyu), Xinjiang served as a primary conduit for the east-west exchange of Vitis vinifera and winemaking craft along the overland Silk Road.

Between the third and second centuries B.C., winemaking techniques crossed the Pamir Plateau into oasis kingdoms north and south of the Tianshan Mountains, including Niya, Kucha (Qiuci), Karasahr (Yanqi) and Gaochang. Archaeological discoveries—such as a 2,300-year-old grapevine unearthed at the Yanghai Tombs in Shanshan County, Turpan, and painted pottery bearing grape motifs in Hejing County—date local viticulture prior to imperial envoy Zhang Qian’s 138 B.C. diplomatic expedition, which introduced Vitis vinifera varieties from Dayuan to the Han court. Subsequent artifacts, including Loulan and Astana tomb murals depicting vineyard cultivation and wine pressing, Gaochang tax ledgers recording vineyard acreage and wine levies, and Tang dynasty records of Gaochang tribute wines sent to Chang’an, document an unbroken regional winemaking lineage.

Hashtag: #XinjiangWine

The issuer is solely responsible for the content of this announcement.
Fly-E Group, Inc. Announces Second Quarter and First Half of Fiscal Year 2027 Financial Results

NEW YORK, Nov. 14, 2026 /PRNewswire/ — Fly-E Group, Inc. (Nasdaq: FLYE) (“Fly-E” or the “Company”), an electric vehicle company engaged in designing, installing, selling, and renting smart electric motorcycles, electric bikes, and electric scooters, today announced its unaudited financial results for the second quarter and first half of fiscal year 2027 ended September 30, 2026.

Second quarter of Fiscal Year 2027 Financial Summary

  • Net revenues were $2.6 million, compared to $3.9 million in the same period last year.
  • Gross profit was $0.2 million, compared to $1.0 million in the same period last year.
  • Gross margin was 8.1%, compared to 25.0% in the same period last year.
  • Net Loss was $1.7 million, compared to $1.8 million in the same period last year.
  • Basic and diluted losses per share were $1.07, compared to $2.18 in the same period last year.

Mr. Zhou (Andy) Ou, Chief Executive Officer of Fly-E, commented, “During the second quarter, our operational network stabilized following the retail restructuring, with our top-line revenue holding steady sequentially. Our wholesale revenues grew 21.4% year-over-year and accounted for a significantly higher proportion of our total revenue. This evolving revenue mix, combined with promotional pricing in our retail business, naturally influenced our overall margin profile for the period. Meanwhile, we continued to control store-level costs and address corporate matters carefully to strengthen the Company’s foundation for the future. By maintaining our operational network and disciplined cost management, we are dedicated to preserving business stability while positioning Fly-E to explore strategic opportunities for long-term growth.”

Second quarter of Fiscal Year 2027 Financial Results

(Three Months Ended September 30, 2026)

Net Revenues

Net revenues were $2.6 million in the second quarter of fiscal year 2027, a decrease of 33.7% from $3.9 million in the same period last year. The decrease was primarily driven by a lower sales volume of 7,392 units in the second quarter of fiscal year 2027, compared to 18,564 in the same period last year, resulting from the reduction in our direct retail store count to four stores as of September 30, 2026, compared to 11 stores as of September 30, 2025.

  • Retail sales revenue was $0.5 million in the second quarter of fiscal year 2027, a decrease of 77.4% from $2.0 million in the same period last year. The decline was primarily driven by planned store reductions, promotional pricing strategies in response to market competition, and softened consumer demand for E-Bikes and E-Scooters following industry-wide lithium-ion battery safety concerns in the New York market.
  • Wholesale revenue was $2.1 million in the second quarter of fiscal year 2027, an increase of 21.4% from $1.7 million in the same period last year. This growth was primarily due to ongoing product purchases from previous company-owned retail stores that transitioned to independent operations during the period.

Cost of Revenues

Cost of revenues was $2.4 million in the second quarter of fiscal year 2027, a decrease of 18.8% from $2.9 million in the same period last year, primarily aligning with lower sales volume driven by the downsizing of our retail store network.

Gross Profit and Margin

Gross profit was $0.2 million in the second quarter of fiscal year 2027, compared to $1.0 million in the same period last year. Gross margin was 8.1% in the second quarter of fiscal year 2027, compared to 25.0% in the same period last year. The decrease in gross margin was primarily attributable to a structural mix shift from direct retail toward lower-priced wholesale channels, further impacted by competitive retail pricing and inventory clearance discounts.

Total Operating Expenses

Total operating expenses were $1.8 million in the second quarter of fiscal year 2027, a decrease of 9.8% compared to $2.0 million in the same period last year. The decrease was primarily attributable to store-level operational savings, which were partially offset by increases in expected credit losses and professional fees.

  • Selling expenses were $0.3 million in the second quarter of fiscal year 2027, a significant decrease of 74.3% from $1.0 million in the same period last year, primarily driven by the reduction of retail stores which significantly lowered associated payroll, rental and utility expenses.
  • General and administrative expenses were $1.5 million in the second quarter of fiscal year 2027, an increase of 56.6% from $1.0 million in the same period last year. The increase was primarily attributable to expected credit losses on prepayments and receivables and litigation-related legal fees, which were partially offset by cost savings in payroll and software development expenses.

Net Loss

Net loss was $1.7 million in the second quarter of fiscal year 2027, compared to $1.8 million in the same period last year.

Basic and Diluted Earnings (Losses) per Share

Basic and diluted losses per share were $1.07 in the second quarter of fiscal year 2027, compared to $2.18 in the same period last year.

EBITDA

EBITDA was negative $1.3 million in the second quarter of fiscal year 2027, compared to negative EBITDA of $1.0 million in the same period last year.

First Half of Fiscal Year 2027 Financial Results

(Six Months Ended September 30, 2026)

Net Revenues

Net revenues were $5.3 million in the first half of fiscal year 2027, a decrease of 42.2% from $9.2 million in the same period last year. The decrease was primarily driven by a significant reduction in direct retail store counts, resulting in a lower sales volume of 14,950 units in the first half of fiscal year 2027, compared to 29,012 in the same period last year.

  • Retail sales revenue was $1.0 million in the first half of fiscal year 2027, a decrease of 81.9% from $5.8 million in the same period last year. The decline was primarily due to significant retail store downsizing, promotional pricing adjustments, and lithium-ion battery safety headwinds in the New York market.
  • Wholesale revenue was $4.2 million in the first half of fiscal year 2027, an increase of 33.0% from $3.2 million in the same period last year. This increase was primarily attributable to ongoing product purchases from the retail stores that were streamlined and transitioned to independent operations during the period.

Cost of Revenues

Cost of revenues was $4.8 million in the first half of fiscal year 2027, a decrease of 19.5% from $6.0 million in the same period last year, primarily reflecting lower sales volume following the downsizing of our retail store network.

Gross Profit and Margin

Gross profit was $0.5 million in the first half of fiscal year 2027, compared to $3.2 million in the same period last year. Gross margin was 9.5% in the first half of fiscal year 2027, compared to 35.1% in the same period last year. The decrease in gross margin was primarily attributable to the greater revenue percentage of wholesale channels at lower-priced wholesale pricing, as well as promotional retail pricing adjustment and inventory clearance discounts.

Total Operating Expenses

Total operating expenses were $5.7 million in the first half of fiscal year 2027, a decrease of 2.2% compared to $5.8 million in the same period last year. The decrease was primarily attributable to operational cost savings from retail store reductions, which were offset by increases in expected credit losses and software development fees.

  • Selling expenses were $0.8 million in the first half of fiscal year 2027, a significant decrease of 68.1% from $2.3 million in the same period last year, primarily driven by the reductions in store-level payroll and rental expenses following retail store network downsizing.
  • General and administrative expenses were $4.8 million in the first half of fiscal year 2027, an increase of 42.7% from $3.4 million in the same period last year. The increase was primarily attributable to expected credit losses on prepayments and receivables and software development fees for our ERP and mobile applications, which were partially offset by decreases in professional fees, payroll and insurance expenses.

Net Loss

Net loss was $5.6 million in the first half of fiscal year 2027, compared to $3.8 million in the same period last year.

Basic and Diluted Earnings (Losses) per Share

Basic and diluted losses per share were $3.48 in the first half of fiscal year 2027, compared to $6.58 in the same period last year.

EBITDA

EBITDA was negative $4.7 million in the first half of fiscal year 2027, compared to negative EBITDA of $2.2 million in the same period last year.

Financial Condition

As of September 30, 2026, the Company had cash of $0.5 million, compared to $0.3 million as of March 31, 2026.

About Fly-E Group, Inc.

Fly-E Group, Inc. is an electric vehicle company that is principally engaged in designing, installing, selling, and renting smart electric motorcycles, electric bikes, and electric scooters under the brand “Fly E-Bike.” The Company’s commitment is to encourage people to incorporate eco-friendly transportation into their active lifestyles, ultimately contributing towards building a more environmentally friendly future. For more information, please visit the Company’s website: https://investors.flyebike.com.

Non-GAAP Financial Measures

To supplement our financial information presented in accordance with the generally accepted accounting principles in the United States (the “U.S. GAAP”), management periodically uses certain “non-GAAP financial measures,” as such term is defined under the rules of the SEC, to clarify and enhance understanding of past performance and prospects for the future. Generally, a non-GAAP financial measure is a numerical measure of a company’s operating performance, financial position or cash flows that excludes or includes amounts that are included in or excluded from the most directly comparable measure calculated and presented in accordance with U.S. GAAP. For example, non-GAAP measures may exclude the impact of certain items such as acquisitions, divestitures, gains, losses and impairments, or items outside of management’s control. Management believes that the following non-GAAP financial measure provides investors and analysts useful insight into our financial position and operating performance. Any non-GAAP measure provided should be viewed in addition to, and not as an alternative to, the most directly comparable measure determined in accordance with U.S. GAAP. Further, the calculation of these non-GAAP financial measures may differ from the calculation of similarly titled financial measures presented by other companies and therefore may not be comparable among companies.

We use EBITDA (earnings before interest, taxes, depreciation, and amortization) to evaluate our operating performance. We believe EBITDA provides additional insight into our underlying, ongoing operating performance and facilitates year-to-year comparisons by excluding the earnings impact of interest, tax, depreciation and amortization and that presenting EBITDA is more representative of our operational performance and may be more useful for investors.

We reconcile our non-GAAP financial measure to our net income, which is our most directly comparable financial measure calculated and presented in accordance with U.S. GAAP. EBITDA includes adjustments for provision for income taxes, as applicable, interest income and expense, depreciation, and amortization. EBITDA does not represent and should not be considered an alternative to net income as determined by U.S. GAAP, and our calculations thereof may not be comparable to those reported by other companies. We believe EBITDA is an important measure of operating performance and provides useful information to investors because it highlights trends in our business that may not otherwise be apparent when relying solely on U.S. GAAP measures and because it eliminates items that have less bearing on our operating performance. EBITDA, as presented herein, is a supplemental measure of our performance that is not required by, or presented in accordance with, U.S. GAAP. We use non-GAAP financial measures as supplements to our U.S. GAAP results in order to provide a more complete understanding of the factors and trends affecting our business. EBITDA is a measure of operating performance that is not defined by U.S. GAAP and should not be considered a substitute for net (loss) income as determined in accordance with U.S. GAAP.

Forward-Looking Statements

Certain statements in this announcement are forward-looking statements. These forward-looking statements involve known and unknown risks and uncertainties and are based on the Company’s current expectations and projections about future events that the Company believes may affect its financial condition, results of operations, business strategy and financial needs. Investors can find many (but not all) of these statements by the use of words such as “approximates,” “believes,” “hopes,” “expects,” “anticipates,” “estimates,” “projects,” “intends,” “plans,” “will,” “would,” “should,” “could,” “may” or other similar expressions. Although the Company believes that the expectations expressed in these forward-looking statements are reasonable, it cannot assure you that such expectations will turn out to be correct. The Company cautions investors that actual results may differ materially from the anticipated results, and that the forward-looking statements contained in this press release are subject to the risks set forth in the Company’s filings with the Securities and Exchange Commission (the “SEC”), including the section under “Risk Factors” of its most recent Annual Report on Form 10-K for the fiscal year ended March 31, 2026, filed with the SEC on July 23, 2026, as amended by the Company’s subsequent filings, including updates to the Risk Factors. The Company undertakes no obligation to update or revise publicly any forward-looking statements to reflect subsequently occurring events or circumstances, or changes in its expectations, except as may be required by law.

For investor and media inquiries, please contact:

Fly-E Group, Inc.
Investor Relations Department
Email: ir@flyebike.com

Seaquant Consulting
Email: investors@sea-quant.com


 FLY-E GROUP, INC.

UNAUDITED CONDENSED CONSOLIDATED BALANCE SHEETS

(Expressed in U.S. dollars, except for the number of shares)

As of
September 30,

2026

As of
March 31,
2026

ASSETS

Current Assets

Cash

$

504,721

$

265,236

Accounts receivable, net

9,614,683

7,049,592

Accounts receivable, net – a related party

32,030

32,030

Inventories, net

1,783,574

2,334,484

Prepayments and other receivables

3,848,174

6,967,596

Prepayments and other receivables – related parties

237,034

161,560

Total Current Assets

16,020,216

16,810,498

Property and equipment, net

5,483,835

5,792,915

Security deposits

332,132

369,249

Operating lease right-of-use assets

3,387,955

4,289,237

Intangible assets, net

375,789

431,193

Long-term prepayment for software development

—

1,800,000

Total Assets

$

25,599,927

$

29,493,092

LIABILITIES AND STOCKHOLDERS’ EQUITY

Current Liabilities

Accounts payable

$

1,549,917

$

433,188

Short-term loan payables

3,936,058

3,936,058

Current portion of long-term loan payables

80,120

93,980

Accrued expenses and other payables

787,043

680,200

Notes payable

1,200,000

—

Accrued expenses and other payables – a related party

—

225

Operating lease liabilities – current

1,431,132

1,507,340

Taxes payable

541,241

151,930

Liabilities held for sale

—

—

Total Current Liabilities

9,525,511

6,802,921

Long-term loan payables

1,909,424

1,945,442

Operating lease liabilities – non-current

2,405,600

3,302,325

Total Liabilities

13,840,535

12,050,688

Commitment and Contingencies

Stockholders’ Equity

Preferred stock, $0.01 par value, 10,000,000 shares authorized and nil
outstanding as of September 30, 2026 and March 31, 2026*

—

—

Common stock, $0.01 par value, 300,000,000 shares authorized and
1,632,386 shares outstanding as of September 30, 2026 and March 31, 2026*

16,324

16,324

Additional paid-in capital

27,826,643

27,826,643

Shares subscription receivable

(219,998)

(219,998)

Accumulated deficit

(15,836,330)

(10,153,318)

Accumulated other comprehensive loss

(27,247)

(27,247)

Total FLY-E Group, Inc. Stockholders’ Equity

11,759,392

17,442,404

Total Liabilities and Stockholders’ Equity

$

25,599,927

$

29,493,092

*

Shares and per share data are presented on a retroactive basis to reflect the 1-for-5 reverse stock split
completed on July 3, 2025 and the 1-for-20 reverse stock split completed on November 4, 2025.


FLY-E GROUP, INC.

UNAUDITED CONDENSED CONSOLIDATED STATEMENTS OF OPERATIONS AND

COMPREHENSIVE LOSS

(Expressed in U.S. dollars, except for the number of shares)

For the Three Months Ended
September 30,

For the Six Months Ended
September 30,

2026

2025

2026

2025

Revenues

$

2,590,216

$

3,908,862

$

5,338,356

$

9,237,060

Cost of Revenues

2,380,990

2,932,341

4,829,266

5,999,164

Gross Profit

209,226

976,521

509,090

3,237,896

Operating Expenses

Selling Expenses

264,540

1,027,726

750,004

2,348,943

General and Administrative Expenses

1,561,585

997,218

4,912,256

3,442,151

Total Operating Expenses

1,826,125

2,024,944

5,662,260

5,791,094

Loss from Operations

(1,616,899)

(1,048,423)

(5,153,170)

(2,553,198)

Other Income (Expenses), net

164,695

(148,153)

42,300

(156,051)

Interest Expenses, net

(211,725)

(539,537)

(403,142)

(1,085,771)

Loss Before Income Taxes

(1,663,929)

(1,736,113)

(5,514,012)

(3,795,020)

Income Tax (Expense) Benefit

(80,000)

(40,012)

(169,000)

10,247

Net Loss

$

(1,743,929)

$

(1,776,125)

$

(5,683,012)

$

(3,784,773)

Other Comprehensive (Loss) Income

Foreign currency translation adjustment

—

(29,378)

—

(7,024)

Total Comprehensive Loss

$

(1,743,929)

$

(1,805,503)

$

(5,683,012)

$

(3,791,797)

Losses per Share*

$

(1.07)

$

(2.18)

$

(3.48)

$

(6.58)

Weighted Average Number of Common Stock

– Basic and Diluted*

1,632,351

813,922

1,632,351

575,463

*

Shares and per share data are presented on a retroactive basis to reflect the 1-for-110,000 stock split completed
on April 2, 2024, the 1-for-5 reverse stock split completed on July 3, 2025 and the 1-for-20 reverse stock split
completed on November 4, 2025.


FLY-E GROUP, INC.

CONSOLIDATED STATEMENTS OF CASH FLOWS

(Expressed in U.S. dollars, except for the number of shares) 

For the Six Months Ended
September 30,

2026

2025

Cash flows from operating activities

Net loss

$

(5,683,012)

$

(3,784,773)

Adjustments to reconcile net loss to net cash used in operating activities:

Loss on disposal of property and equipment

—

68,188

Gain on termination of operating lease

(28,084)

(64,452)

Expected credit losses

1,702,439

—

Depreciation expense

318,785

417,258

Amortization expense

55,404

54,761

Deferred income taxes benefits

—

(42,251)

Amortization of operating lease right-of-use assets

621,222

2,699,632

Inventories reserve

290,935

569,758

Changes in operating assets and liabilities:

Accounts receivable

(2,619,486)

(1,031,989)

Accounts receivable – a related party

—

5,435

Inventories

259,975

(1,107,359)

Prepayments and other receivables

1,471,378

(1,371,452)

Prepayments for operation services to a related party

—

45,000

Security deposits

37,117

41,550

Long-term prepayment for software development

1,800,000

—

Accounts payable

1,116,729

(722,056)

Accrued expenses and other payables

363,789

(793,623)

Accrued expenses and other payables – a related party

(225)

225

Operating lease liabilities

(664,789)

(2,676,403)

Taxes payable

389,311

(14,978)

Net cash used in operating activities

(568,512)

(7,707,529)

Cash flows from investing activities

Purchases of properties and equipment

(9,705)

(44,661)

Payments of property rights

—

(15,477)

Cash released from disposal of entities

—

(230,076)

Repayment from a related party

—

—

Advance to a related party

(75,474)

(161,826)

Net cash used in investing activities

(85,179)

(452,040)

Cash flows from financing activities

Proceeds from borrowings

—

1,917,100

Repayments of borrowings

(6,824)

(1,370,591)

Loan from a third party

900,000

—

Payments of offering cost

—

(516,490)

Net proceeds from issuance of common stock

—

9,773,000

Net cash provided by financing activities

893,176

9,803,019

Net changes in cash including cash classified within current assets held for sale

239,485

1,643,450

Effect of exchange rate changes on cash

—

(7,024)

Less: net change in cash classified within current assets held for sale

—

61,548

Cash at beginning of the period

265,236

840,102

Cash at the end of the period

$

504,721

$

2,538,076

Supplemental disclosure of cash flow information

Cash paid for interest expense

$

256,562

$

1,085,771

Cash paid for income taxes

$

—

$

42,640

Supplemental disclosure of non-cash investing and financing activities

Subscription receivables from share placement

$

—

$

7,596,558

Purchase of vehicle funded by loan

$

—

$

—

Purchase of office funded by loan

$

—

$

—

Purchase of software by using previous prepayments

$

—

$

136,580

Properties used for rental services

$

—

$

49,811

Deferred IPO cost recognized as additional paid-in capital

$

—

$

—

Uncollected proceeds from disposal of subsidiaries

$

1,946,648

$

860,754

Termination of operating lease right-of-use assets and operating lease liabilities

$

280,060

$

3,187,864

Right-of-use assets obtained in exchange for operating lease liabilities

$

—

$

—

EBITDA

The following table sets forth the components of our EBITDA for the three months ended September 30, 2026 and 2025:

For the Three Months Ended September 30,

Percentage

2026

2025

Change

Change

Net Loss

$

(1,743,930)

$

(1,776,125)

$

32,195

(1.8)

%

Income Tax Expense

80,000

40,012

39,988

99.9

%

Depreciation

159,343

204,466

(45,123)

(22.1)

%

Interest Expenses

211,725

539,537

(327,812)

(64.8)

%

Amortization

27,702

27,446

256

0.9

%

EBITDA

$

(1,265,160)

$

(964,664)

$

(300,496)

31.2

%

Percentage of Revenue

(48.8)

%

(24.7)

%

97.6

%

The following table sets forth the components of our EBITDA for the six months ended September 30, 2026 and 2025:

For the Six Months Ended September 30,

Percentage

2026

2025

Change

Change

Net Loss

$

(5,683,013)

$

(3,784,773)

$

(1,898,240)

50.2

%

Income Tax Expenses/(Benefit)

169,000

(10,247)

179,247

(1,749.3)

%

Depreciation

318,785

417,258

(98,473)

(23.6)

%

Interest Expenses

403,142

1,085,771

(682,629)

(62.9)

%

Amortization

55,404

54,761

643

1.2

%

EBITDA

$

(4,736,682)

$

(2,237,230)

$

(2,499,452)

111.7

%

Percentage of Revenue

(88.7)

%

(24.2)

%

266.5

%