Home Blog Page 171

Classys Nears 50,000 Devices Sold Globally as Full-Lineup Growth Accelerates

  • Expands global portfolio beyond HIFU and MRF to include MNRF, laser, and dermabrasion devices, strengthening its medium- to long-term growth foundation
  • 1H26 Exports, excluding shipments to its Brazilian subsidiary, grew 29% year over year, underscoring continued growth across global markets

SEOUL, South Korea, Aug. 25, 2026 /PRNewswire/ — Classys Inc. (KOSDAQ: 214150), a global medical aesthetics company, announced today that, supported by its robust global commercial infrastructure, it expects device sales worldwide to surpass 50,000 units this year.


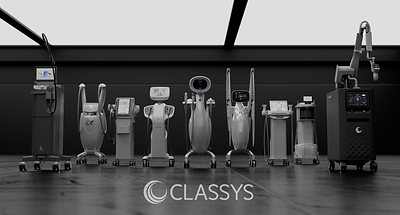
This milestone reflects the company’s successful expansion into new device categories, including microneedle radiofrequency (MNRF) and laser systems, beyond its traditional core portfolio of high-intensity focused ultrasound (HIFU) and monopolar radiofrequency (MRF). By offering a comprehensive aesthetic portfolio designed to address diverse customer needs and leveraging its large global installed base, Classys is strengthening the foundation for sustainable medium- to long-term growth.

As of the end of June, Classys had a cumulative global installed base of more than 22,000 units for its flagship HIFU line and more than 4,000 units for its MRF line. Its MNRF and dermabrasion product lines have also each surpassed 6,000 cumulative global installations. Classys plans to leverage this established footprint to introduce next-generation platforms and create additional avenues for growth through the global rollout of Quadessy and the planned European launch of Viclara later this year.

A well-established sales infrastructure underpins this global expansion. The domestic Korean market, which accounts for approximately 25% of total revenue, serves as a key test market for validating new products and clinical treatment protocols while strengthening the company’s global brand competitiveness. Internationally, Classys has established end-to-end commercial capabilities—from initial market entry and product launches to procedure adoption—supported by a global distributor network, key opinion leaders (KOLs), and a broad network of clinic customers. The ability to introduce next-generation devices through this existing distribution infrastructure is expected to serve as a key driver of future growth.

This expanding commercial foundation continues to translate into strong financial performance. Classys reported consolidated revenue of KRW 192.7 billion for the first half of the year, representing a 20% year-over-year increase. Even excluding the impact of consolidating its Brazilian subsidiary, growth across existing international markets remained robust. Excluding shipments from Classys headquarters to its Brazilian subsidiary, 1H26 export sales increased 29% year over year, demonstrating that demand for Classys products continues to grow across its existing global markets beyond the impact of the transition to direct sales in Brazil.

In Europe, market diversification delivered tangible results, driven by expansion into new countries—including the UK, Sweden, the Netherlands, Finland, Hungary, and Bulgaria—as well as sales growth in existing European markets. Despite continued investments in global commercialization and market expansion, Classys maintained strong profitability, achieving a standalone operating margin of 50.8% in the first half of the year.

The expansion of the installed base is also significant, as it supports recurring consumables revenue and the adoption of multi-device combination treatments. In the first half of the year, consumables revenue reached KRW 80.2 billion, up 5.3% year over year and 52.7% from the first half of 2024. As cumulative global device installations continue to grow, the foundation for stable, recurring consumables revenue is expanding accordingly.

Portfolio diversification through new products is also accelerating, particularly in the dermabrasion category. The previous-generation Aquapure has already built a track record of global sales and established customer relationships, helping to lower barriers to market entry. Set to launch in Europe under the brand name “Viclara” by the end of this year, Classys plans to drive cross-selling and increase utilization by leveraging its existing HIFU, MRF, and MNRF customer base and global distribution network.

Moving forward, Classys plans to expand device distribution in line with regional regulatory approvals and launch timelines, while introducing combination treatment protocols to existing customers to increase device utilization and revenue per customer. The company will also intensify localized marketing efforts through global medical congresses, clinical education programs, and KOL collaborations tailored to regional skin characteristics, treatment preferences, and practitioner needs.

“The continued growth in cumulative global device sales demonstrates that Classys is steadily expanding its reach among medical professionals and patients worldwide,” said Yugene Choi, Head of Investor Relations at Classys. “By continuously introducing new platforms and clinical treatment protocols to our established installed base, distribution channels, and clinical networks, we aim to drive continued growth in both device and consumables sales and sustain our long-term growth in the global medical aesthetics market.”

ISCA and GDUFS Strengthen Singapore–Guangdong Talent Links

Partnership creates new pathways for accountancy students in Guangdong to pursue the Singapore Chartered Accountant Qualification and gain professional exposure in Singapore


SINGAPORE – Media OutReach Newswire – 25 August 2026 – The Institute of Singapore Chartered Accountants (ISCA) and Guangdong University of Foreign Studies (GDUFS) have signed a Memorandum of Understanding (MOU) to strengthen Singapore–Guangdong collaboration in accountancy education and talent development, creating greater opportunities for GDUFS students in Guangdong to connect with the accountancy profession and pursue international professional pathways.

The MOU was signed in Singapore in conjunction with the 16th Singapore-Guangdong Collaboration Council (SGCC) Meeting, underscoring the strategic significance of the partnership and the growing links between Singapore and Guangdong in education, professional services and talent development.

Under the partnership, GDUFS’ Accounting, Auditing and Financial Management programmes will apply for accreditation under the Singapore Chartered Accountant Qualification (SCAQ) programme. Once accredited, graduates of these programmes will be eligible for fee waivers relating to five SCAQ Foundation Programme modules, providing a more streamlined pathway towards attaining the Chartered Accountant of Singapore, or CA (Singapore) designation upon fulfilling the remaining SCAQ requirements.

The partnership will also provide GDUFS students with opportunities to connect with ISCA and the wider accountancy profession, which includes industry and professional networks, events and activities. Students will have access to relevant ISCA membership opportunities and the relevant benefits, while those pursuing the SCAQ pathway will receive study support and opportunities such as internship and job-matching recommendations, SCAQ scholarships and access to ISCA’s publications.

Developing Internationally Connected Accountancy Talent

The partnership reflects ISCA and GDUFS’s shared commitment to developing the next generation of accountancy professionals with the capabilities, professional networks and international exposure to contribute across markets.

The two institutions will also collaborate on professional learning and development, including guest lectures, workshops and seminars for GDUFS faculty, students and alumni, as well as access to ISCA publications and online resources. Continuous professional development collaboration via ISCA’s specialisation programmes in financial forensics, sustainability and subscription-based online learning platforms for accounting professionals will ensure GDUFS graduates remain updated on evolving industry standards and best practices.

ISCA President Mr Lee Boon Teck said: “Our partnership with GDUFS is about building stronger links between Singapore and Guangdong in accountancy education and talent development. By connecting students with professional pathways, networks and industry exposure and opportunities in Singapore, we hope to equip the next generation of accountancy professionals with the capabilities and international exposure ready to contribute in an increasingly interconnected business environment.”

Professor Yu Pengyi, Dean of the School of Accountancy at GDUFS, said: “This partnership with ISCA marks an important milestone in our internationalisation journey, creating new professional pathways and opportunities for our students. By combining our strengths in language and accounting education with ISCA’s professional expertise and networks, we look forward to developing globally minded accounting professionals who can contribute across markets.”

The five-year partnership provides a framework for ISCA and GDUFS to further develop cooperation in accountancy education, professional development and engagement with the accountancy profession.
Hashtag: #ISCA #CharteredAccountants #DifferenceMakers #Accounting #Accountancy #MOU #GDUFS

The issuer is solely responsible for the content of this announcement.

Institute of Singapore Chartered Accountants (ISCA)

The Institute of Singapore Chartered Accountants (ISCA) is the national accountancy body of Singapore. Established in 1963, ISCA administers the Singapore Chartered Accountant Qualification programme and is the designated entity by the Singapore Ministry of Finance to confer the Chartered Accountant of Singapore [CA (Singapore)] designation.

ISCA supports over 46,000 members across industries in Singapore and globally, with members in more than 40 countries. With a growing international presence, ISCA has 12 overseas chapters, 7 offices across 10 countries and a network of over 150 strategic partners, strengthening professional connections and opportunities across borders. ISCA is also a member of Chartered Accountants Worldwide, a global network representing more than 1.8 million Chartered Accountants and students across over 190 countries.

ISCA advances professional development and lifelong learning through ISCA Academy, its training arm and drives community impact through ISCA Cares, its charity arm.

For more information, visit .

Empyrion Digital Closes Financing for TW1 Data Centre in Taiwan


TAIPEI, TAIWAN & SINGAPORE – Media OutReach Newswire – 25 August 2026 – Empyrion Digital has closed a significant financial package for TW1, its 7MW data centre in Neihu, Taipei, with E.Sun Bank.

The financing is a key milestone for TW1 Empyrion Digital’s strategy of developing high-quality digital infrastructure across Asia’s key markets.

Located in Neihu, Taipei, TW1 is a carrier-neutral colocation facility designed to meet Taiwan’s growing demand for reliable, scalable and well-connected digital infrastructure. The facility will offer colocation solutions to enterprise, cloud and digital infrastructure customers with the capacity and connectivity to support AI deployment alongside their evolving compute needs.

Teruo Iwamoto, Chief Financial Officer of Empyrion Digital, said:

“Closing this financing is another important step in our growth in Taiwan. It reflects the strong fundamentals of TW1 and our financing partner’s confidence in the project and Taiwan’s broader digital infrastructure market. We thank E.Sun Bank, our advisers and all our partners for their support throughout the financing process.”

E.Sun Bank, said:

E.Sun Bank is pleased to support Empyrion Digital in the financing of TW1. As AI, cloud computing and digital services continue to grow, resilient and high-quality digital infrastructure is becoming increasingly important to Taiwan’s digital economy. E.Sun Bank is committed to leveraging its financial expertise to support quality infrastructure projects with long-term development potential. We look forward to building a strong partnership with Empyrion Digital as TW1 progresses.”

The financing underpins the continued development of TW1 as Empyrion Digital advances its data centre portfolio across Asia. The company remains focused on delivering strategically located, high-quality colocation infrastructure to meet the region’s growing demand for AI, cloud, connectivity and data-intensive applications.

Empyrion Digital thanks E.Sun Bank, its advisers and the wider project team for their contributions to the successful completion of this financing.

Hashtag: #EmpyrionDigital


The issuer is solely responsible for the content of this announcement.

About Empyrion Digital

Empyrion Digital is a next-generation digital infrastructure platform committed to sustainable practices and operational excellence. Green-by-design, we develop and operate scalable, carrier-neutral AI-capable data centres for hyperscale and enterprise customers across Asia.

Headquartered in Singapore, Empyrion Digital is a portfolio company of Seraya Partners, a leading Asia infrastructure fund with USD 2.7 billion of assets under management.

For more information, visit www.empyriondigital.com.

Gorilla Technology H1 Revenue Surges 99% to US$78.4 Million; Raises FY2026 Revenue Outlook to at Least US$200 Million

London, United Kingdom – Newsfile Corp. – August 24, 2026 – Gorilla Technology Group Inc. (NASDAQ: GRRR) (“Gorilla” or the “Company”), a global solution provider in Security Intelligence, Network Intelligence, Business Intelligence, IoT technology and data centres, today announced its unaudited financial results for the six months ended June 30, 2026.

Gorilla delivered a significant acceleration in revenue and a marked sequential improvement in reported operating performance during the second quarter. The outperformance was principally driven by earlier-than-anticipated delivery across multiple contracted customer programmes, enabling the Company to recognize the associated revenue ahead of its original expectations. This was complemented by continued execution across Gorilla’s broader portfolio.

Financial highlights

  • H1 revenue nearly doubled: Revenue increased 99.3% to approximately US$78.4 million, compared with US$39.3 million in H1 2025. Growth was driven by the scaling of Gorilla’s AI infrastructure and data-centre programmes, alongside continued delivery across its security intelligence, network intelligence and smart-city operations, including Egypt, Taiwan and Thailand.
  • Reported and adjusted operating performance: Gorilla reported an IFRS operating loss of approximately US$47.2 million for H1 2026, compared with US$9.1 million in H1 2025. The 2026 results included approximately US$25.4 million of stock-based compensation expense, US$4.0 million of downward fair-value measurement effects, US$2.0 million of debt-transaction costs and US$0.3 million of acquisition-related expenses. Adjusted EBITDA was a loss of approximately US$14.6 million, compared with adjusted EBITDA of approximately US$6.2 million in H1 2025.
  • Reported and adjusted net result: Gorilla reported an IFRS net loss of approximately US$46.9 million for H1 2026, compared with US$8.5 million in H1 2025. Adjusted net loss was approximately US$15.6 million, or US$0.58 per share, compared with adjusted net income of approximately US$6.3 million, or US$0.32 per share, in H1 2025.
  • Operating cash efficiency improved year on year: Net cash used in operating activities declined by approximately US$8.2 million, or 65.3%, from US$12.5 million in H1 2025 to US$4.3 million in H1 2026.
  • Cash position strengthened: Cash increased by approximately US$79.8 million during H1, driven principally by financing inflows and supported by customer collections. Gorilla closed the period with approximately US$179.4 million in cash.
  • Infrastructure investment accelerated: Gorilla deployed approximately US$14.1 million during H1 for the acquisition of property and equipment, including capital advances and project work-in-progress. Property and equipment, including capital work-in-progress, reached approximately US$29.4 million at June 30, 2026.

Comparative financial performance

Financial measure H1 2026 H1 2025
Operating loss (IFRS) US$(47.2)m US$(9.1)m
EBITDA loss (non-IFRS) US$(46.4)m US$(8.4)m
Adjusted EBITDA (non-IFRS) US$(14.6)m US$6.2m
Net loss (IFRS) US$(46.9)m US$(8.5)m
Adjusted net income (loss) (non-IFRS) US$(15.6)m US$6.3m
Diluted loss per share (IFRS) US$(1.74) US$(0.43)
Adjusted diluted earnings (loss) per share (non-IFRS) US$(0.58) US$0.30

Statement from Jay Chandan, Chairman and Chief Executive Officer

“This is the clearest evidence yet that Gorilla has entered a different phase of scale,” said Jay Chandan, Chairman & CEO.

“In one year we managed to nearly double our first half revenue to US$78.4 million. Our second quarter revenue increased 78% sequentially and 138% year-on-year to US$50.1 million, while our reported operating loss narrowed by approximately 85% compared with Q1.

The progression matters. In the first half, we absorbed a significant share-based compensation charge largely tied to services rendered prior to 2025 and other significant accounting effects. With their removal during the first half of 2026, we are poised for an improvement in operating results.

We are now converting years of preparation into delivery at scale. We are investing in hardware, infrastructure, people and execution capacity because we see a substantial opportunity ahead of us. Infrastructure cannot be switched on like a tap. Equipment must be procured, installed, commissioned and integrated. Customers must migrate workloads and utilisation must then progress toward steady-state levels.

That investment is happening now. During H1, Gorilla deployed approximately US$14.1 million for the acquisition of property and equipment, while property and equipment, including capital work-in-progress, reached approximately US$29.4 million at June 30, 2026. We are building the capacity and delivery platform required to support a much larger business. Our priorities for the remainder of 2026 are unambiguous: bring more capacity into service, increase utilisation, expand the workloads we deliver for existing customers and convert additional demand into revenue. We are on track to meet previously announced delivery timelines. The objective is not simply to deploy hardware. It is to build long-term customer relationships around infrastructure, compute and associated services.”

Statement from Bruce Bower, Chief Financial Officer

“The first-half results demonstrate both the scale of Gorilla’s investment and the improvement in cash efficiency,” said Bruce Bower, Chief Financial Officer.

“On an IFRS basis, Gorilla reported an operating loss of approximately US$47.2 million and a net loss of approximately US$46.9 million. Adjusted EBITDA was a loss of approximately US$14.6 million, and adjusted net loss was approximately US$15.6 million. The reconciliation included below provides investors with the individual adjustments and their respective treatment.”

“H1 revenue increased 99.3%, while net cash used in operating activities declined by approximately US$8.2 million, or 65.3%, to US$4.3 million. Put simply, we nearly doubled revenue while reducing operating cash usage from 31.8% to 5.5% of revenue.”

“This improvement was achieved while Gorilla deployed approximately US$14.1 million during H1 for the acquisition of property and equipment. Cash deployment may increase as we fund equipment purchases, project-related deposits, construction and commissioning activities. These expenditures represent the planned conversion of liquidity into productive infrastructure and delivery capacity intended to support future revenue-not a weakening of our underlying operating discipline.”

“The Company recorded an overall increase in cash of approximately US$79.8 million during H1, driven principally by financing inflows and supported by customer collections. We closed the period with approximately US$179.4 million in cash. As this liquidity is deployed, our cash balance may fluctuate as we fund existing projects and build the capacity required to support future revenue.”

“We are investing ahead of the revenue and utilisation curve, but we are doing so from a position of substantial liquidity. Our priorities remain disciplined capital allocation, project execution, improved utilisation and the conversion of infrastructure investment into sustainable revenue and cash flow.”

Infrastructure investment and the path to steady state

Gorilla’s current financial profile reflects the deliberate acceleration of its AI infrastructure strategy.

Infrastructure projects require capital to be deployed before their full revenue and margin potential can be realized. Hardware procurement is followed by installation, commissioning, integration, customer onboarding, workload migration and utilisation growth. Consequently, expenditure and accounting recognition may precede steady-state revenue generation.

The Company’s priorities for the second half of 2026 are to:

  • Bring additional infrastructure capacity into service.
  • Increase utilisation across existing deployments.
  • Expand the range of workloads delivered for existing customers.
  • Onboard new customers and convert additional demand.
  • Develop a broader revenue mix across infrastructure, compute and associated services.
  • Maintain disciplined capital allocation and liquidity management while investing for growth.

Financial Outlook

Gorilla is increasing its Q3 2026 revenue planning range to approximately US$48 million to US$50 million, compared with its previous planning range of US$36 million to US$40 million. Gorilla now expects revenue for the 2026 fiscal year of at least US$200 million, raising the minimum from its previously announced range of US$160 million to US$200 million.

2027 guidance

Gorilla is targeting a revenue range of US$450 to US$500 million in 2027, with substantial gross margin improvement.

This objective is supported by the infrastructure being installed in connection with previously disclosed projects, the opportunity to increase utilisation, the potential to expand existing customer relationships and Gorilla’s pipeline of additional demand. The objective remains subject to execution, customer demand, deployment schedules and prevailing market conditions.

Financials

Gorilla Technology Group Inc. and Subsidiaries
Condensed Interim Consolidated Balance Sheets
(Expressed in United States dollars)

As of
June 30, 2026 December 31, 2025
Items (Unaudited and Unreviewed)
Assets
Current assets
Cash and cash equivalents $ 179,361,146 $ 99,532,115
Restricted deposits 45,933 5,298,442
Accounts receivable, net and contract assets 145,301,296 111,994,621
Other current assets 20,045,479 17,221,988
Total current assets 344,753,854 234,047,166
Non-current assets
Property and equipment, net 29,441,217 15,749,411
Right-of-use assets 1,055,377 1,091,526
Goodwill and other intangible assets 3,360,361 2,432,278
Deferred tax assets, net 5,201,078 11,938,173
Other non-current assets 6,072,360 6,624,980
Total non-current assets 45,130,393 37,836,368
Total assets $ 389,884,247 $ 271,883,534
Liabilities and Equity
Liabilities
Current liabilities
Borrowings $ 10,221,241 $ 10,391,379
Derivative liability 48,200,000 –
Accounts and other payables 91,708,655 46,042,759
Contract liabilities 1,523,600 1,305,644
Income tax liabilities 1,378,280 11,588,564
Other current liabilities 899,764 951,094
Total current liabilities 153,931,540 70,279,440
Non-current liabilities
Long-term borrowings 63,025,823 3,404,363
Deferred tax liabilities 827,315 652,782
Other non-current liabilities 1,246,054 1,467,110
Total non-current liabilities 65,099,192 5,524,255
Total liabilities 219,030,732 75,803,695
Equity
Share capital 27,664 26,356
Treasury shares at cost (5,285,347) (2,105,274)
Other equity 176,111,198 198,158,757
Total equity 170,853,515 196,079,839
Total liabilities and equity $ 389,884,247 $ 271,883,534

Gorilla Technology Group Inc. and Subsidiaries
Condensed Interim Consolidated Statements of Comprehensive Loss
(Expressed in United States dollars)

Six Months Ended June 30,
2026 2025
Items (Unaudited and Unreviewed)
Revenues $ 78,361,225 $ 39,325,839
Cost of revenues (74,516,947) (25,877,004)
Gross profit 3,844,278 13,448,835
Operating expenses:
Foreign currency exchange losses, net (2,594,853) (11,552,001)
Stock-based compensation expenses (25,426,746) (472,642)
Other operating expenses (23,003,400) (10,494,639)
Total operating expenses (51,024,999) (22,519,282)
Operating loss (47,180,721) (9,070,447)
Net loss (46,893,714) (8,503,060)
Other comprehensive income (loss), net of tax (748,898) 1,057,235
Total comprehensive loss $ (47,642,612) $ (7,445,825)
Basic and diluted loss per share $ (1.74) $ (0.43)

Gorilla Technology Group Inc. and Subsidiaries
Condensed Interim Consolidated Statements of Cash Flows
(Expressed in United States dollars)

Six Months Ended June 30,
2026 2025
(Unaudited and Unreviewed)
Net cash used in operating activities $ (4,339,769) $ (12,518,511)
Net cash used in investing activities (12,675,421) (4,852,819)
Net cash flows from financing activities 98,511,610 5,334,134
Effect of foreign exchange rate changes on cash and cash equivalents (1,667,389) 448,200
Net increase (decrease) in cash and cash equivalents $ 79,829,031 $ (11,588,996)
Cash and cash equivalents at beginning of the period 99,532,115 21,699,202
Cash and cash equivalents at end of the period $ 179,361,146 $ 10,110,206

Reconciliation of non-IFRS Financial Measures to IFRS Measures

In addition to its reported results in accordance with International Financial Reporting Standards (“IFRS”) followed by the Company, it has included in this release certain financial measures that are considered non-IFRS financial measures, including the following:

(i) Earnings before interest, taxes, depreciation, and amortization (“EBITDA”);
(ii) Adjusted EBITDA; and
(iii) Adjusted net income (loss) and adjusted earnings (loss) per share.

Reconciliation of Operating Loss to EBITDA and Adjusted EBITDA

Six Months Ended June 30,
2026 2025
(Unaudited and Unreviewed)
Items (Amount in USD)
Operating loss (IFRS) $ (47,180,721) $ (9,070,447)
Add: Depreciation expenses 588,726 325,824
Add: Amortization expenses 181,200 317,806
EBITDA loss (non-IFRS) $ (46,410,795) $ (8,426,817)
Add: Foreign currency devaluation (1) – 12,630,726
Add: Fair value measurement of financial instruments, net (2) 4,002,918 1,531,210
Add: Stock-based compensation expenses 25,426,746 472,642
Add: Acquisition-related expenses (3) 340,000 –
Add: Debt transaction costs (4) 2,044,673 –
Adjusted EBITDA (non-IFRS) $ (14,596,458) $ 6,207,761

Reconciliation of Net Loss and Loss per Share to Adjusted Net Income (Loss) and Adjusted Earnings (Loss) per Share

Six Months Ended June 30,
2026 2025
(Unaudited and Unreviewed)
(Amount in USD)
Items Amount Per share Amount Per share
Net loss (IFRS) $ (46,893,714) $ (1.74) $ (8,503,060) $ (0.43)
Add: Foreign currency devaluation (1) – – 12,630,726 0.64
Add: Fair value measurement of financial instruments, net (2) 4,002,918 0.15 1,531,210 0.08
Add: Stock-based compensation expenses 25,426,746 0.94 472,642 0.02
Less: Tax effects of stock-based compensation expenses (727,217) (0.03) (21,145) –
Add: Acquisition-related expenses (3) 340,000 0.01 – –
Add: Debt transaction costs (4) 2,044,673 0.08 – –
Add: Amortization of acquired intangible assets (5) 171,000 0.01 171,000 0.01
Adjusted net income (loss) (non-IFRS) $ (15,635,594) $ (0.58) $ 6,281,373 $ 0.32
Adjusted diluted earnings (loss) per share (non-IFRS) $ (0.58) $ 0.30

Notes:

  1. Foreign currency devaluation – effects of material depreciation of the Egyptian pound against the U.S. dollar.
  2. Fair value measurement of financial instruments – includes effects of fair value measurement of stock warrants and derivative liabilities.
  3. Acquisition-related expenses – includes expenses incurred for acquisition of Shackleton Finance Limited in June 2026.
  4. Debt transaction costs – includes the portion allocated to derivative liabilities for one-time issuance costs incurred in connection with the convertible notes.
  5. Amortization of acquired intangible assets – includes non-cash amortization expense related to acquired intangible assets.


About Gorilla Technology Group Inc.

Headquartered in London U.K., Gorilla is a global solution provider in Security Intelligence, Network Intelligence, Business Intelligence, IoT technology and data centers. We provide a wide range of solutions, including Smart City, Network, Video, Security Convergence and IoT, across select verticals of Government and Public Services, Manufacturing, Telecom, Retail, Transportation and Logistics, Healthcare and Education, by using AI and Deep Learning Technologies.

Our expertise lies in revolutionizing urban operations, bolstering security and enhancing resilience. We deliver pioneering products that harness the power of AI in intelligent video surveillance, facial recognition, license plate recognition, edge computing, post-event analytics and advanced cybersecurity technologies. By integrating these AI-driven technologies, we empower Smart Cities to enhance efficiency, safety and cybersecurity measures, ultimately improving the quality of life for residents.

For more information, please visit our website: Gorilla-Technology.com.

Forward-Looking Statements
This press release contains “forward-looking statements” within the meaning of the “safe harbor” provisions of the Private Securities Litigation Reform Act of 1995. Gorilla’s actual results may differ from its expectations, estimates and projections and consequently, you should not rely on these forward-looking statements as predictions of future events. Words such as “expect,” “estimate,” “project,” “budget,” “forecast,” “anticipate,” “intend,” “plan,” “may,” “will,” “could,” “should,” “believes,” “predicts,” “potential,” “might” and “continues,” and similar expressions are intended to identify such forward-looking statements. These forward-looking statements include, without limitation, statements regarding our beliefs about the expected timing and amount of revenues that may be recognized under our existing contracts during the second half of 2026 and during 2027, our ability to sign new contracts and execute existing contracts, equipment deployment schedules and overall market conditions, along with those other risks described under the heading “Risk Factors” in the Form 20-F Gorilla filed with the Securities and Exchange Commission (the “SEC”) on April 15, 2026 and those that are included in any of Gorilla’s future filings with the SEC. These forward-looking statements involve significant risks and uncertainties that could cause actual results to differ materially from expected results. Most of these factors are outside of the control of Gorilla and are difficult to predict. Should one or more of these risks or uncertainties materialize, or should underlying assumptions prove incorrect, actual results may vary materially from those indicated or anticipated by such forward-looking statements. Readers are cautioned not to place undue reliance upon any forward-looking statements, which speak only as of the date made. Gorilla undertakes no obligation to update forward-looking statements to reflect events or circumstances after the date they were made except as required by law or applicable regulation.

Investor Relations Contact
Dave Gentry
RedChip Companies, Inc.
1-407-644-4256
GRRR@redchip.com

The issuer is solely responsible for the content of this announcement.

SCX.ai (ASX: SCX) Strategic Partnership With Global AI Leader DDN to Power Australia’s Largest Sovereign AI Inferencing Cloud

Alliance to scale sovereign AI capacity as demand for Australian-based AI infrastructure grows

SYDNEY, Aug. 25, 2026 /PRNewswire/ — Australian sovereign AI infrastructure pioneer SCX.ai and global AI data intelligence leader DDN today announced a landmark partnership to expand and accelerate Australia’s largest sovereign AI inferencing cloud.

The partnership brings together SCX’s ASIC-accelerated infrastructure with DDN’s Infinia data intelligence platform. The combined solution provides Australian enterprises, government agencies and research institutions with a secure, high-performance, multi-tenant AI factory designed to accelerate inference and lower the cost per token, while ensuring models, workloads and data remain strictly within Australia.

The announcement follows SCX.ai’s debut on the Australian Securities Exchange on 21 August, following a fully underwritten $40 million IPO, making it Australia’s first ASX-listed pure-play sovereign AI inference infrastructure company.

SCX.ai enters the public market with growing commercial momentum. Contracted annual recurring revenue reached $6.5 million at the end of July, up 20.9% since May. The platform now has more than 400 active users.

Building on the successful launch of SCX’s first sovereign AI node at the Equinix SY5 data centre in Sydney, the integration of DDN Infinia ensures the underlying data layer can keep pace with massive concurrency and high-throughput inferencing demands.

By delivering sub-millisecond latency and up to 27x faster KV cache loading, Infinia eliminates I/O stalls and maximises hardware utilisation – enabling organisations to run large context windows and agentic AI workloads swiftly, without compromising on speed, data privacy or regulatory compliance.

“For the first time, Australian organisations have access to a fully domestic, enterprise-grade AI cloud that scales effortlessly,” said SCX founder and CEO David Keane. “By integrating DDN’s world-class data platforms into our architecture, we are ensuring that our infrastructure can handle the most data-intensive workloads on the planet. This partnership supercharges our mission to deliver advanced AI entirely onshore, without compromising speed, security or sovereignty.”

The joint infrastructure also addresses one of the major challenges confronting the rapid global expansion of AI: the power and cooling required to support growing compute demand.

SCX.ai’s infrastructure uses purpose-built SambaNova AI processors and is designed to generate significantly more AI compute from the power and physical footprint available inside existing commercial data centres. The architecture uses air cooling, avoiding the large volumes of water required by many conventional AI data centre cooling systems.

Testing disclosed by SCX.ai ahead of its ASX listing showed its SambaNova-based infrastructure delivering approximately 2.5x to 5.6x the performance per watt of GPU-based systems across selected stable inference workloads, depending on the model and hardware configuration tested.

“Sovereign AI isn’t just about where data resides, it’s about whether a nation can operate AI at scale, efficiently and without compromise,” said DDN CTO Sven Oehme. “Our partnership with SCX brings together purpose-built inferencing infrastructure with DDN’s Infinia data platform to remove the single biggest barrier to AI performance: the data layer. By eliminating I/O bottlenecks and enabling extreme concurrency with sub-millisecond latency, we’re fundamentally changing the economics of inference – delivering higher utilisation, lower cost per token and true enterprise-grade sovereignty. This is how countries turn AI ambition into real, operational capability.”

The expanded cloud capacity will support the deployment of bespoke enterprise workloads, as well as SCX.ai’s Project MAGPiE, a sovereign large language model specifically fine-tuned for the Australian cultural and commercial context.

SCX.ai’s first node at Equinix SY5 in Sydney is operational, with the company now accelerating deployment of Node 2, targeted to be operational by the end of 2026. SCX.ai is also progressing plans for additional nodes as it builds out a national sovereign AI inference network.

Asset Bank for Media
https://drive.google.com/drive/folders/158tijQGvY4a8MveE98JL8ngqBubXeoeC?usp=sharing

About SCX.ai

SCX.ai is Australia’s leading provider of sovereign AI infrastructure, delivering high-performance, energy-efficient cloud solutions fully aligned with strict domestic data security and privacy requirements. Through its national network of advanced inferencing nodes, SCX enables government and enterprise clients to operate cutting-edge AI under complete domestic control.

Follow SCX: LinkedIn, X, and YouTube  

About DDN

DDN is a leading AI and data intelligence company, powering demanding AI workloads by keeping GPUs fed, efficient and productive at scale – so organisations can train, checkpoint and infer faster with less footprint and power. DDN delivers data intelligence at exabyte scale across hundreds of thousands of GPUs for hyperscalers, next-gen cloud builders, enterprises, governments and research institutions.

Follow DDN: LinkedIn, X, and YouTube 

Sogang University Opens a Full-Tuition Path for International STEM Graduate Students in Seoul

A state- and city-backed track pairs the Seoul ANCHOR Project with the university’s own global scholarship, waiving 100 percent of tuition for selected students in the natural sciences and engineering — and adding research, internship and Korean-language support on top.

SEOUL, South Korea, Aug. 25, 2026 /PRNewswire/ — For a prospective graduate student weighing a move to Korea, the arithmetic usually begins with tuition. Sogang University Graduate School is betting that removing that line from the calculation — entirely, for a defined group of international students in science and engineering — will change who applies, and who stays.


Through the SOGANG RISE SURPASS TRACK, eligible international students admitted to the natural sciences and engineering fields of the General Graduate School can receive a 50 percent tuition scholarship funded through the Seoul ANCHOR Project and a further 50 percent through the Sogang Global Scholarship. Stacked, the two awards amount to a full tuition waiver. Admission fees and other applicable mandatory fees are not included.

The track sits within Subproject 1-2, “Attracting International Talent for Advanced Future Industries,” under the Seoul ANCHOR Project, an initiative supported by the Ministry of Education and the Seoul Metropolitan Government.

Beyond the tuition line

The program is described as more than a discount. Alongside the waiver, the SOGANG RISE SURPASS TRACK may provide academic support grants, research-publication incentives, Korean-language proficiency enhancement grants, internship support and other assistance tied to academic and career development.

The intent, according to the university, is to let international students concentrate on graduate-level study and research while building familiarity with Korea’s academic, research and industry environments — the practical fluency that often determines whether a foreign graduate can convert a Korean degree into a Korean career.

A research university with a stated purpose

Sogang University Graduate School operates under the motto “Obedire Veritati” — “Be Obedient to the Truth” — and locates its research-oriented academic environment in the heart of Seoul. Its Jesuit educational tradition emphasizes rigorous scholarship, critical inquiry and the pursuit of knowledge, and its graduate programs are framed around developing researchers, professionals, innovators and global leaders.

The graduate school offers master’s and doctoral programs across 39 departments spanning the humanities, social sciences, natural sciences, engineering and interdisciplinary fields, with close faculty mentorship a recurring feature of how the university describes graduate study there.

Its academic reach extends past its own campus. Sogang maintains exchange and cross-registration arrangements with other universities in Seoul — an arrangement that lets students broaden coursework and research connections across several of the capital’s major institutions.

The community a student would join

More than 2,000 students are currently enrolled in the graduate school, among them approximately 250 international students from a range of academic and cultural backgrounds. The university points to that community as a working environment for academic exchange and collaboration both inside and outside the classroom.

The alumni base is considerably larger. Sogang has awarded graduate degrees to approximately 14,670 master’s degree holders and 2,400 doctoral degree holders.

How admission works

Applicants to master’s programs are generally required to hold a bachelor’s degree; applicants to doctoral programs are generally required to hold both bachelor’s and master’s degrees. Depending on the department, applicants may need to submit Korean-language proficiency scores such as TOPIK, or English-language proficiency scores including IELTS or TOEFL. Language-test exemptions may be available under certain conditions.

Language proficiency also carries financial weight independent of the STEM track. Students who meet the relevant TOPIK or English-language test requirements — including IELTS, TOEFL iBT and NEW TEPS — may be eligible for the Sogang Global Scholarship, which covers 30 percent to 80 percent of tuition depending on language proficiency scores and scholarship tier.

Looking ahead

For international students and families considering graduate study in Korea, the offer is a specific one: advanced academic and research work in Seoul, supported by faculty mentorship, cross-university academic connections and a range of scholarship options — and, for a defined group in the sciences and engineering, no tuition bill at the end of it.

Detailed information on admissions requirements, scholarship eligibility and application procedures is available through the official guidelines of Sogang University Graduate School.

Graduate School of Sogang University
gradsch@sogang.ac.kr 

Rewarding Meetings Begin At Hyatt Regency Kuala Lumpur At KL Midtown

KUALA LUMPUR, Malaysia, Aug. 25, 2026 /PRNewswire/ — As Kuala Lumpur continues to welcome major international exhibitions, conventions and corporate events, Hyatt Regency Kuala Lumpur at KL Midtown is inviting meeting planners to unlock greater value through Hyatt’s #BeMoreRewarded campaign and the hotel’s exclusive Enjoy Extra Perks offer.

Perfectly positioned in vibrant Mont Kiara, Dutamas and KL Midtown, just a short walk from the Malaysia International Trade and Exhibition Centre (MITEC), the hotel pairs one of the city’s most strategic business addresses with versatile event spaces, destination dining and Hyatt’s signature hospitality—offering a sophisticated setting for meetings, incentives, conferences and celebrations.

IN THE HEART OF KUALA LUMPUR’S PREMIER BUSINESS DISTRICT

For organisers and delegates attending international exhibitions and conventions, location can make all the difference. Positioned opposite to MITEC, Malaysia’s largest trade and exhibition venue, Hyatt Regency Kuala Lumpur at KL Midtown places guests just moments from the country’s most significant business events while offering seamless access to Kuala Lumpur’s commercial districts, government offices and lifestyle attractions.

From Left to Right : The hotel located next to MITEC and The Regency Ballroom

Whether planning an international conference, executive meeting, product launch or incentive programme, the hotel offers a sophisticated urban retreat where convenience meets comfort. Complementing its prime location is a versatile collection of meeting and event venues, supported by experienced event specialists and modern technology to ensure every gathering is executed with precision and care.

CURATED EXPERIENCES BEYOND THE MEETING ROOM

Exceptional events are often remembered for the experiences shared beyond the meeting room. Hyatt Regency Kuala Lumpur at KL Midtown offers a collection of distinctive venues that can be tailored to suit the style, purpose and scale of every gathering.

Meeting planners can welcome delegates with a tropical cocktail reception at the hotel’s 32nd-floor infinity pool, where sweeping views of Kuala Lumpur’s skyline provide an impressive backdrop for guests to connect before the official programme begins.

Beyond its meeting spaces, the hotel also features versatile venues for dining, drinks, celebrations and exclusive events. ENSŌ Izakaya & Bar can be adapted to suit a variety of event concepts, from networking receptions and incentive dinners to post-conference celebrations. The venue pairs contemporary Japanese cuisine with curated entertainment and optional live DJ performances, creating engaging social experiences tailored to each occasion.

For gatherings that call for a more refined atmosphere, China House serves authentic Chinese cuisine in elegant surroundings, providing the perfect backdrop for executive dining, client entertainment, private celebrations and VIP gatherings.

Together, these thoughtfully curated venues give organisers the flexibility to personalise every event, while reflecting Hyatt Regency Kuala Lumpur at KL Midtown’s commitment to genuine hospitality and memorable guest experiences.

Be More Rewarded | Together by Hyatt

As part of Hyatt’s Together by Hyatt philosophy, Hyatt Regency Kuala Lumpur at KL Midtown continues to create meaningful meetings, incentives, conferences and celebrations through exceptional experiences and rewarding value.

As a participating property in the Asia Pacific Groups, Meetings & Events Offer 2026, Hyatt Regency Kuala Lumpur at KL Midtown invites planners to enjoy up to four rewards based on contracted revenue, including rebates, suite upgrades, complimentary meeting rooms, WIFI, AV discounts, wellbeing experiences and bonus World of Hyatt points.  Book and contract your qualifying event by 31 December 2026 for events held on or before 31 March 2027, and simply quote offer code ASPACME26 in your initial enquiry to unlock these exclusive benefits.

To make every event even more rewarding, Hyatt Regency Kuala Lumpur at KL Midtown is also offering its exclusive Enjoy Extra Perks promotion. Meeting planners who book their qualifying event by 31 October 2026 for groups held on or before 20 December 2026 will receive one additional benefit on top of the regional campaign when planners quote REVREBATE in their initial enquiry.

Whether attending an international exhibition at MITEC, organising an international conference or hosting an executive gathering, Hyatt Regency Kuala Lumpur at KL Midtown offers the ideal combination of strategic location, elevated culinary experiences and rewarding meeting benefits for unforgettable events.

For more information or to enquire about meetings and events, visit www.hyattregencykualalumpur.com

About Hyatt Regency Kuala Lumpur at KL Midtown

Nestled at 7 Jalan Dutamas 2 within the dynamic KL Midtown district, Hyatt Regency Kuala Lumpur at KL Midtown enjoys an enviable location in the vibrant heart of Dutamas and Mont Kiara. Designed by world-renowned Japanese architect Kengo Kuma, the hotel embodies a harmonious fusion of nature, Malaysian artistry, and contemporary sophistication.

The property offers a total of 406 accommodations, comprising 306 well-appointed guestrooms and suites, together with 100 fully serviced residences—seamlessly catering to both short-term visitors and extended-stay guests. For events and meetings, the hotel features 16 flexible function rooms equipped with state-of-the-art facilities, including a spectacular pillarless ballroom and meeting spaces spanning three floors. The banquet facilities are also halal-certified.  Dining options at the hotel include ENSŌ Izakaya & Bar, China House, Midtown Brasserie, and Midtown Lounge. For more information, please visit www.hyattregencyklmidtown.com.

About Hyatt Regency

The Hyatt Regency brand is a global collection of hotels and resorts found in more than 245 locations in over 50 countries around the world. The depth and breadth of this diverse portfolio, from expansive resorts to urban city centers, is a testament to the brand’s evolutionary spirit. For more than 50 years, the Hyatt Regency brand has championed fresh perspectives and enriching experiences, while its forward-thinking philosophy provides guests with inviting spaces that bring people together and foster a spirit of community.  As a hospitality original, Hyatt Regency hotels and resorts are founded on openness—our colleagues consistently serve with open minds and open hearts to deliver unforgettable celebrations, effortless relaxation and notable culinary experiences alongside expert meetings and technology-enabled collaboration. The brand prides itself on an everlasting reputation for insightful care—one that welcomes all people across all countries and cultures, generation after generation. For more information, please visit www.hyattregency.com. Follow @HyattRegency on Facebook and Instagram, and tag photos with #HyattRegency.

Tuya Reports Second Quarter 2026 Unaudited Financial Results

SANTA CLARA, Calif., Aug. 25, 2026 /PRNewswire/ — Tuya Inc. (“Tuya” or the “Company”) (NYSE: TUYA; HKEX: 2391), a global leading AI cloud platform service provider, today announced its unaudited financial results for the second quarter ended June 30, 2026.

Second Quarter 2026 Financial Highlights
  • Total revenue was US$92.9 million, up approximately 16.0% year-over-year (2Q2025: US$80.1 million).
  • Platform-as-a-service (“PaaS“) revenue was US$67.9 million, up approximately 16.9% year-over-year (2Q2025: US$58.1 million).
  • AI application & others revenue was US$11.5 million, up approximately 3.9% year-over-year (2Q2025: US$11.1 million).
  • Smart home & robot product revenue was US$13.5 million, up approximately 23.2% year-over-year (2Q2025: US$10.9 million).
  • Overall gross margin was 46.3%, down 2.1 percentage points year-over-year (2Q2025: 48.4%). Gross margin of PaaS was 46.8% (2Q2025: 48.7%).
  • Operating margin was 10.0%, up 8.6 percentage points year-over-year (2Q2025: 1.4%). Non-GAAP operating margin was 10.3% (2Q2025: 10.7%). 
  • Net margin was 20.1%, improved by 4.4 percentage points year-over-year (2Q2025: 15.7%). Non-GAAP net margin was 20.4% (2Q2025: 25.1%).
  • Net profits were US$18.6 million (2Q2025: US$12.6 million). Non-GAAP net profits were US$18.9 million (2Q2025: US$20.1 million).
  • Net cash generated from operating activities was US$6.2 million (2Q2025: US$18.2 million).
  • Total cash and cash equivalents, time deposits and treasury securities recorded as short-term and long-term investments were US$976.1 million as of June 30, 2026, compared to US$1,017.3 million as of December 31, 2025.

For further information on the non-GAAP financial measures presented above, see the section headed “Use of Non-GAAP Financial Measures.”

Second Quarter 2026 Operating Highlights
  • Premium PaaS customers[1] for the trailing 12 months ended June 30, 2026 were 318 (2Q2025: 285). In the second quarter of 2026, the Company’s premium PaaS customers contributed approximately 89.5% of its PaaS revenue (2Q2025: approximately 88.6%).
  • Registered AI developers were over 2,092,000 as of June 30, 2026, up 16.2% from approximately 1,801,000 developers as of December 31, 2025.
  1. The Company defines a premium PaaS customer as a customer as of a given date that contributed more than US$100,000 of PaaS revenue during the immediately preceding 12-month period.

Mr. Xueji (Jerry) Wang, Founder and Chief Executive Officer of Tuya, commented, “In the second quarter, despite a complex global operating environment, the Company continued to demonstrate solid growth momentum. Total revenue increased by 16.0% year over year to US$92.9 million, with PaaS revenue increasing by 16.9% and remaining the Company’s primary growth driver. This performance reflected resilient demand across selected home appliance categories and increasing adoption of differentiated, AI-enabled products and solutions.

Strategically, we continued to advance the productization and real-world deployment of AI. Shipments of our AI-powered companion product solutions continued to expand, while the launch of Tuya Cobuilder further lowered the barriers to AI hardware development by helping developers move more efficiently from product concept to physical-device deployment. Looking ahead, we will remain focused on AI-native application innovation, AI developer platform development and the global expansion of validated solutions.”

Mr. Yi (Alex) Yang, Director and Chief Financial Officer of Tuya, added, “In the second quarter, total revenue reached US$92.9 million, up 16.0% year over year. PaaS revenue was US$67.9 million, up 16.9%, while Smart home & robot product revenue increased by 23.2% to US$13.5 million and AI application & others revenue increased by 3.9% to US$11.5 million.

Despite pressure from product and solution mix and semiconductor supply-chain pricing, gross profit increased by 11.1% year over year to US$43.0 million. Non-GAAP profit from operations increased by 11.7% to US$9.6 million, with non-GAAP operating margin remaining in double digits at 10.3%. We ended the quarter with approximately US$976.1 million in cash and cash equivalents, time deposits and treasury securities, providing continued flexibility to support our AI capabilities, global expansion and long-term strategic investments.”

Second Quarter 2026 Unaudited Financial Results

REVENUE

Total revenue in the second quarter of 2026 increased by 16.0% to US$92.9 million from US$80.1 million in the same period of 2025.

  • PaaS revenue in the second quarter of 2026 increased by 16.9% to US$67.9 million from US$58.1 million in the same period of 2025, primarily due to increasing demand compared with the same period of 2025 and the Company’s strategic focus on customer needs and product enhancements, despite the disruptions in the international business environment due to tariff-related headwinds since April 2025. Our core customer base remained stable.
  • AI application & others revenue in the second quarter of 2026 increased by 3.9% to US$11.5 million from US$11.1 million in the same period of 2025, primarily due to an increase in revenue from cloud-based services. During the quarter, the Company remained committed to offering recurring value-added services with AI application functions.
  • Smart home & robot product revenue in the second quarter of 2026 increased by 23.2% to US$13.5 million from US$10.9 million in the same period of 2025, primarily due to growing customer demands.

GROSS PROFIT AND GROSS MARGIN

Total gross profit in the second quarter of 2026 increased by 11.1% to US$43.0 million from US$38.7 million in the same period of 2025. The gross margin in the second quarter of 2026 was 46.3%, compared to 48.4% in the same period of 2025.

  • PaaS gross margin in the second quarter of 2026 was 46.8%, compared to 48.7% in the same period of 2025, partly attributable to recent price fluctuations in the semiconductor supply chain.
  • AI application & others gross margin in the second quarter of 2026 was 72.0%, compared to 72.0% in the same period of 2025.
  • Smart home & robot product gross margin in the second quarter of 2026 was 21.9%, compared to 22.5% in the same period of 2025.

Gross margin fluctuated primarily due to changes in product and solution mix, as well as fluctuations in semiconductor supply-chain pricing. As an AI developer platform with a rich ecosystem of smart devices and applications, the Company remains focused on AI offering with compelling value propositions while maintaining economic efficiency.

OPERATING EXPENSES

Operating expenses decreased by 10.4% to US$33.7 million in the second quarter of 2026 from US$37.7 million in the same period of 2025. Non-GAAP operating expenses increased by 10.9% to US$33.4 million in the second quarter of 2026 from US$30.2 million in the same period of 2025. For further information on the non-GAAP financial measures presented above, see the section headed “Use of Non-GAAP Financial Measures.”

  • Research and development expenses in the second quarter of 2026 were US$23.1 million, up 3.4% from US$22.4 million in the same period of 2025, primarily due to i) higher employee-related cost and outsourced labor cost of US$1.2 million, ii) higher third-party cloud service fees of US$0.3 million, iii) partially offset by lower share-based compensation expenses of US$1.1 million as equity incentive awards granted at higher valuations in previous years have been gradually amortized. Non-GAAP adjusted research and development expenses in the second quarter of 2026 were US$22.8 million, compared to US$20.9 million in the same period of 2025.
  • Sales and marketing expenses in the second quarter of 2026 were US$8.3 million, up 6.4% from US$7.8 million in the same period of 2025, primarily because of i) higher employee-related cost of US$0.5 million, ii) higher marketing expense of US$0.2 million, iii) partially offset by lower share-based compensation expenses of US$0.5 million as equity incentive awards granted at higher valuations in previous years have been gradually amortized. Non-GAAP adjusted sales and marketing expenses in the second quarter of 2026 were US$8.3 million, compared to US$7.2 million in the same period of 2025.
  • General and administrative expenses in the second quarter of 2026 were US$4.7 million, down 49.8% from US$9.4 million in the same period of 2025, primarily due to i) lower share-based compensation expenses of US$5.3 million as equity incentive awards granted at higher valuations in previous years have been gradually amortized, ii) partially offset by higher allowance for credit losses of US$0.3 million. Non-GAAP adjusted general and administrative expenses in the second quarter of 2026 were US$4.9 million, compared to US$3.9 million in the same period of 2025.
  • Other operating income, net in the second quarter of 2026 was US$2.4 million, primarily due to the receipt of software value-added tax refunds.

PROFIT FROM OPERATIONS AND OPERATING MARGIN

Profit from operations in the second quarter of 2026 was US$9.3 million, compared to US$1.1 million in the same period of 2025. The Company had a non-GAAP profit from operations of US$9.6 million in the second quarter of 2026, compared to US$8.6 million in the same period of 2025, demonstrating consistent operating profitability and leverage.

Operating margin in the second quarter of 2026 was 10.0%, up 8.6 percentage points from 1.4% in the same period of 2025. Non-GAAP operating margin in the second quarter of 2026 was 10.3%, down 0.4 percentage points from 10.7% in the same period of 2025.

NET PROFIT AND NET MARGIN

Net profit in the second quarter of 2026 was US$18.6 million, increased by 48.0% from US$12.6 million in the same period of 2025. Non-GAAP net profit in the second quarter of 2026 was US$18.9 million, compared to US$20.1 million in the same period of 2025.

Net margin in the second quarter of 2026 was 20.1%, improved by 4.4 percentage points from 15.7% in the same period of 2025. Non-GAAP net margin in the second quarter of 2026 was 20.4%, compared to 25.1% in the same period of 2025.

BASIC AND DILUTED NET PROFIT PER ADS

Basic and diluted net profit per ADS was US$0.03 in the second quarter of 2026, compared to US$0.02 in the same period of 2025. Each ADS represents one Class A ordinary share.

Non-GAAP basic and diluted net profit per ADS was US$0.03 in the second quarter of 2026, compared to US$0.03 in the same period of 2025.

CASH AND CASH EQUIVALENTS, TIME DEPOSITS AND TREASURY SECURITIES RECORDED AS SHORT-TERM AND LONG-TERM INVESTMENTS

Cash and cash equivalents, time deposits and treasury securities recorded as short-term and long-term investments were US$976.1 million as of June 30, 2026, compared to US$1,017.3 million as of December 31, 2025. The Company believes its current cash position is sufficient to meet its current liquidity and working capital needs.

NET CASH GENERATED FROM OPERATING ACTIVITIES

Net cash generated from operating activities in the second quarter of 2026 was US$6.2 million, compared to US$18.2 million in the same period of 2025. The net cash generated from operating activities for the second quarter of 2026 mainly due to working capital changes in the ordinary course of business.

For further information on non-GAAP financial measures presented above, see the section headed “Use of Non-GAAP Financial Measures.”

Business Outlook

The overall operating environment remains complex, while continuing to show signs of normalization. Participants across the value chain – including manufacturers, brands and channel partners – remain cautious in their planning. At the same time, we have observed more normalized project execution and continued demand recovery across several of our core categories, suggesting that the market is gradually moving from adjustment toward a more stable operating rhythm.

Meanwhile, global AI development is entering a new stage of application-led growth. As AI technologies continue to evolve from foundational capabilities toward real-world deployment, enterprises and consumers are increasingly focused on practical use cases, scalable implementation and scenario-based integration with physical devices. This trend is accelerating the convergence of AI and smart hardware and creating new opportunities for application innovation, product expansion and ecosystem collaboration across a wide range of verticals.

Against this backdrop, Tuya continues to advance its AI-driven strategy by strengthening its AI developer platform, expanding application-level capabilities and supporting broader deployment across diverse smart-device and industry scenarios. The ongoing evolution of AI applications, together with the Company’s platform capabilities, ecosystem strengths and global developer base, will continue to support the creation of diversified, higher-value opportunities over the long term.

In this environment, the Company will continue to maintain disciplined execution while selectively investing in AI-driven applications, platform capabilities and ecosystem development. The Company will continue to iterate and improve its products and services, enhance both software and hardware capabilities, and further support customers and developers in bringing AI-driven applications into practical deployment. At the same time, the Company recognizes that its future trajectory may continue to be influenced by a range of external factors, including shifts in consumer demand, regional economic divergence, inventory dynamics, foreign exchange and interest-rate volatility, tariffs and trade-policy adjustments, and broader geopolitical uncertainties.

Conference Call Information

The Company’s management will hold a conference call at 08:30 P.M. U.S. Eastern Time on Monday, August 24, 2026 (08:30 A.M. Hong Kong Time on Tuesday, August 25, 2026) to discuss the financial results. In advance of the conference call, all participants must use the following links to complete the online registration process. Upon registering, each participant will receive the dial-in information and a unique PIN (personal access code) to join the call as well as an email confirmation with the details.

Participants Online Webcast Registration:
https://edge.media-server.com/mmc/p/x8phnjqd

Participants Call Registration:
https://register-conf.media-server.com/register/BI2992f21177c7423c83ce142eb2ef031c

A live and archived webcast of the conference call will also be available at the Company’s investor relations website at https://ir.tuya.com.

About Tuya Inc.

Tuya Inc. (NYSE: TUYA; HKEX: 2391) is a global leading AI cloud platform service provider with a mission to build an AI developer ecosystem and enable everything to be smart. Tuya has pioneered a purpose-built AI cloud platform with cloud and generative AI capabilities that delivers a full suite of offerings, including Platform-as-a-Service, or PaaS, AI application & others and Smart home & robot products for developers of smart device, commercial applications, and industries. Through its AI developer platform, Tuya has activated a vibrant global developer community of brands, OEMs, AI agents, system integrators and independent software vendors to collectively strive for smart solutions ecosystem embodying the principles of green and low-carbon, security, high efficiency, agility, and openness.

Use of Non-GAAP Financial Measures

In evaluating the business, the Company considers and uses non-GAAP financial measures, such as non-GAAP operating expenses, non-GAAP profit from operations (including non-GAAP operating margin), non-GAAP net profit (including non-GAAP net margin), and non-GAAP basic and diluted net profit per ADS, as supplemental measures to review and assess its operating performance. The presentation of non-GAAP financial measures is not intended to be considered in isolation or as a substitute for the financial information prepared and presented in accordance with generally accepted accounting principles in the United States of America (“U.S. GAAP”). The Company defines non-GAAP financial measures by excluding the impact of share-based compensation expenses and credit-related impairment/(reversal) of long-term investments from the respective GAAP financial measures. The Company presents the non-GAAP financial measures because they are used by the management to evaluate its operating performance and formulate business plans. The Company also believes that the use of the non-GAAP financial measures facilitates investors’ assessment of its operating performance.

Non-GAAP financial measures are not defined under U.S. GAAP and are not presented in accordance with U.S. GAAP. Non-GAAP financial measures have limitations as analytical tools. One of the key limitations of using the aforementioned non-GAAP financial measures is that they do not reflect all items of expenses that affect the Company’s operations. Share-based compensation expenses and credit-related impairment/(reversal) of long-term investments have been and may continue to be incurred in the business and are not reflected in the presentation of non-GAAP measures. Further, the non-GAAP financial measures may differ from the non-GAAP information used by other companies, including peer companies, and therefore their comparability may be limited. The Company compensates for these limitations by reconciling the non-GAAP measures to the most directly comparable U.S. GAAP measures, all of which should be considered when evaluating the Company’s performance. The Company encourages you to review its financial information in its entirety and not rely on a single financial measure.

Reconciliations of Tuya’s non-GAAP financial measures to the most comparable U.S. GAAP measures are included at the end of this press release.

Safe Harbor Statement

This press release contains forward-looking statements. These statements are made under the “safe harbor” provisions of the U.S. Private Securities Litigation Reform Act of 1995. Statements that are not historical facts, including statements about the Company’s beliefs, and expectations, are forward-looking statements. Forward-looking statements involve inherent risks and uncertainties, and a number of factors could cause actual results to differ materially from those contained in any forward-looking statements. In some cases, forward-looking statements can be identified by words or phrases such as “may”, “will”, “expect”, “anticipate”, “target”, “aim”, “estimate”, “intend”, “plan”, “believe”, “potential”, “continue”, “is/are likely to” or other similar expressions. Further information regarding these and other risks, uncertainties or factors is included in the Company’s filings with the SEC. The forward-looking statements included in this press release are only made as of the date hereof, and the Company disclaims any obligation to publicly update any forward-looking statements to reflect subsequent events or circumstances, except as required by law. All forward-looking statements should be evaluated with the understanding of their inherent uncertainty.

Investor Relations Contact

Tuya Inc.
Investor Relations
Email: ir@tuya.com

HL Strategy
Haiyan LI-LABBE
Email: hl@hl-strategy.com

Piacente Financial Communications
China Tel: +86-10-6508-0677
U.S. Tel: +1-212-481-2050
Email: tuya@thepiacentegroup.com


TUYA INC.

UNAUDITED CONDENSED CONSOLIDATED BALANCE SHEETS

AS OF DECEMBER 31, 2025 AND JUNE 30, 2026

(All amounts in US$ thousands (“US$”),

except for share and per share data, unless otherwise noted)

As of
December 31,
 2025

As of
June 30,
2026

ASSETS

Current assets:

Cash and cash equivalents

890,708

871,704

Restricted cash

–

8

Short-term investments

61,770

108,173

Accounts receivable, net

13,193

14,114

Notes receivable, net

10,111

11,214

Inventories, net

30,943

63,843

Prepayments and other current assets, net

16,486

29,201

Total current assets

1,023,211

1,098,257

Non-current assets:

Restricted cash

245

253

Property, equipment and software, net

15,653

35,007

Land use rights, net

8,843

9,032

Operating lease right-of-use assets, net

5,649

9,138

Long-term investments

77,213

12,928

Other non-current assets, net

1,700

986

Total non-current assets

109,303

67,344

Total assets

1,132,514

1,165,601

LIABILITIES AND SHAREHOLDERS’ EQUITY

Current liabilities:

Accounts payable

31,778

36,776

Advances from customers

29,330

43,037

Deferred revenue, current

9,732

9,078

Accruals and other current liabilities

33,261

32,993

Incomes tax payables

142

101

Lease liabilities, current

1,985

3,665

Total current liabilities

106,228

125,650

Non-current liabilities:

Lease liabilities, non-current

3,329

5,651

Deferred revenue, non-current

352

720

Other non-current liabilities

–

5,937

Total non-current liabilities

3,681

12,308

Total liabilities

109,909

137,958


TUYA INC.

UNAUDITED CONDENSED CONSOLIDATED BALANCE SHEETS (CONTINUED)

AS OF DECEMBER 31, 2025 AND JUNE 30, 2026

(All amounts in US$ thousands (“US$”),

except for share and per share data, unless otherwise noted)

As of
December 31,
 2025

As of
June 30,
2026

Shareholders’ equity:

Ordinary shares

–

–

Class A ordinary shares

27

27

Class B ordinary shares

4

4

Treasury stock

(12)

(1,224)

Additional paid-in capital

1,549,389

1,513,127

Accumulated other comprehensive loss

(14,842)

(6,740)

Accumulated deficit

(511,961)

(477,551)

Total shareholders’ equity

1,022,605

1,027,643

Total liabilities and shareholders’ equity

1,132,514

1,165,601


TUYA INC.

UNAUDITED CONDENSED CONSOLIDATED STATEMENTS OF

COMPREHENSIVE INCOME

(All amounts in US$ thousands (“US$”),

except for share and per share data, unless otherwise noted)

For the Three Months Ended

For the Six Months Ended

June 30,
2025

June 30,
2026

June 30,
2025

June 30,
2026

Revenue

80,130

92,935

154,817

173,817

Cost of revenue

(41,384)

(49,887)

(79,820)

(92,871)

Gross profit

38,746

43,048

74,997

80,946

Operating expenses:

Research and development expenses

(22,373)

(23,126)

(45,183)

(45,098)

Sales and marketing expenses

(7,825)

(8,326)

(16,172)

(15,746)

General and administrative expenses

(9,386)

(4,716)

(18,315)

(9,031)

Other operating incomes, net

1,926

2,428

4,309

5,709

     Total operating expenses

(37,658)

(33,740)

(75,361)

(64,166)

Profit/(loss) from operations

1,088

9,308

(364)

16,780

Other income

Other non-operating income, net

767

460

1,534

1,227

Financial income, net

10,761

10,556

23,156

20,052

Foreign exchange gain/(loss), net

606

(1,477)

650

(3,003)

Profit before income tax expense

13,222

18,847

24,976

35,056

    Income tax expense

(635)

(213)

(1,372)

(646)

Net profit

12,587

18,634

23,604

34,410

Net profit attributable to Tuya Inc.

12,587

18,634

23,604

34,410

Net profit attributable to ordinary shareholders

12,587

18,634

23,604

34,410

Net profit

12,587

18,634

23,604

34,410

Other comprehensive income

Changes in fair value of long-term investments

91

(88)

91

(88)

Foreign currency translation

222

4,291

399

8,190

Total comprehensive income
    attributable to Tuya Inc.

12,900

22,837

24,094

42,512


TUYA INC.

UNAUDITED CONDENSED CONSOLIDATED STATEMENTS OF

COMPREHENSIVE INCOME (CONTINUED)

(All amounts in US$ thousands (“US$”),

except for share and per share data, unless otherwise noted)

For the Three Months Ended

For the Six Months Ended

June 30,
2025

June 30,
2026

June 30,
2025

June 30,
2026

Net profit attributable to Tuya Inc.

12,587

18,634

23,604

34,410

Net profit attributable to ordinary
    shareholders

12,587

18,634

23,604

34,410

Weighted average number of ordinary shares
    used in computing profit per share, basic and diluted

– Basic

608,529,487

615,530,665

608,348,598

615,524,218

– Diluted

610,477,980

616,389,351

610,414,036

616,345,859

Net profit per share attributable to ordinary
    shareholders, basic and diluted

– Basic

0.02

0.03

0.04

0.06

– Diluted

0.02

0.03

0.04

0.06

Share-based compensation expenses
    were included in:

Research and development expenses

1,460

356

3,476

728

Sales and marketing expenses

582

74

1,320

160

General and administrative expenses

5,437

172

10,958

342


TUYA INC.

UNAUDITED CONDENSED CONSOLIDATED STATEMENTS OF CASH FLOWS

(All amounts in US$ thousands (“US$”),

except for share and per share data, unless otherwise noted)

For the Three Months Ended

For the Six Months Ended

June 30,
2025

June 30,
2026

June 30,
2025

June 30,
2026

Net cash generated from operating activities

18,191

6,170

27,543

12,569

Net cash (used in)/generated from investing activities

(21,215)

(8,205)

79,968

6,719

Net cash used in financing activities

(36,914)

(38,704)

(36,912)

(38,704)

Effect of exchange rate changes on cash and
    cash equivalents, restricted cash

56

–

88

428

Net (decrease)/increase in cash and cash equivalents,
    restricted cash

(39,882)

(40,739)

70,687

(18,988)

Cash and cash equivalents, restricted cash
    at the beginning of period

763,953

912,704

653,384

890,953

Cash and cash equivalents, restricted
    cash at the end of period

724,071

871,965

724,071

871,965


TUYA INC.

UNAUDITED RECONCILIATION OF NON-GAAP MEASURES TO THE MOST

DIRECTLY COMPARABLE FINANCIAL MEASURES

(All amounts in US$ thousands (“US$”),

except for share and per share data, unless otherwise noted)

For the Three Months Ended

For the Six Months Ended

June 30,
2025

June 30,
2026

June 30,
2025

June 30,
2026

Reconciliation of operating expenses to
    non-GAAP operating expenses

Research and development expenses

(22,373)

(23,126)

(45,183)

(45,098)

Add: Share-based compensation expenses

1,460

356

3,476

728

Adjusted Research and
    development expenses

(20,913)

(22,770)

(41,707)

(44,370)

Sales and marketing expenses

(7,825)

(8,326)

(16,172)

(15,746)

Add: Share-based compensation expenses

582

74

1,320

160

Adjusted Sales and marketing expenses

(7,243)

(8,252)

(14,852)

(15,586)

General and administrative expenses

(9,386)

(4,716)

(18,315)

(9,031)

Add: Share-based compensation expenses

5,437

172

10,958

342

Add: Credit-related impairment/(reversal) of
    long-term investments

27

(307)

27

(307)

Adjusted General and
    administrative expenses

(3,922)

(4,851)

(7,330)

(8,996)

Reconciliation of profit/(loss) from
    operations to non-GAAP
    profit from operations

Profit/(loss) from operations

1,088

9,308

(364)

16,780

Operating margin

1.4 %

10.0 %

(0.2) %

9.7 %

Add: Share-based compensation expenses

7,479

602

15,754

1,230

Add: Credit-related impairment/(reversal) of
    long-term investments

27

(307)

27

(307)

Non-GAAP profit from operations

8,594

9,603

15,417

17,703

Non-GAAP Operating margin

10.7 %

10.3 %

10.0 %

10.2 %


TUYA INC.

UNAUDITED RECONCILIATION OF NON-GAAP MEASURES TO THE MOST

DIRECTLY COMPARABLE FINANCIAL MEASURES (CONTINUED)

(All amounts in US$ thousands (“US$”),

except for share and per share data, unless otherwise noted)

For the Three Months Ended

For the Six Months Ended

June 30,
2025

June 30,
2026

June 30,
2025

June 30,
2026

Reconciliation of net profit to
    non-GAAP net profit

Net profit

12,587

18,634

23,604

34,410

Net margin

15.7 %

20.1 %

15.2 %

19.8 %

Add: Share-based compensation expenses

7,479

602

15,754

1,230

Add: Credit-related impairment/(reversal) of
    long-term investments

27

-307

27

-307

Non-GAAP Net profit

20,093

18,929

39,385

35,333

Non-GAAP Net margin

25.1 %

20.4 %

25.4 %

20.3 %

Weighted average number of ordinary shares
    used in computing non-GAAP
    net profit per share,

– Basic

608,529,487

615,530,665

608,348,598

615,524,218

– Diluted

610,477,980

616,389,351

610,414,036

616,345,859

Non-GAAP net profit per share attributable to
    ordinary shareholders

– Basic

0.03

0.03

0.06

0.06

– Diluted

0.03

0.03

0.06

0.06