Home Blog Page 176

Rewarding Meetings Begin At Hyatt Regency Kuala Lumpur At KL Midtown

KUALA LUMPUR, Malaysia, Aug. 25, 2026 /PRNewswire/ — As Kuala Lumpur continues to welcome major international exhibitions, conventions and corporate events, Hyatt Regency Kuala Lumpur at KL Midtown is inviting meeting planners to unlock greater value through Hyatt’s #BeMoreRewarded campaign and the hotel’s exclusive Enjoy Extra Perks offer.

Perfectly positioned in vibrant Mont Kiara, Dutamas and KL Midtown, just a short walk from the Malaysia International Trade and Exhibition Centre (MITEC), the hotel pairs one of the city’s most strategic business addresses with versatile event spaces, destination dining and Hyatt’s signature hospitality—offering a sophisticated setting for meetings, incentives, conferences and celebrations.

IN THE HEART OF KUALA LUMPUR’S PREMIER BUSINESS DISTRICT

For organisers and delegates attending international exhibitions and conventions, location can make all the difference. Positioned opposite to MITEC, Malaysia’s largest trade and exhibition venue, Hyatt Regency Kuala Lumpur at KL Midtown places guests just moments from the country’s most significant business events while offering seamless access to Kuala Lumpur’s commercial districts, government offices and lifestyle attractions.

From Left to Right : The hotel located next to MITEC and The Regency Ballroom

Whether planning an international conference, executive meeting, product launch or incentive programme, the hotel offers a sophisticated urban retreat where convenience meets comfort. Complementing its prime location is a versatile collection of meeting and event venues, supported by experienced event specialists and modern technology to ensure every gathering is executed with precision and care.

CURATED EXPERIENCES BEYOND THE MEETING ROOM

Exceptional events are often remembered for the experiences shared beyond the meeting room. Hyatt Regency Kuala Lumpur at KL Midtown offers a collection of distinctive venues that can be tailored to suit the style, purpose and scale of every gathering.

Meeting planners can welcome delegates with a tropical cocktail reception at the hotel’s 32nd-floor infinity pool, where sweeping views of Kuala Lumpur’s skyline provide an impressive backdrop for guests to connect before the official programme begins.

Beyond its meeting spaces, the hotel also features versatile venues for dining, drinks, celebrations and exclusive events. ENSŌ Izakaya & Bar can be adapted to suit a variety of event concepts, from networking receptions and incentive dinners to post-conference celebrations. The venue pairs contemporary Japanese cuisine with curated entertainment and optional live DJ performances, creating engaging social experiences tailored to each occasion.

For gatherings that call for a more refined atmosphere, China House serves authentic Chinese cuisine in elegant surroundings, providing the perfect backdrop for executive dining, client entertainment, private celebrations and VIP gatherings.

Together, these thoughtfully curated venues give organisers the flexibility to personalise every event, while reflecting Hyatt Regency Kuala Lumpur at KL Midtown’s commitment to genuine hospitality and memorable guest experiences.

Be More Rewarded | Together by Hyatt

As part of Hyatt’s Together by Hyatt philosophy, Hyatt Regency Kuala Lumpur at KL Midtown continues to create meaningful meetings, incentives, conferences and celebrations through exceptional experiences and rewarding value.

As a participating property in the Asia Pacific Groups, Meetings & Events Offer 2026, Hyatt Regency Kuala Lumpur at KL Midtown invites planners to enjoy up to four rewards based on contracted revenue, including rebates, suite upgrades, complimentary meeting rooms, WIFI, AV discounts, wellbeing experiences and bonus World of Hyatt points.  Book and contract your qualifying event by 31 December 2026 for events held on or before 31 March 2027, and simply quote offer code ASPACME26 in your initial enquiry to unlock these exclusive benefits.

To make every event even more rewarding, Hyatt Regency Kuala Lumpur at KL Midtown is also offering its exclusive Enjoy Extra Perks promotion. Meeting planners who book their qualifying event by 31 October 2026 for groups held on or before 20 December 2026 will receive one additional benefit on top of the regional campaign when planners quote REVREBATE in their initial enquiry.

Whether attending an international exhibition at MITEC, organising an international conference or hosting an executive gathering, Hyatt Regency Kuala Lumpur at KL Midtown offers the ideal combination of strategic location, elevated culinary experiences and rewarding meeting benefits for unforgettable events.

For more information or to enquire about meetings and events, visit www.hyattregencykualalumpur.com

About Hyatt Regency Kuala Lumpur at KL Midtown

Nestled at 7 Jalan Dutamas 2 within the dynamic KL Midtown district, Hyatt Regency Kuala Lumpur at KL Midtown enjoys an enviable location in the vibrant heart of Dutamas and Mont Kiara. Designed by world-renowned Japanese architect Kengo Kuma, the hotel embodies a harmonious fusion of nature, Malaysian artistry, and contemporary sophistication.

The property offers a total of 406 accommodations, comprising 306 well-appointed guestrooms and suites, together with 100 fully serviced residences—seamlessly catering to both short-term visitors and extended-stay guests. For events and meetings, the hotel features 16 flexible function rooms equipped with state-of-the-art facilities, including a spectacular pillarless ballroom and meeting spaces spanning three floors. The banquet facilities are also halal-certified.  Dining options at the hotel include ENSŌ Izakaya & Bar, China House, Midtown Brasserie, and Midtown Lounge. For more information, please visit www.hyattregencyklmidtown.com.

About Hyatt Regency

The Hyatt Regency brand is a global collection of hotels and resorts found in more than 245 locations in over 50 countries around the world. The depth and breadth of this diverse portfolio, from expansive resorts to urban city centers, is a testament to the brand’s evolutionary spirit. For more than 50 years, the Hyatt Regency brand has championed fresh perspectives and enriching experiences, while its forward-thinking philosophy provides guests with inviting spaces that bring people together and foster a spirit of community.  As a hospitality original, Hyatt Regency hotels and resorts are founded on openness—our colleagues consistently serve with open minds and open hearts to deliver unforgettable celebrations, effortless relaxation and notable culinary experiences alongside expert meetings and technology-enabled collaboration. The brand prides itself on an everlasting reputation for insightful care—one that welcomes all people across all countries and cultures, generation after generation. For more information, please visit www.hyattregency.com. Follow @HyattRegency on Facebook and Instagram, and tag photos with #HyattRegency.

Tuya Reports Second Quarter 2026 Unaudited Financial Results

SANTA CLARA, Calif., Aug. 25, 2026 /PRNewswire/ — Tuya Inc. (“Tuya” or the “Company”) (NYSE: TUYA; HKEX: 2391), a global leading AI cloud platform service provider, today announced its unaudited financial results for the second quarter ended June 30, 2026.

Second Quarter 2026 Financial Highlights
  • Total revenue was US$92.9 million, up approximately 16.0% year-over-year (2Q2025: US$80.1 million).
  • Platform-as-a-service (“PaaS“) revenue was US$67.9 million, up approximately 16.9% year-over-year (2Q2025: US$58.1 million).
  • AI application & others revenue was US$11.5 million, up approximately 3.9% year-over-year (2Q2025: US$11.1 million).
  • Smart home & robot product revenue was US$13.5 million, up approximately 23.2% year-over-year (2Q2025: US$10.9 million).
  • Overall gross margin was 46.3%, down 2.1 percentage points year-over-year (2Q2025: 48.4%). Gross margin of PaaS was 46.8% (2Q2025: 48.7%).
  • Operating margin was 10.0%, up 8.6 percentage points year-over-year (2Q2025: 1.4%). Non-GAAP operating margin was 10.3% (2Q2025: 10.7%). 
  • Net margin was 20.1%, improved by 4.4 percentage points year-over-year (2Q2025: 15.7%). Non-GAAP net margin was 20.4% (2Q2025: 25.1%).
  • Net profits were US$18.6 million (2Q2025: US$12.6 million). Non-GAAP net profits were US$18.9 million (2Q2025: US$20.1 million).
  • Net cash generated from operating activities was US$6.2 million (2Q2025: US$18.2 million).
  • Total cash and cash equivalents, time deposits and treasury securities recorded as short-term and long-term investments were US$976.1 million as of June 30, 2026, compared to US$1,017.3 million as of December 31, 2025.

For further information on the non-GAAP financial measures presented above, see the section headed “Use of Non-GAAP Financial Measures.”

Second Quarter 2026 Operating Highlights
  • Premium PaaS customers[1] for the trailing 12 months ended June 30, 2026 were 318 (2Q2025: 285). In the second quarter of 2026, the Company’s premium PaaS customers contributed approximately 89.5% of its PaaS revenue (2Q2025: approximately 88.6%).
  • Registered AI developers were over 2,092,000 as of June 30, 2026, up 16.2% from approximately 1,801,000 developers as of December 31, 2025.
  1. The Company defines a premium PaaS customer as a customer as of a given date that contributed more than US$100,000 of PaaS revenue during the immediately preceding 12-month period.

Mr. Xueji (Jerry) Wang, Founder and Chief Executive Officer of Tuya, commented, “In the second quarter, despite a complex global operating environment, the Company continued to demonstrate solid growth momentum. Total revenue increased by 16.0% year over year to US$92.9 million, with PaaS revenue increasing by 16.9% and remaining the Company’s primary growth driver. This performance reflected resilient demand across selected home appliance categories and increasing adoption of differentiated, AI-enabled products and solutions.

Strategically, we continued to advance the productization and real-world deployment of AI. Shipments of our AI-powered companion product solutions continued to expand, while the launch of Tuya Cobuilder further lowered the barriers to AI hardware development by helping developers move more efficiently from product concept to physical-device deployment. Looking ahead, we will remain focused on AI-native application innovation, AI developer platform development and the global expansion of validated solutions.”

Mr. Yi (Alex) Yang, Director and Chief Financial Officer of Tuya, added, “In the second quarter, total revenue reached US$92.9 million, up 16.0% year over year. PaaS revenue was US$67.9 million, up 16.9%, while Smart home & robot product revenue increased by 23.2% to US$13.5 million and AI application & others revenue increased by 3.9% to US$11.5 million.

Despite pressure from product and solution mix and semiconductor supply-chain pricing, gross profit increased by 11.1% year over year to US$43.0 million. Non-GAAP profit from operations increased by 11.7% to US$9.6 million, with non-GAAP operating margin remaining in double digits at 10.3%. We ended the quarter with approximately US$976.1 million in cash and cash equivalents, time deposits and treasury securities, providing continued flexibility to support our AI capabilities, global expansion and long-term strategic investments.”

Second Quarter 2026 Unaudited Financial Results

REVENUE

Total revenue in the second quarter of 2026 increased by 16.0% to US$92.9 million from US$80.1 million in the same period of 2025.

  • PaaS revenue in the second quarter of 2026 increased by 16.9% to US$67.9 million from US$58.1 million in the same period of 2025, primarily due to increasing demand compared with the same period of 2025 and the Company’s strategic focus on customer needs and product enhancements, despite the disruptions in the international business environment due to tariff-related headwinds since April 2025. Our core customer base remained stable.
  • AI application & others revenue in the second quarter of 2026 increased by 3.9% to US$11.5 million from US$11.1 million in the same period of 2025, primarily due to an increase in revenue from cloud-based services. During the quarter, the Company remained committed to offering recurring value-added services with AI application functions.
  • Smart home & robot product revenue in the second quarter of 2026 increased by 23.2% to US$13.5 million from US$10.9 million in the same period of 2025, primarily due to growing customer demands.

GROSS PROFIT AND GROSS MARGIN

Total gross profit in the second quarter of 2026 increased by 11.1% to US$43.0 million from US$38.7 million in the same period of 2025. The gross margin in the second quarter of 2026 was 46.3%, compared to 48.4% in the same period of 2025.

  • PaaS gross margin in the second quarter of 2026 was 46.8%, compared to 48.7% in the same period of 2025, partly attributable to recent price fluctuations in the semiconductor supply chain.
  • AI application & others gross margin in the second quarter of 2026 was 72.0%, compared to 72.0% in the same period of 2025.
  • Smart home & robot product gross margin in the second quarter of 2026 was 21.9%, compared to 22.5% in the same period of 2025.

Gross margin fluctuated primarily due to changes in product and solution mix, as well as fluctuations in semiconductor supply-chain pricing. As an AI developer platform with a rich ecosystem of smart devices and applications, the Company remains focused on AI offering with compelling value propositions while maintaining economic efficiency.

OPERATING EXPENSES

Operating expenses decreased by 10.4% to US$33.7 million in the second quarter of 2026 from US$37.7 million in the same period of 2025. Non-GAAP operating expenses increased by 10.9% to US$33.4 million in the second quarter of 2026 from US$30.2 million in the same period of 2025. For further information on the non-GAAP financial measures presented above, see the section headed “Use of Non-GAAP Financial Measures.”

  • Research and development expenses in the second quarter of 2026 were US$23.1 million, up 3.4% from US$22.4 million in the same period of 2025, primarily due to i) higher employee-related cost and outsourced labor cost of US$1.2 million, ii) higher third-party cloud service fees of US$0.3 million, iii) partially offset by lower share-based compensation expenses of US$1.1 million as equity incentive awards granted at higher valuations in previous years have been gradually amortized. Non-GAAP adjusted research and development expenses in the second quarter of 2026 were US$22.8 million, compared to US$20.9 million in the same period of 2025.
  • Sales and marketing expenses in the second quarter of 2026 were US$8.3 million, up 6.4% from US$7.8 million in the same period of 2025, primarily because of i) higher employee-related cost of US$0.5 million, ii) higher marketing expense of US$0.2 million, iii) partially offset by lower share-based compensation expenses of US$0.5 million as equity incentive awards granted at higher valuations in previous years have been gradually amortized. Non-GAAP adjusted sales and marketing expenses in the second quarter of 2026 were US$8.3 million, compared to US$7.2 million in the same period of 2025.
  • General and administrative expenses in the second quarter of 2026 were US$4.7 million, down 49.8% from US$9.4 million in the same period of 2025, primarily due to i) lower share-based compensation expenses of US$5.3 million as equity incentive awards granted at higher valuations in previous years have been gradually amortized, ii) partially offset by higher allowance for credit losses of US$0.3 million. Non-GAAP adjusted general and administrative expenses in the second quarter of 2026 were US$4.9 million, compared to US$3.9 million in the same period of 2025.
  • Other operating income, net in the second quarter of 2026 was US$2.4 million, primarily due to the receipt of software value-added tax refunds.

PROFIT FROM OPERATIONS AND OPERATING MARGIN

Profit from operations in the second quarter of 2026 was US$9.3 million, compared to US$1.1 million in the same period of 2025. The Company had a non-GAAP profit from operations of US$9.6 million in the second quarter of 2026, compared to US$8.6 million in the same period of 2025, demonstrating consistent operating profitability and leverage.

Operating margin in the second quarter of 2026 was 10.0%, up 8.6 percentage points from 1.4% in the same period of 2025. Non-GAAP operating margin in the second quarter of 2026 was 10.3%, down 0.4 percentage points from 10.7% in the same period of 2025.

NET PROFIT AND NET MARGIN

Net profit in the second quarter of 2026 was US$18.6 million, increased by 48.0% from US$12.6 million in the same period of 2025. Non-GAAP net profit in the second quarter of 2026 was US$18.9 million, compared to US$20.1 million in the same period of 2025.

Net margin in the second quarter of 2026 was 20.1%, improved by 4.4 percentage points from 15.7% in the same period of 2025. Non-GAAP net margin in the second quarter of 2026 was 20.4%, compared to 25.1% in the same period of 2025.

BASIC AND DILUTED NET PROFIT PER ADS

Basic and diluted net profit per ADS was US$0.03 in the second quarter of 2026, compared to US$0.02 in the same period of 2025. Each ADS represents one Class A ordinary share.

Non-GAAP basic and diluted net profit per ADS was US$0.03 in the second quarter of 2026, compared to US$0.03 in the same period of 2025.

CASH AND CASH EQUIVALENTS, TIME DEPOSITS AND TREASURY SECURITIES RECORDED AS SHORT-TERM AND LONG-TERM INVESTMENTS

Cash and cash equivalents, time deposits and treasury securities recorded as short-term and long-term investments were US$976.1 million as of June 30, 2026, compared to US$1,017.3 million as of December 31, 2025. The Company believes its current cash position is sufficient to meet its current liquidity and working capital needs.

NET CASH GENERATED FROM OPERATING ACTIVITIES

Net cash generated from operating activities in the second quarter of 2026 was US$6.2 million, compared to US$18.2 million in the same period of 2025. The net cash generated from operating activities for the second quarter of 2026 mainly due to working capital changes in the ordinary course of business.

For further information on non-GAAP financial measures presented above, see the section headed “Use of Non-GAAP Financial Measures.”

Business Outlook

The overall operating environment remains complex, while continuing to show signs of normalization. Participants across the value chain – including manufacturers, brands and channel partners – remain cautious in their planning. At the same time, we have observed more normalized project execution and continued demand recovery across several of our core categories, suggesting that the market is gradually moving from adjustment toward a more stable operating rhythm.

Meanwhile, global AI development is entering a new stage of application-led growth. As AI technologies continue to evolve from foundational capabilities toward real-world deployment, enterprises and consumers are increasingly focused on practical use cases, scalable implementation and scenario-based integration with physical devices. This trend is accelerating the convergence of AI and smart hardware and creating new opportunities for application innovation, product expansion and ecosystem collaboration across a wide range of verticals.

Against this backdrop, Tuya continues to advance its AI-driven strategy by strengthening its AI developer platform, expanding application-level capabilities and supporting broader deployment across diverse smart-device and industry scenarios. The ongoing evolution of AI applications, together with the Company’s platform capabilities, ecosystem strengths and global developer base, will continue to support the creation of diversified, higher-value opportunities over the long term.

In this environment, the Company will continue to maintain disciplined execution while selectively investing in AI-driven applications, platform capabilities and ecosystem development. The Company will continue to iterate and improve its products and services, enhance both software and hardware capabilities, and further support customers and developers in bringing AI-driven applications into practical deployment. At the same time, the Company recognizes that its future trajectory may continue to be influenced by a range of external factors, including shifts in consumer demand, regional economic divergence, inventory dynamics, foreign exchange and interest-rate volatility, tariffs and trade-policy adjustments, and broader geopolitical uncertainties.

Conference Call Information

The Company’s management will hold a conference call at 08:30 P.M. U.S. Eastern Time on Monday, August 24, 2026 (08:30 A.M. Hong Kong Time on Tuesday, August 25, 2026) to discuss the financial results. In advance of the conference call, all participants must use the following links to complete the online registration process. Upon registering, each participant will receive the dial-in information and a unique PIN (personal access code) to join the call as well as an email confirmation with the details.

Participants Online Webcast Registration:
https://edge.media-server.com/mmc/p/x8phnjqd

Participants Call Registration:
https://register-conf.media-server.com/register/BI2992f21177c7423c83ce142eb2ef031c

A live and archived webcast of the conference call will also be available at the Company’s investor relations website at https://ir.tuya.com.

About Tuya Inc.

Tuya Inc. (NYSE: TUYA; HKEX: 2391) is a global leading AI cloud platform service provider with a mission to build an AI developer ecosystem and enable everything to be smart. Tuya has pioneered a purpose-built AI cloud platform with cloud and generative AI capabilities that delivers a full suite of offerings, including Platform-as-a-Service, or PaaS, AI application & others and Smart home & robot products for developers of smart device, commercial applications, and industries. Through its AI developer platform, Tuya has activated a vibrant global developer community of brands, OEMs, AI agents, system integrators and independent software vendors to collectively strive for smart solutions ecosystem embodying the principles of green and low-carbon, security, high efficiency, agility, and openness.

Use of Non-GAAP Financial Measures

In evaluating the business, the Company considers and uses non-GAAP financial measures, such as non-GAAP operating expenses, non-GAAP profit from operations (including non-GAAP operating margin), non-GAAP net profit (including non-GAAP net margin), and non-GAAP basic and diluted net profit per ADS, as supplemental measures to review and assess its operating performance. The presentation of non-GAAP financial measures is not intended to be considered in isolation or as a substitute for the financial information prepared and presented in accordance with generally accepted accounting principles in the United States of America (“U.S. GAAP”). The Company defines non-GAAP financial measures by excluding the impact of share-based compensation expenses and credit-related impairment/(reversal) of long-term investments from the respective GAAP financial measures. The Company presents the non-GAAP financial measures because they are used by the management to evaluate its operating performance and formulate business plans. The Company also believes that the use of the non-GAAP financial measures facilitates investors’ assessment of its operating performance.

Non-GAAP financial measures are not defined under U.S. GAAP and are not presented in accordance with U.S. GAAP. Non-GAAP financial measures have limitations as analytical tools. One of the key limitations of using the aforementioned non-GAAP financial measures is that they do not reflect all items of expenses that affect the Company’s operations. Share-based compensation expenses and credit-related impairment/(reversal) of long-term investments have been and may continue to be incurred in the business and are not reflected in the presentation of non-GAAP measures. Further, the non-GAAP financial measures may differ from the non-GAAP information used by other companies, including peer companies, and therefore their comparability may be limited. The Company compensates for these limitations by reconciling the non-GAAP measures to the most directly comparable U.S. GAAP measures, all of which should be considered when evaluating the Company’s performance. The Company encourages you to review its financial information in its entirety and not rely on a single financial measure.

Reconciliations of Tuya’s non-GAAP financial measures to the most comparable U.S. GAAP measures are included at the end of this press release.

Safe Harbor Statement

This press release contains forward-looking statements. These statements are made under the “safe harbor” provisions of the U.S. Private Securities Litigation Reform Act of 1995. Statements that are not historical facts, including statements about the Company’s beliefs, and expectations, are forward-looking statements. Forward-looking statements involve inherent risks and uncertainties, and a number of factors could cause actual results to differ materially from those contained in any forward-looking statements. In some cases, forward-looking statements can be identified by words or phrases such as “may”, “will”, “expect”, “anticipate”, “target”, “aim”, “estimate”, “intend”, “plan”, “believe”, “potential”, “continue”, “is/are likely to” or other similar expressions. Further information regarding these and other risks, uncertainties or factors is included in the Company’s filings with the SEC. The forward-looking statements included in this press release are only made as of the date hereof, and the Company disclaims any obligation to publicly update any forward-looking statements to reflect subsequent events or circumstances, except as required by law. All forward-looking statements should be evaluated with the understanding of their inherent uncertainty.

Investor Relations Contact

Tuya Inc.
Investor Relations
Email: ir@tuya.com

HL Strategy
Haiyan LI-LABBE
Email: hl@hl-strategy.com

Piacente Financial Communications
China Tel: +86-10-6508-0677
U.S. Tel: +1-212-481-2050
Email: tuya@thepiacentegroup.com


TUYA INC.

UNAUDITED CONDENSED CONSOLIDATED BALANCE SHEETS

AS OF DECEMBER 31, 2025 AND JUNE 30, 2026

(All amounts in US$ thousands (“US$”),

except for share and per share data, unless otherwise noted)

As of
December 31,
 2025

As of
June 30,
2026

ASSETS

Current assets:

Cash and cash equivalents

890,708

871,704

Restricted cash

–

8

Short-term investments

61,770

108,173

Accounts receivable, net

13,193

14,114

Notes receivable, net

10,111

11,214

Inventories, net

30,943

63,843

Prepayments and other current assets, net

16,486

29,201

Total current assets

1,023,211

1,098,257

Non-current assets:

Restricted cash

245

253

Property, equipment and software, net

15,653

35,007

Land use rights, net

8,843

9,032

Operating lease right-of-use assets, net

5,649

9,138

Long-term investments

77,213

12,928

Other non-current assets, net

1,700

986

Total non-current assets

109,303

67,344

Total assets

1,132,514

1,165,601

LIABILITIES AND SHAREHOLDERS’ EQUITY

Current liabilities:

Accounts payable

31,778

36,776

Advances from customers

29,330

43,037

Deferred revenue, current

9,732

9,078

Accruals and other current liabilities

33,261

32,993

Incomes tax payables

142

101

Lease liabilities, current

1,985

3,665

Total current liabilities

106,228

125,650

Non-current liabilities:

Lease liabilities, non-current

3,329

5,651

Deferred revenue, non-current

352

720

Other non-current liabilities

–

5,937

Total non-current liabilities

3,681

12,308

Total liabilities

109,909

137,958


TUYA INC.

UNAUDITED CONDENSED CONSOLIDATED BALANCE SHEETS (CONTINUED)

AS OF DECEMBER 31, 2025 AND JUNE 30, 2026

(All amounts in US$ thousands (“US$”),

except for share and per share data, unless otherwise noted)

As of
December 31,
 2025

As of
June 30,
2026

Shareholders’ equity:

Ordinary shares

–

–

Class A ordinary shares

27

27

Class B ordinary shares

4

4

Treasury stock

(12)

(1,224)

Additional paid-in capital

1,549,389

1,513,127

Accumulated other comprehensive loss

(14,842)

(6,740)

Accumulated deficit

(511,961)

(477,551)

Total shareholders’ equity

1,022,605

1,027,643

Total liabilities and shareholders’ equity

1,132,514

1,165,601


TUYA INC.

UNAUDITED CONDENSED CONSOLIDATED STATEMENTS OF

COMPREHENSIVE INCOME

(All amounts in US$ thousands (“US$”),

except for share and per share data, unless otherwise noted)

For the Three Months Ended

For the Six Months Ended

June 30,
2025

June 30,
2026

June 30,
2025

June 30,
2026

Revenue

80,130

92,935

154,817

173,817

Cost of revenue

(41,384)

(49,887)

(79,820)

(92,871)

Gross profit

38,746

43,048

74,997

80,946

Operating expenses:

Research and development expenses

(22,373)

(23,126)

(45,183)

(45,098)

Sales and marketing expenses

(7,825)

(8,326)

(16,172)

(15,746)

General and administrative expenses

(9,386)

(4,716)

(18,315)

(9,031)

Other operating incomes, net

1,926

2,428

4,309

5,709

     Total operating expenses

(37,658)

(33,740)

(75,361)

(64,166)

Profit/(loss) from operations

1,088

9,308

(364)

16,780

Other income

Other non-operating income, net

767

460

1,534

1,227

Financial income, net

10,761

10,556

23,156

20,052

Foreign exchange gain/(loss), net

606

(1,477)

650

(3,003)

Profit before income tax expense

13,222

18,847

24,976

35,056

    Income tax expense

(635)

(213)

(1,372)

(646)

Net profit

12,587

18,634

23,604

34,410

Net profit attributable to Tuya Inc.

12,587

18,634

23,604

34,410

Net profit attributable to ordinary shareholders

12,587

18,634

23,604

34,410

Net profit

12,587

18,634

23,604

34,410

Other comprehensive income

Changes in fair value of long-term investments

91

(88)

91

(88)

Foreign currency translation

222

4,291

399

8,190

Total comprehensive income
    attributable to Tuya Inc.

12,900

22,837

24,094

42,512


TUYA INC.

UNAUDITED CONDENSED CONSOLIDATED STATEMENTS OF

COMPREHENSIVE INCOME (CONTINUED)

(All amounts in US$ thousands (“US$”),

except for share and per share data, unless otherwise noted)

For the Three Months Ended

For the Six Months Ended

June 30,
2025

June 30,
2026

June 30,
2025

June 30,
2026

Net profit attributable to Tuya Inc.

12,587

18,634

23,604

34,410

Net profit attributable to ordinary
    shareholders

12,587

18,634

23,604

34,410

Weighted average number of ordinary shares
    used in computing profit per share, basic and diluted

– Basic

608,529,487

615,530,665

608,348,598

615,524,218

– Diluted

610,477,980

616,389,351

610,414,036

616,345,859

Net profit per share attributable to ordinary
    shareholders, basic and diluted

– Basic

0.02

0.03

0.04

0.06

– Diluted

0.02

0.03

0.04

0.06

Share-based compensation expenses
    were included in:

Research and development expenses

1,460

356

3,476

728

Sales and marketing expenses

582

74

1,320

160

General and administrative expenses

5,437

172

10,958

342


TUYA INC.

UNAUDITED CONDENSED CONSOLIDATED STATEMENTS OF CASH FLOWS

(All amounts in US$ thousands (“US$”),

except for share and per share data, unless otherwise noted)

For the Three Months Ended

For the Six Months Ended

June 30,
2025

June 30,
2026

June 30,
2025

June 30,
2026

Net cash generated from operating activities

18,191

6,170

27,543

12,569

Net cash (used in)/generated from investing activities

(21,215)

(8,205)

79,968

6,719

Net cash used in financing activities

(36,914)

(38,704)

(36,912)

(38,704)

Effect of exchange rate changes on cash and
    cash equivalents, restricted cash

56

–

88

428

Net (decrease)/increase in cash and cash equivalents,
    restricted cash

(39,882)

(40,739)

70,687

(18,988)

Cash and cash equivalents, restricted cash
    at the beginning of period

763,953

912,704

653,384

890,953

Cash and cash equivalents, restricted
    cash at the end of period

724,071

871,965

724,071

871,965


TUYA INC.

UNAUDITED RECONCILIATION OF NON-GAAP MEASURES TO THE MOST

DIRECTLY COMPARABLE FINANCIAL MEASURES

(All amounts in US$ thousands (“US$”),

except for share and per share data, unless otherwise noted)

For the Three Months Ended

For the Six Months Ended

June 30,
2025

June 30,
2026

June 30,
2025

June 30,
2026

Reconciliation of operating expenses to
    non-GAAP operating expenses

Research and development expenses

(22,373)

(23,126)

(45,183)

(45,098)

Add: Share-based compensation expenses

1,460

356

3,476

728

Adjusted Research and
    development expenses

(20,913)

(22,770)

(41,707)

(44,370)

Sales and marketing expenses

(7,825)

(8,326)

(16,172)

(15,746)

Add: Share-based compensation expenses

582

74

1,320

160

Adjusted Sales and marketing expenses

(7,243)

(8,252)

(14,852)

(15,586)

General and administrative expenses

(9,386)

(4,716)

(18,315)

(9,031)

Add: Share-based compensation expenses

5,437

172

10,958

342

Add: Credit-related impairment/(reversal) of
    long-term investments

27

(307)

27

(307)

Adjusted General and
    administrative expenses

(3,922)

(4,851)

(7,330)

(8,996)

Reconciliation of profit/(loss) from
    operations to non-GAAP
    profit from operations

Profit/(loss) from operations

1,088

9,308

(364)

16,780

Operating margin

1.4 %

10.0 %

(0.2) %

9.7 %

Add: Share-based compensation expenses

7,479

602

15,754

1,230

Add: Credit-related impairment/(reversal) of
    long-term investments

27

(307)

27

(307)

Non-GAAP profit from operations

8,594

9,603

15,417

17,703

Non-GAAP Operating margin

10.7 %

10.3 %

10.0 %

10.2 %


TUYA INC.

UNAUDITED RECONCILIATION OF NON-GAAP MEASURES TO THE MOST

DIRECTLY COMPARABLE FINANCIAL MEASURES (CONTINUED)

(All amounts in US$ thousands (“US$”),

except for share and per share data, unless otherwise noted)

For the Three Months Ended

For the Six Months Ended

June 30,
2025

June 30,
2026

June 30,
2025

June 30,
2026

Reconciliation of net profit to
    non-GAAP net profit

Net profit

12,587

18,634

23,604

34,410

Net margin

15.7 %

20.1 %

15.2 %

19.8 %

Add: Share-based compensation expenses

7,479

602

15,754

1,230

Add: Credit-related impairment/(reversal) of
    long-term investments

27

-307

27

-307

Non-GAAP Net profit

20,093

18,929

39,385

35,333

Non-GAAP Net margin

25.1 %

20.4 %

25.4 %

20.3 %

Weighted average number of ordinary shares
    used in computing non-GAAP
    net profit per share,

– Basic

608,529,487

615,530,665

608,348,598

615,524,218

– Diluted

610,477,980

616,389,351

610,414,036

616,345,859

Non-GAAP net profit per share attributable to
    ordinary shareholders

– Basic

0.03

0.03

0.06

0.06

– Diluted

0.03

0.03

0.06

0.06


Beyond AI code generation: Saigon Technology solves the scaling bottleneck for mid-sized tech teams

SYDNEY, Aug. 25, 2026 /PRNewswire/ — As AI exponentially increases the volume of code generated by mid-sized technology teams, Saigon Technology, an AI-native software engineering partner, is deploying its integrated delivery system to solve the industry’s emerging scaling bottleneck. While engineers can now prototype features, write tests, and automate repetitive work faster than ever, many companies find their existing infrastructures struggling to keep pace with the accelerated output.

For Saigon Technology, the question is no longer simply how much more code AI can help a team produce, but whether the surrounding engineering framework can successfully scale to turn that capacity into reliable, production-ready software.

More Coding Capacity Does Not Mean More Engineering Capacity

AI coding assistants can increase development output, but engineering goes far beyond writing code. It also requires architecture, security, testing, infrastructure, reliability, integration, and production operations. AI can accelerate these tasks, but it does not automatically create the systems and standards needed to connect them.

Consider two approaches: Company A, with 10 engineers using AI coding assistants, and Company B, with AI embedded in an integrated engineering system covering reusable components, automated QA, DevOps, security, and architecture practices.

“Company A may produce more code as AI becomes embedded across its workflow. The software may still work well. But as output scales, there can also be more code to review, integrate, secure, test, and maintain,” said Phong Le, AI Tech Lead at Saigon Technology. “The issue is therefore whether the engineering system can turn additional coding capacity into scalable delivery.”

A Lesson From The Digital Transformation Era

The pattern is familiar with earlier technology shifts.

Cloud platforms, automation, and digital systems created significant new capabilities. But without supporting processes, governance, and operating models, organizations could also end up with fragmented systems, duplicated capabilities, and greater complexity.

AI-assisted development may create a similar challenge inside software engineering.

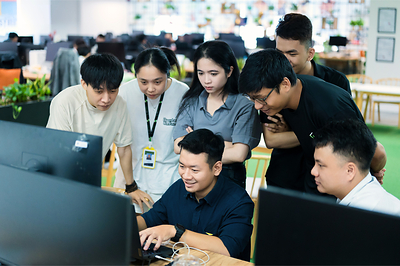
Saigon Technology engineers reviewing an AI-assisted build together

Why an AI-Native Engineering System Matters

This is where Saigon Technology’s AI-native engineering system comes in. The model is connecting engineers and AI with the systems required to deliver software across the full lifecycle.

That includes:

  • AI-assisted development: accelerating implementation and repetitive technical work
  • Reusable components and patterns: reducing duplicated effort and improving consistency
  • Automated QA and testing: validating a larger volume of AI-assisted output
  • DevOps and CI/CD: keeping higher development velocity manageable in delivery
  • Security and architecture practices: maintaining consistency across AI-assisted decisions
  • Cloud and production operations: supporting software beyond development

The value is the combination of people, AI, engineering standards, automation, and accumulated delivery experience working as one system.

What This Means for Established Technology Teams

A company may already have a capable CTO and engineering organization. The challenge may instead be balancing modernization with new product development, expanding an AI initiative while maintaining core platforms, or increasing delivery volume without growing the internal organization at the same pace.

In these situations, an external engineering partner can add more than developers. It can bring an established delivery system that complements the capabilities already inside the business.

This is the model Saigon Technology is applying as AI reshapes software delivery: using AI to expand coding capacity while connecting that capacity to the engineering practices required for reliable, scalable production delivery.

With 14+ years of software engineering experience, 400+ engineers, and 850+ projects delivered across industries, Saigon Technology is applying its AI-native engineering approach to help established technology teams expand what they can deliver without rebuilding their engineering operation from the ground up.

Learn more about Saigon Technology’s AI-native engineering and AI optimization capabilities at saigontechnology.com.

Cyient Unveils New Brand Positioning ‘Nothing Less’

New Positioning Establishes Company’s Addressable Market as a Lifecycle Engineering Services Company and Reinforces Focus on Exemplary Outcomes

HYDERABAD, India, Aug. 25, 2026 /PRNewswire/ — Cyient today unveiled its new brand positioning and promise, ‘Nothing Less,’ reflecting its evolution as a Global Lifecycle Engineering Services leader and its commitment to helping customers achieve exemplary outcomes in an increasingly complex, intelligence-driven world. The refreshed positioning brings intelligent engineering to every stage of the lifecycle, combining deep engineering expertise, domain knowledge, human intelligence, and AI applied in context.

The new positioning will be the focal point of Cyient’s go-to-market strategy, representing an engineering portfolio that partners with customers across the full life cycle of their products and the assets that power their businesses, creating value measured over decades rather than projects.

The new brand reflects both the company’s capability and ways of working. Intelligent Engineering defines what we do: bringing together engineering, digital, and industry expertise to help customers improve performance, reliability, and growth. Embracing Intelligence defines how we do it: harnessing the combined power of people, data, and AI to unlock better decisions and better outcomes. Together, they reinforce Cyient’s focus on delivering exemplary outcomes.

Krishna Bodanapu, Executive Vice Chairman & Managing Director, Cyient, said, “Since our founding in 1991, Cyient has partnered with some of the world’s leading organizations to solve complex engineering challenges and deliver outcomes that matter. We have, over the years, built deep domain expertise across the industries and earned the trust of customers operating in some of the most demanding and mission-critical environments. This legacy of engineering excellence, customer focus, and value-driven ownership has shaped who we are today and sets the foundation for our next phase of growth.”

Commenting on the new positioning, Sukamal Banerjee, Executive Director and Chief Executive Officer, Cyient Ltd, said, “Nothing Less is a reflection of how Cyient has evolved and where we are headed. As a Global Lifecycle Engineering Services company, we are expanding the value we deliver across the entire life of an asset, from design to manufacture to services. Competitive advantage today comes from the convergence of engineering expertise, human ingenuity, and AI-driven intelligence. Cyient brings these strengths together in a unique way. We help customers solve complex challenges faster, improve outcomes, and unlock greater value throughout the lifecycle.”

The new positioning is also anchored in Cyient’s Values FIRST framework—anchored in Fairness, Integrity, Respect, Sincerity, and Transparency. These values continue to guide how the company works with customers, associates, partners, and communities as it brings the “Nothing Less” promise to life.

About Cyient

Cyient is a global lifecycle engineering services company powering mission-critical industries from design to aftermarket across products, plants, and networks. With 300+ customers and 15,000+ associates across 30+ countries, we combine human expertise, deep domain knowledge, and AI to deliver intelligent engineering for every lifecycle across Aerospace and Rail, Automotive and Mobility, Connectivity, Energy, Healthcare, Mining, Utilities, and beyond.

To learn how we deliver exemplary outcomes, nothing less, visit www.cyient.com. 

Forward-Looking Statements
Certain statements made in the press release that are not based on historical facts may be forward‑looking statements within the meaning of applicable laws and regulations. Such forward‑looking statements are subject to risks, uncertainties, and assumptions, like significant changes in the economic environment in India and overseas, regulatory and tax laws, import duties, litigation, labour relations and other factors beyond the Company’s control. Actual results may differ materially from those expressed or implied.

Cyient undertakes no obligation to publicly update or revise these forward‑looking statements, whether as a result of new information, future events, or otherwise, except as required under applicable law.

 Reshma Nair, 20:20 MSL
reshma.nair@2020msl.com
 

Joshika Rv, 20:20 MSL
joshika.rv@2020msl.com

Phalguna Hari jandhyala
Cyient

Phalguna.Harijandhyala@cyient.com

First summer vacation season after the opening of the world’s highest bridge


XINYI, CHINA – Media OutReach Newswire – 24 August 2026 – In September 2025, the Huajiang Grand Canyon Bridge in Guizhou Province was open to traffic. This super project, “the world’s highest bridge both vertically and horizontally”, brought Huajiang Village, a once-quiet Bouyei ethnic village, its first full summer vacation season.

image-1.jpeg

Since the start of the summer vacation, the village’s 15 homestays and 13 restaurants have been fully booked every day.

Guizhou Huajiang Grand Canyon Bridge, photographed in September last year (drone photo)

With the booming cool-climate economy, nowadays, Huajiang Village has seen idle farm houses turned into high‑end homestays, home‑cooked meals upgraded into special local delicacies, traditional crafts developed into cultural and creative products, and migrant workers returning home to start businesses.

The village has taken on a brand‑new look with concrete roads, tidy surroundings and growing popularity, and local people’s livelihood and happiness keeps improving.

The booming cool-climate summer tourism industry has successfully converted cultural‑tourism traffic into sustained development momentum, injecting strong impetus into comprehensive rural revitalization.

Hashtag: #GuizhouDongjingCultureCommunication

The issuer is solely responsible for the content of this announcement.

XPENG Reports Q2 2026 Results: Gross Margin Reaches 20.7%, Overseas Market Drives 25% of H1 Revenue

  • Second-quarter revenue totaled RMB19.74 billion. Quarterly gross margin reached 20.7%.
  • Overseas deliveries surpassed 20,000 units in Q2, with overseas markets contributing 25% of H1 revenue.
  • Robotics business raises over US$900 million, at a post-money valuation of over US$6.3 billion, marking the largest single-round private financing ever recorded in China’s embodied AI industry.
  • XPENG L03 secures historic order volume at launch, with oversea deliveries of L03 expected to start in Q4, driving the company’s quarterly overseas deliveries to exceed 40,000 units.

GUANGZHOU, China, Aug. 24, 2026 /PRNewswire/ — XPENG, a leading global Physical AI company, today announced its financial results for the second quarter of 2026. 

Physical AI Commercialization Accelerates: Robotics business raises over US$900 million, VLA 2.0 Model First Major Upgrade.

During the earnings call, He Xiaopeng, Chairman and CEO, detailed the company’s ongoing transformation into a global leader in the physical AI world.

  • Humanoid Robot: XPENG Robotics business raises over US$900 million, at a post-money valuation of over US$6.3 billion, marking the largest single-round private financing ever recorded in China’s embodied AI industry. Recently, XPENG’s IRON humanoid robot has reached multiple R&D milestones and is about to release capability previews. In 2027, XPENG IRON will officially launch and begin large-scale deliveries in China and overseas to external customers in the retail and service sectors. Monthly production capacity can be rapidly ramped up to several thousand units by 2027 in response to market demand.
  • ADAS: Starting at the end of August, XPENG’s VLA 2.0 model will undergo its first major upgrade in China. The new version will also integrate VLA and VLM models to achieve integrated cockpit and autonomous driving functionality, bringing selected L4-level capabilities developed for XPENG Robotaxi to passenger vehicles. The goal is to obtain regulatory approval in Europe first in the first half of 2027 and begin deliveries to overseas users.
  • Robotaxi: Mass-produced Robotaxi powered by VLA 2.0 has completed more than 2,000 internal test orders in Guangzhou and validated the full end-to-end process for trial passenger operations. Our goal is to achieve passenger-carrying operations without a safety driver by 2027.

Overseas Market Enters High-Growth Trajectory, Contributes over 25% of H1 Revenue

Mr. He emphasized that despite industry-wide cost pressures, operations have remained resilient. Driven by key breakthroughs in premiumization and overseas markets, gross margin surpassed 20.7% in Q2.

In Q2, XPENG’s overseas deliveries surpassed 20,000 units for the first time, up 81% year-over-year. In H1 2026, overseas business contributed over 25% of total revenue. The average selling price exceeded €40,000, with per-vehicle revenue and gross profit at the forefront of Chinese automakers expanding globally.

In July, the GX delivered over 7,000 units in the domestic market, making it one of the top-three models in China’s NEV SUV segment priced above RMB300,000.

The flagship SUV G9L will officially launch and begin deliveries in China in September. XPENG L03, as the Next-Gen AI SUV Coupe, became a phenomenal hit after its launch, with orders breaking new records for XPENG’s entire lineup. Overseas deliveries of the L03 are expected to begin in Q4, driving firmwide quarterly overseas deliveries to exceed 40,000 units.

To accelerate the commercialization of physical AI, XPENG has recently established a group-level strategic BD team, engaging with partners both domestically and overseas to bring Turing AI chips, NGP, Robotaxi and humanoid robot technologies to global markets.

About XPENG

XPENG is a leading global Physical AI company, dedicated to bringing artificial intelligence into the physical world to reshape future mobility and smart living. Through in-house R&D, XPENG has developed a full-stack Physical AI architecture spanning Turing AI chips, world foundation models, and highly integrated software and hardware applications. This unified technology foundation of XPENG powers an expansive product portfolio of smart EVs, robotaxis, and humanoid robots, advancing the deployment of Physical AI at scale. Headquartered in Guangzhou, China, XPENG is dual-primary listed on the New York Stock Exchange and the Hong Kong Stock Exchange. With global capabilities across R&D, manufacturing, sales, and services, XPENG drives continuous technological innovation and fosters an open Physical AI ecosystem, making life smarter, safer, and better for users worldwide. For more information, please visit https://www.xpeng.com/.

For media inquiries:
XPENG PR Department
Email: pr@xiaopeng.com 

Hohhot, Inner Mongolia: Converting Prairie Winds into Computing Power


HOHHOT, CHINA – Media OutReach Newswire – 24 August 2026 – On August 22, 2026, the fourth annual Green Computing Power (Artificial Intelligence) Conference was held on the picturesque Cilechuan Grassland in Hohhot, Inner Mongolia. Centered on the theme “Building Synergy between Computing and Electricity, Exploring New Horizons in Token Economy, and Creating the Future of Artificial Intelligence Together,” the conference presented the latest research achievements, including the Green Computing Power Development Research Report (2026), and showcased pilot initiatives such as “millisecond-level urban computing” applications. Prominent companies, including ByteDance and Cambricon, signed a series of significant agreements valued at tens of billions, focusing on green intelligent computing centers and token factories.

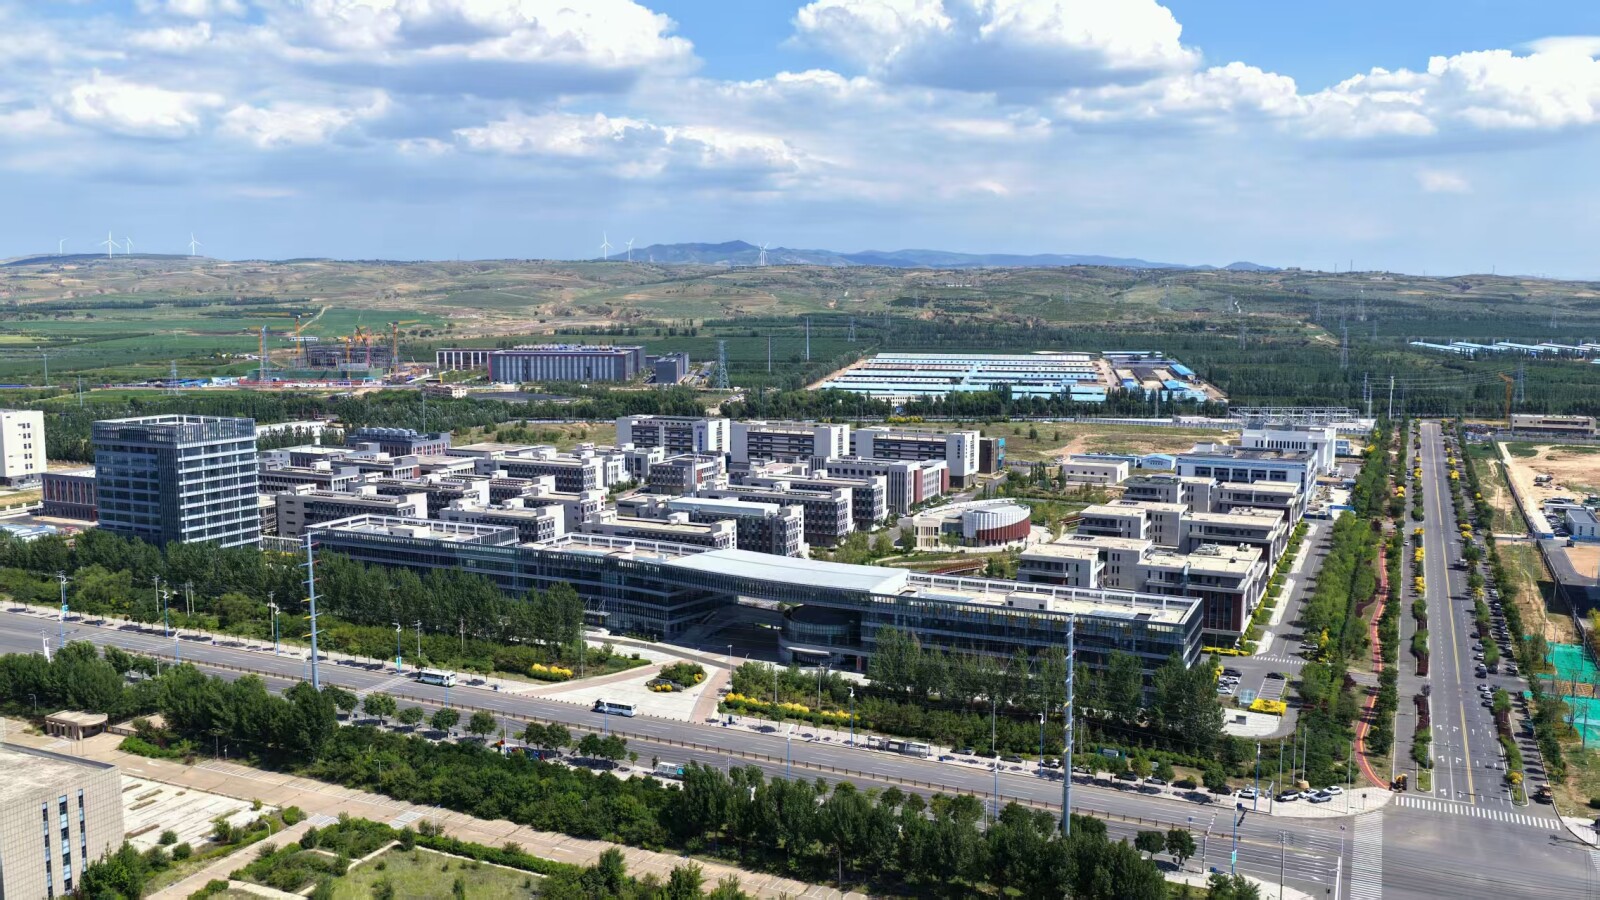
The Horinger New District Intelligent Manufacturing Industrial Park

Why has the national computing power industry turned its attention here? Part of the answer lies in this vast grassland.

Wind turbine blades turn steadily, each rotation generating 12 kilowatt-hours of green electricity. Instead of feeding into the public grid, this clean energy is transmitted via a dedicated 41-kilometer line directly to data centers located tens of kilometers away.

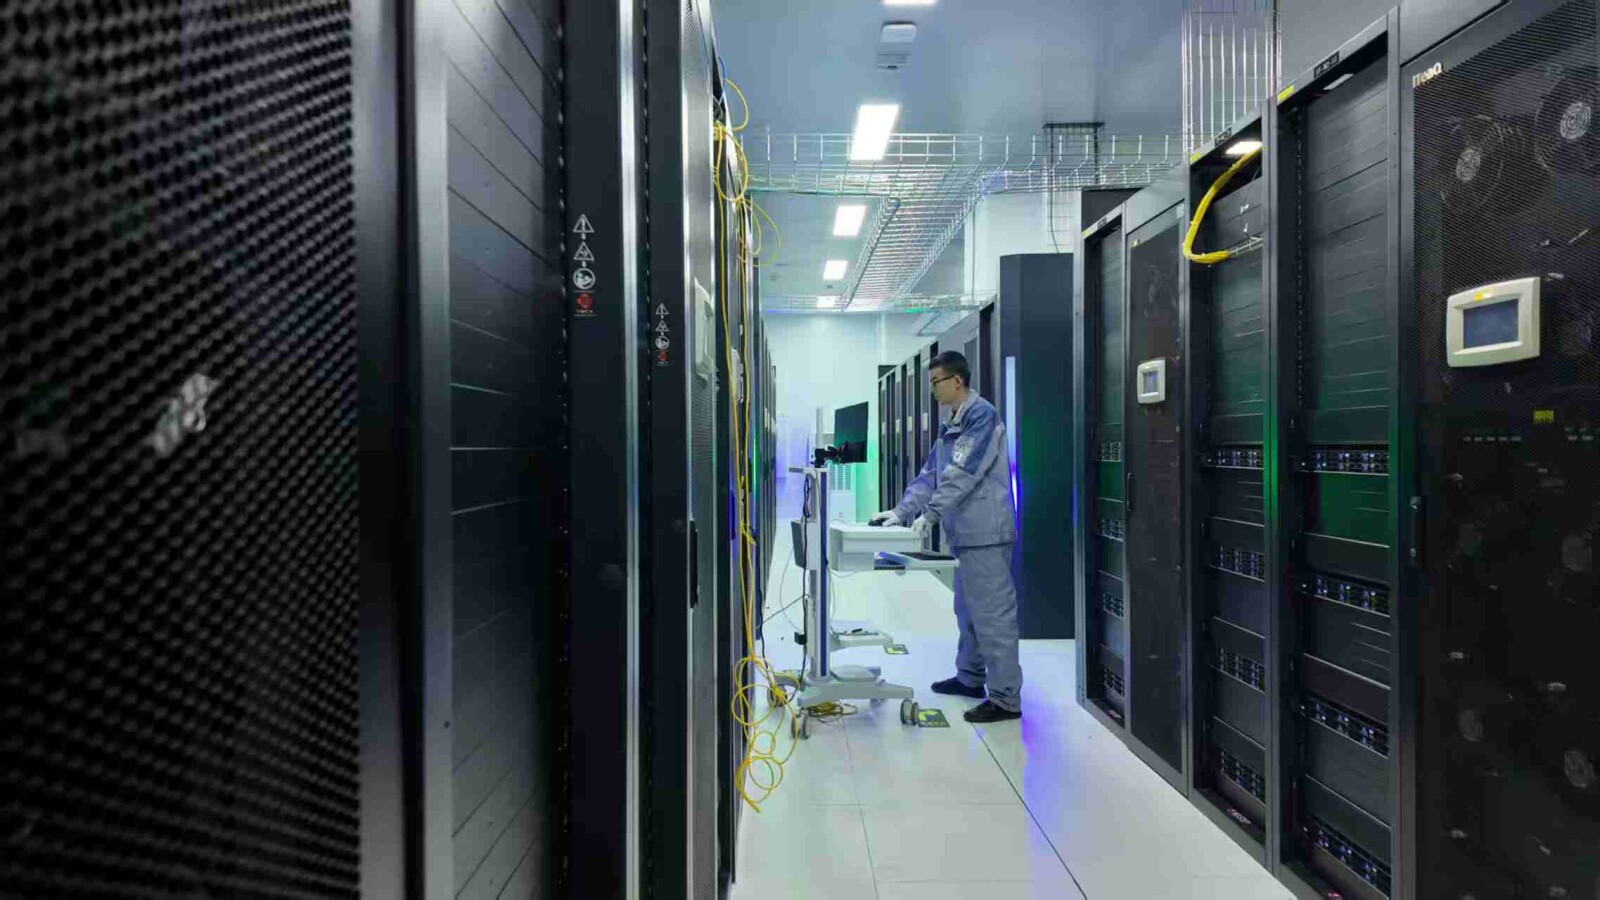
Inside the machine rooms of these centers, rows of GPU arrays operate around the clock, powered mainly by wind and solar energy.

Training large-scale AI models utilizing tens of thousands of GPUs can consume over 100 million kilowatt-hours annually. For instance, the Hohhot Intelligent Computing Center, operated by China Mobile, incurred electricity costs of approximately 290 million yuan in 2025, accounting for more than 70% of its total operating expenses. In the competition for computing power, electricity costs proved to be a decisive factor. China’s strategic response includes the “East Data West Computing” project, which redirects the high computing demand from eastern regions to resource-rich western areas. The Horinger data center cluster in Hohhot is among the country’s top ten clusters.

The city is endowed with a combination of nearly optimal conditions for the selection of data center locations. With an average annual temperature of only 7°C and over 200 days per year suitable for direct outdoor air cooling, the center achieves more than 20% savings in cooling costs. At an electricity price of about 0.36 yuan per kilowatt-hour, a large-scale GPU cluster can save around 50 million yuan annually on power expenses. Currently, Hohhot’s total computing capacity reaches 150,000 P, with green electricity usage exceeding 80%.

However, the challenge lies in the “green” aspect itself.

Wind and solar power fluctuate with weather, while computing loads require an uninterrupted 24/7 power supply.

The local solution is an innovative “computing-electricity synergy” mechanism. China Huadian Corporation constructs a 360,000-kilowatt integrated wind-solar-storage power station, comprising 300,000 kilowatts of wind, 60,000 kilowatts of photovoltaic power, and energy storage capable of continuous four-hour regulation. A collaborative control platform collects data on wind output, solar irradiance, storage status, and computing load at millisecond intervals to dynamically allocate power: when green energy is abundant, storage systems charge and delay-tolerant computing tasks are prioritized; when green energy is limited, storage discharges, the public grid supplements power, and flexible tasks are deferred. This approach transforms power generation and consumption from a unidirectional supply model to a bidirectional interactive system.

On the consumption side, initiatives to minimize waste are also in progress. The Hohhot data center operated by China Mobile recovers waste heat from nearby power plants to provide cooling for machine rooms. The B02 machine hall has improved its Power Usage Effectiveness (PUE) from 1.315 to 1.209, resulting in annual electricity savings of 560,000 kilowatt-hours since commencing operations. Upon full operation of two machine halls, annual savings are projected to reach 10 million kilowatt-hours of electricity and 150,000 tons of water.

Operational teams are actively optimizing equipment deployment.

Today, 62 computing center projects have clustered here, including data centers of China’s three major telecom operators, 16 financial institutions, and computing nodes from Huawei, ByteDance, Kuaishou, and others. Upstream, 45 manufacturing enterprises produce servers, cabinets, and sensors locally. According to the recently published three-year action plan, by 2028, Hohhot aims to establish 10 token factories capable of producing 20 trillion tokens daily. At that time, customers will procure not only cabinets and bandwidth but also directly accessible intelligent services customized to their requirements.

The prairie winds remain constant, as does the city’s commitment to converting every kilowatt-hour of green electricity into stable and reliable computing power.

Hashtag: #Hohhot

The issuer is solely responsible for the content of this announcement.

HashKey Exchange and Franklin Templeton to Bring OnChain U.S. Government Liquidity Fund to Asia

HONG KONG, Aug. 24, 2026 /PRNewswire/ — HashKey Holdings Limited (3887.HK), a leading comprehensive digital asset company in Asia, announced that its licensed trading platform, HashKey Exchange (“HashKey”), has today announced a collaboration with established global asset manager Franklin Templeton to distribute its flagship tokenized money market fund, Franklin OnChain U.S. Government Liquidity Fund (grBENJI), to digital asset investors in Asia.

The collaboration will commence with the launch of the Franklin OnChain U.S. Government Liquidity Fund (grBENJI) on the HashKey Exchange Earn Channel on August 24, 2026. The product will provide eligible digital asset investors with access to a fund investing primarily in U.S. government money market instruments and U.S. dollar cash assets through blockchain-enabled infrastructure.

As the digital asset ecosystem continues to evolve, market participants are increasingly seeking yield-generating instruments backed by real-world assets. This collaboration represents an important step toward bridging traditional financial markets with compliant digital asset infrastructure, supporting the broader development of on-chain capital markets.

Through this collaboration, Franklin Templeton expands the reach of its tokenized fund solutions into regulated digital asset markets across Asia. For HashKey Exchange, the partnership strengthens its Earn ecosystem by introducing regulated tokenized investment products and deepening collaboration with leading global asset managers.

Combining Franklin Templeton’s decades of global investment expertise with HashKey Exchange’s regulated digital asset infrastructure, the collaboration aims to create a compliant and scalable gateway for institutional and professional investors to access tokenized financial products from established global asset managers.

Building on the launch of grBENJI, both companies will continue to explore opportunities to expand access to tokenized products across markets and asset classes, while remaining committed to advancing transparent and compliant RWA solutions.

Haiyang Ru, CEO of HashKey Exchange BG, stated: “Partnering with a global asset management leader like Franklin Templeton marks a monumental milestone for HashKey Exchange and the broader Asian digital asset landscape. By bringing the Franklin OnChain U.S. Government Liquidity Fund (grBENJI) onto our Earn channel, we are directly addressing the surging institutional demand for compliant, real-world asset (RWA) yield solutions. This collaboration bridges the gap between traditional finance and secure, regulated on-chain infrastructure, setting a new benchmark for transparency and capital market innovation across the region.”

Chetan Karkhanis, SVP, Digital Assets Client Engagement, Franklin Templeton, commented: “We are excited to launch our tokenized money market fund on the HashKey Exchange platform. Leveraging blockchain technology, the Fund provides investors with enhanced transparency, security, accessibility, speed, and cost efficiency. Launching on HashKey is a key step in broadening our reach, tapping into their rapidly expanding client base of digital-native banking and wealth platforms alongside established institutional clients, while advancing our digital assets and innovation strategy in the region.”

He added, “We look forward to deepening this partnership by expanding beyond tokenized money market funds into other tokenized products over time, leveraging HashKey’s multi-jurisdictional platform spanning Hong Kong, Singapore, Tokyo, Dubai and Bermuda.”

*This product is available to professional investors only and is not available for offering to the public in Hong Kong.

About HashKey Exchange

HashKey Exchange is a digital asset exchange under the listed company HashKey Holdings Limited (3887.HK), dedicated to setting a new benchmark for virtual asset exchanges in terms of compliance, fund protection, and platform security. Hash Blockchain Limited (HashKey Exchange) is among the first batch of licensed retail virtual asset exchanges in Hong Kong. It has received approval from the Securities and Futures Commission (SFC) of Hong Kong to operate a virtual asset trading platform under Type 1 (Dealing in Securities) and Type 7 (Providing Automated Trading Services) licenses under the Securities and Futures Ordinance, as well as a license under the Anti-Money Laundering Ordinance.

HashKey Exchange holds ISO 27001 (Information Security) and ISO 27701 (Data Privacy) management system certifications. In compliance with laws and regulations, HashKey Exchange does not offer services to users in Mainland China, the United States, or certain other jurisdictions.

HashKey Exchange Press Release and Advertising Standard Terms and Disclaimer

About Franklin Templeton
Franklin Templeton is a trusted investment partner, delivering tailored solutions that align with clients’ strategic goals. With deep portfolio management expertise across public and private markets, we combine investment excellence with cutting-edge technology. Since our founding in 1947, we have empowered clients through strategic partnership, forward-looking insights, and continuous innovation – providing the tools and resources to navigate change and capture opportunity.

With US$1.80 trillion in assets under management as of July 31, 2026, Franklin Templeton operates globally in more than 35 countries.

To learn more, visit https://www.franklinresources.com/all-sites and follow us on LinkedIn.