Home Blog Page 456

Zhengye Biotechnology Holding Limited Announces Fiscal Year 2025 Financial Results

JILIN, China, April 29, 2026 /PRNewswire/ — Zhengye Biotechnology Holding Limited (Nasdaq: ZYBT) (the “Company” or “Zhengye”), a veterinary vaccine manufacturer that encompasses research, development, manufacturing, and sales of veterinary vaccines, with a focus on livestock vaccines in China, today announced its financial results for the fiscal year ended December 31, 2025.

Mr. Songlin Song, co-chief executive officer of Zhengye, remarked, “Fiscal year 2025 was a year of resilience for Zhengye. While the broader hog market experienced low and volatile price fluctuations and government macro-control policies contributed to near-term pressure on swine vaccine demand, we remained focused on executing our strategy and driving long-term value creation. We are encouraged by the continued growth in our other vaccines segment, particularly vaccines for sheep, which contributed to improving our revenue mix. On the international front, we made progress in advancing vaccine registrations in certain overseas markets, including Egypt, Pakistan, and Vietnam, supporting our long-term expansion strategy.”

“We continued to prioritize research and development as a core driver of our future growth. In 2025, we achieved several regulatory milestones, including the approval of two National Category I New Veterinary Drugs and one National Category III New Veterinary Drug from the Ministry of Agriculture and Rural Affairs. We also secured new product approvals across multiple animal species, including swine, poultry, cattle, and sheep, further broadening our commercial offerings. We believe these achievements reflect our ongoing innovation efforts and support our long-term growth strategy.”

Mr. Aiden Han, co-chief executive officer of Zhengye, added, “With our Nasdaq listing, we further strengthened our capital base and financial position, providing a foundation to support our strategic priorities. We ended the year with a stronger cash position of RMB50.3 million, representing an increase from the prior year, which is expected to enhance our ability to invest in research and development, expand our product portfolio, and support future growth initiatives.”

“Looking ahead, we are encouraged by early signs of a gradual recovery in China’s swine market, with industry expectations pointing to a potential price inflection point around mid-year in 2026. We aim to deepen strategic customer engagement, strengthen our product portfolio, expand our customer service ecosystem, and selectively pursue opportunities in the companion animal sector as a new growth driver. We believe these initiatives, together with our operational foundation, will support our ability to navigate industry cycles. We are grateful for the support of our shareholders, customers, and partners, and remain committed to building on our progress as we navigate this period and lay a foundation for Zhengye’s long-term growth.”

Fiscal Year 2025 Financial Summary

  • Net revenue was RMB116.4 million (US$16.6 million) in the fiscal year ended December 31, 2025, compared to RMB186.4 million in the fiscal year ended December 31, 2024.
  • Gross profit was RMB23.9 million (US$3.4 million) in the fiscal year ended December 31, 2025, compared to RMB91.3 million in the fiscal year ended December 31, 2024.
  • Gross profit margin was 20.5% in the fiscal year ended December 31, 2025, compared to 49.0% in the fiscal year ended December 31, 2024.
  • Total operating expenses were RMB94.4 million (US$13.5 million) in the fiscal year ended December 31, 2025, compared to RMB74.9 million in the fiscal year ended December 31, 2024.
  • Net loss was RMB83.0 million (US$11.9 million) in the fiscal year ended December 31, 2025, compared to net income of RMB13.5 million in the fiscal year ended December 31, 2024.
  • Basic and diluted loss per share was RMB1.47 (US$0.21) in the fiscal year ended December 31, 2025, compared to basic and diluted earnings per share of RMB0.25 in the fiscal year ended December 31, 2024.

Fiscal Year 2025 Financial Results

Net Revenue

Net revenue was RMB116.4 million (US$16.6 million) in the fiscal year ended December 31, 2025, representing a decrease of 37.6% from RMB186.4 million in the fiscal year ended December 31, 2024.

For the years ended December 31,

2024

2025

                           (in thousands, except for percentages)

Revenue

RMB

%

RMB

US$

%

Swine vaccines

157,789

84.7

90,143

12,890

77.5

Poultry vaccines

15,506

8.3

12,480

1,785

10.7

Other vaccines

13,061

7.0

13,739

1,964

11.8

Total revenue

186,356

100

116,362

16,639

100


  • Revenue from sales of swine vaccines was RMB90.1 million (US$12.9 million) in the fiscal year ended December 31, 2025, decreased from RMB157.8 million in the fiscal year ended December 31, 2024. This decrease was primarily driven by a downturn in the hog market in 2025, characterized by low and volatile prices. Additionally, government macro-control policies aimed at reducing the inventory of productive sows to alleviate periodic oversupply contributed to the reduced demand for swine vaccines.
  • Revenue from sales of poultry vaccines was RMB12.5 million (US$1.8 million) in the fiscal year ended December 31, 2025, decreased from RMB15.5 million in the fiscal year ended December 31, 2024. The decrease was primarily due to normal market fluctuations.
  • Revenue from sales of other vaccines was RMB13.7 million (US$2.0 million) in the fiscal year ended December 31, 2025, increased from RMB13.1 million in the fiscal year ended December 31, 2024. The increase in sales of other vaccines was caused by the increased sales of the vaccines for sheep. 

Cost of Revenue

Cost of revenue was RMB92.5 million (US$13.2 million) in the fiscal year ended December 31, 2025, representing a decrease of 2.7% from RMB95.1 million in the fiscal year ended December 31, 2024. The decrease was mainly due to the decrease in the cost of swine vaccines.

Gross Profit

Gross profit was RMB23.9 million (US$3.4 million) in the fiscal year ended December 31, 2025, decreased from RMB91.3 million in the fiscal year ended December 31, 2024.

Gross profit margin was 20.5% in the fiscal year ended December 31, 2025, decreased from 49.0% in the fiscal year ended December 31, 2024, mainly due to the lower sales price and unchanged fixed cost.

Operating Expenses

Total operating expenses were RMB94.4 million (US$13.5 million) in the fiscal year ended December 31, 2025, increased from RMB74.9 million in the fiscal year ended December 31, 2024.

  • Sales and marketing expenses were RMB43.9 million (US$6.3 million) in the fiscal year ended December 31, 2025, increased from RMB41.3 million in the fiscal year ended December 31, 2024. The increase in sales and marketing expenses was primarily due to higher payroll for sales staffs, and increased advertising expenses and entertainment, partially offset by a decrease in marketing promotion expenses.
  • General and administrative expenses were RMB31.0 million (US$4.4 million) in the fiscal year ended December 31, 2025, increased from RMB22.6 million in the fiscal year ended December 31, 2024. The increase in general and administrative expenses was attributed to the increase in professional technical services and in depreciation and amortization.
  • Research and development expenses were RMB18.0 million (US$2.6 million) in the fiscal year ended December 31, 2025, increased from RMB12.8 million in the fiscal year ended December 31, 2024. The increase in research and development expenses mainly resulted from an increase in research and development projects, which led to an increase in materials.

Net Income (Loss)

Net loss was RMB83.0 million (US$11.9 million) in the fiscal year ended December 31, 2025, compared to net income of RMB13.5 million in the fiscal year ended December 31, 2024.

Basic and Diluted Earnings (Loss) per Share

Basic and diluted loss per share was RMB1.47 (US$0.21) in the fiscal year ended December 31, 2025, compared to basic and diluted earnings per share of RMB0.25 in the fiscal year ended December 31, 2024.

Financial Condition

As of December 31, 2025, the Company had cash of RMB50.3 million (US$7.2 million), compared to RMB18.6 million as of December 31, 2024.

Net cash provided by operating activities was RMB13.3 million (US$1.9 million) in the fiscal year ended December 31, 2025, compared to RMB41.0 million in the fiscal year ended December 31, 2024.

Net cash used in investing activities was RMB12.6 million (US$1.8 million) in the fiscal year ended December 31, 2025, compared to RMB27.7 million in the fiscal year ended December 31, 2024.

Net cash provided by financing activities was RMB32.3 million (US$4.6 million) in the fiscal year ended December 31, 2025, compared to net cash used in financing activities of RMB22.1 million in the fiscal year ended December 31, 2024.

Exchange Rate Information

This announcement contains translations of certain foreign currency amounts into U.S. dollars for the convenience of the reader. Unless otherwise stated, all translations of Renminbi (“RMB”) into U.S. dollars (“US$”) were made at RMB6.9931 to US$1.00, the exchange rate set forth in the H.10 statistical release of the Federal Reserve Board on December 31, 2025.

About Zhengye Biotechnology Holding Limited

Through Jilin Zhengye Biological Products Co., Ltd., the Company’s operating entity based in Jilin, China, Zhengye Biotechnology Holding Limited focuses on the research, development, manufacturing, and sales of veterinary vaccines, with an emphasis on vaccines for livestock. For over 20 years, the operating entity has been committed to enhancing the health of animals. The operating entity has 50 veterinary vaccines, including vaccines for swine, cattle, goats, sheep, poultry, and dogs. The operating entity’s products are available in 29 provincial regions across China and are exported overseas to Vietnam, Pakistan, and Egypt as of the date of this press release. The operating entity has three GMP veterinary vaccine production floors (including 13 GMP vaccine production lines), one quality examination center, and one animal facility for vaccine development. The operating entity has 49 employees who have over a decade of tenure and experience in the veterinary vaccine industry. For more information, please visit the Company’s website: http://ir.jlzybio.com.

Forward-Looking Statements

This announcement contains statements that may constitute “forward-looking” statements which are made pursuant to the “safe harbor” provisions of the U.S. Private Securities Litigation Reform Act of 1995. These forward-looking statements involve known and unknown risks and uncertainties and are based on the Company’s current expectations and projections about future events that the Company believes may affect its financial condition, results of operations, business strategy, and financial needs. Investors can find many (but not all) of these statements by the use of words such as “approximates,” “believes,” “hopes,” “expects,” “anticipates,” “estimates,” “projects,” “intends,” “plans,” “will,” “would,” “should,” “could,” “may” or other similar expressions in this announcement. Statements that are not historical facts, including statements about the Company’s beliefs, plans, and expectations, are forward-looking statements. Forward-looking statements involve inherent risks and uncertainties. The Company undertakes no obligation to update or revise publicly any forward-looking statements to reflect subsequent occurring events or circumstances, or changes in its expectations, except as may be required by law. Although the Company believes that the expectations expressed in these forward-looking statements are reasonable, it cannot assure you that such expectations will turn out to be correct, and the Company cautions investors that actual results may differ materially from the anticipated results and encourages investors to review other factors that may affect its future results in the Company’s registration statement and other filings with the United States Securities and Exchange Commission.

For more information, please contact:

Zhengye Biotechnology Holding Limited 
Investor Relations Department
Email: ir@jlzybio.com

Ascent Investor Relations LLC
Tina Xiao
Phone: +1-646-932-7242
Email: investors@ascent-ir.com


ZHENGYE BIOTECHNOLOGY HOLDING LIMITED

CONSOLIDATED BALANCE SHEETS

(Amounts in thousands of RMB and US$, except for number of shares)

As of December 31,

2024

2025

RMB

RMB

US$

ASSETS

Current assets:

Cash

18,604

50,332

7,197

Restricted cash

2

2

Short-term investments

1,433

1,560

223

Notes receivable, net

25,592

Accounts receivable, net

59,563

18,485

2,643

Advance to suppliers

10,788

2,208

316

Inventories, net

58,220

39,166

5,601

Prepayments and other current assets, net

2,626

25,667

3,670

Other receivable-a related party

738

Total current assets

177,566

137,420

19,650

Non-current assets:

Property, plant and equipment, net

255,164

236,812

33,863

Land use rights, net

7,930

7,673

1,097

Intangible assets, net

14,850

47,084

6,732

Right-of-use assets, net

469

67

Long-term prepayments

18,698

7,014

1,003

Deferred IPO expenses

8,048

Net deferred tax assets

10,991

Total non-current assets

315,681

299,052

42,762

Total assets

493,247

436,472

62,412

LIABILITIES AND SHAREHOLDERS’ EQUITY

Current liabilities:

Short-term loans

74,443

65,100

9,309

Current maturities of long-term loans

7,190

700

100

Operating lease liability-current

106

15

Accounts payable

42,960

44,010

6,296

Contract liabilities

3,485

4,752

680

Taxes payable

2,066

2,345

335

Amount due to related parties

146

Accrued expenses and other liabilities

5,617

3,463

495

Total current liabilities

135,907

120,476

17,230

Non-current liabilities:

Long-term loans

4,800

8,850

1,266

Operating lease liability-non-current

327

47

Deferred tax liabilities

104

15

Total non-current liabilities

4,800

9,281

1,328

Total liabilities

140,707

129,757

18,558

Commitments and contingencies

Shareholders’ equity:

Class A ordinary shares (US$0.000025 par value; 1,900,000,000
   shares authorized; 5,666,376 and 7,391,376 shares issued and
   outstanding as of December 31, 2024 and 2025, respectively)*

1

1

Class B ordinary shares (US$0.000025 par value; 100,000,000
   shares authorized; 40,000,000 and 40,000,000shares issued and
   outstanding as of December 31, 2024 and 2025, respectively)*

7

7

1

Additional paid-in capital

203,150

240,752

34,427

Statutory reserves

32,647

32,647

4,668

Retained earnings (deficit)

48,151

(21,633)

(3,099)

Accumulated other comprehensive income

3

(1,926)

(275)

Total Zhengye Biotechnology Holding Limited’s shareholders’ equity

283,959

249,848

35,722

Noncontrolling interests

68,581

56,867

8,132

Total equity

352,540

306,715

43,854

Total liabilities and equity

493,247

436,472

62,412

* As of December 31, 2025, share reclassification was retroactively restated with effective date of March 24, 2026


ZHENGYE BIOTECHNOLOGY HOLDING LIMITED

CONSOLIDATED STATEMENTS OF OPERATIONS AND COMPREHENSIVE INCOME
(LOSS)

(Amounts in thousands of RMB and US$, except for number of shares and per share data)

For the years ended December 31,

2023

2024

2025

RMB

RMB

RMB

USD

Net revenues

211,651

186,356

116,362

16,639

Cost of revenues

(94,143)

(95,061)

(92,493)

(13,227)

Gross profit

117,508

91,295

23,869

3,412

Sales and marketing expenses

(40,743)

(41,269)

(43,918)

(6,280)

General and administrative expenses

(23,592)

(22,575)

(31,006)

(4,434)

Research and development expenses

(11,901)

(12,794)

(18,013)

(2,576)

Reversal of (provision for) credit losses

3,714

1,782

(1,438)

(206)

Total operating expenses

(72,522)

(74,856)

(94,375)

(13,496)

Operating income (loss)

44,986

16,439

(70,506)

(10,084)

Other income (expenses):

Interest income

312

231

96

14

Interest expense

(4,423)

(4,043)

(3,400)

(486)

Unrealized gains on short-term investments

209

127

18

Unrealized foreign exchange gain (loss)

679

(312)

(45)

Government subsidy

2,653

733

2,252

322

Other expenses (income)

234

146

(130)

(19)

Total other expenses, net

(1,224)

(2,045)

(1,367)

(196)

Income (loss) before income taxes

43,762

14,394

(71,873)

(10,280)

Income tax expenses

(6,253)

(924)

(11,095)

(1,587)

Net income (loss)

37,509

13,470

(82,968)

(11,867)

Net (income) loss attributable to noncontrolling
   interests

(6,052)

(2,159)

13,184

1,885

Net income (loss) attributable to the Zhengye
   Biotechnology Holding Limited’s shareholders

31,457

11,311

(69,784)

(9,982)

Comprehensive income (loss)

Net income (loss)

37,509

13,470

(82,968)

(11,867)

Other comprehensive income (loss)

Foreign currency translation adjustment

3

(1,929)

(275)

Total comprehensive income (loss)

37,509

13,473

(84,897)

(12,142)

Total comprehensive (income) loss attributable to
   non-controlling interest

(6,052)

(2,159)

13,184

1,885

Total comprehensive income (loss) attributable to
   the Zhengye Biotechnology Holding Limited’s
   shareholders

31,457

11,314

(71,713)

(10,257)

Earnings (loss) per share:

-Basic and diluted – Class A Ordinary shares

0.69

0.25

(1.47)

(0.21)

-Basic and diluted – Class B Ordinary shares

0.69

0.25

(1.47)

(0.21)

Weighted average shares outstanding used in
   calculating basic and diluted earnings per share:

Ordinary shares – basic and diluted

45,666,376

45,666,376

47,349,869

47,349,869

Basic and diluted – Class A Ordinary shares*

5,666,376

5,666,376

7,349,869

7,349,869

Basic and diluted – Class B Ordinary shares*

40,000,000

40,000,000

40,000,000

40,000,000

* As of December 31, 2025, share reclassification was retroactively restated with effective date of March 24, 2026.


ZHENGYE BIOTECHNOLOGY HOLDING LIMITED

CONSOLIDATED STATEMENTS OF CASH FLOWS

(Amounts in thousands of RMB and US$, except for number of shares)

For the years ended December 31,

2023

2024

2025

RMB

RMB

RMB

US$

CASH FLOWS FROM OPERATING ACTIVITIES

Net income (loss)

37,509

13,470

(82,968)

(11,867)

Adjustments to reconcile net income (loss) to net cash
   provided by operating activities:

Depreciation and amortization

23,912

24,163

25,883

3,702

Amortization of operating lease right-of-use assets

72

10

Provision for (reversal of) credit losses

(3,714)

(1,782)

1,438

206

Impairment for inventory

10,026

5,962

12,801

1,831

Loss on disposal of property and equipment

187

174

Deferred tax expenses

541

924

11,095

1,587

Unrealized gains on short-term investments

(209)

(127)

(18)

Unrealized foreign exchange (gain) loss

(679)

312

45

Changes in operating assets and liabilities:

Notes receivable

8,310

(3,752)

20,962

2,998

Accounts receivable

31,044

16,345

39,709

5,678

Advance to suppliers

(619)

(7,677)

1,979

283

Inventories

(12,902)

(5,882)

6,252

894

Prepayments and other current assets

(563)

(1,283)

(23,306)

(3,333)

Other receivable-a related party

(738)

738

106

Operating leases liabilities

(108)

(15)

Accounts payable

(35,613)

(404)

(3,362)

(478)

Taxes payable

(7,702)

(229)

279

40

Contract liabilities

(715)

(400)

1,267

182

Accrued expense and other liabilities

(582)

2,698

417

60

Other payables – non-current

(197)

(393)

Net cash provided by operating activities

48,184

41,046

13,333

1,911

CASH FLOWS FROM INVESTING ACTIVITIES

Loans to related party

(7,000)

(1,001)

Repayment of lending to related party

7,000

1,001

Purchase of short-term investments

(1,224)

Purchase of property, plant and equipment

(7,396)

(13,587)

(1,008)

(144)

Prepayment for purchase of intangible assets

(4,204)

(14,186)

(11,622)

(1,662)

Proceeds from disposal of property, plant and
   equipment

1,059

108

Net cash used in investing activities

(11,765)

(27,665)

(12,630)

(1,806)

CASH FLOWS FROM FINANCING ACTIVITIES

Proceeds from loans

79,860

90,122

70,468

10,077

Repayment of loans

(54,890)

(92,860)

(82,562)

(11,806)

Repayment of related parties

(146)

(20)

Proceeds from related parties

146

Dividend payment to shareholders

(39,452)

(16,023)

Deferred IPO expenses

(4,497)

(3,514)

Proceeds from initial public offering

43,080

6,160

Shareholder contribution

1,470

210

Net cash provided by (used in) financing activities

(18,979)

(22,129)

32,310

4,621

Effect of exchange rate changes on cash

168

(1,285)

(190)

Net increase (decrease) in cash and restricted cash

17,440

(8,580)

31,728

4,536

Cash and restricted cash at beginning of year

9,746

27,186

18,606

2,661

Cash and restricted cash at end of year

27,186

18,606

50,334

7,197

SUPPLEMENTAL DISCLOSURE OF CASH
   FLOW INFORMATION:

Cash paid for:

Interest

4,423

3,985

3,356

480

Income taxes

10,486

116

NON-CASH INVESTING AND FINANCING
   ACTIVITIES:

Liabilities assumed in connection with purchase of
   property, plant and equipment

2,345

8,633

1,101

157

Liabilities assumed in connection with purchase of
   intangible asset

3,602

515

Right of use assets obtained in exchange for operating
   lease obligation

541

77

Reclassification of IPO expenses into additional paid-in
   capital

8,663

1,239


Piramal Pharma Limited Announces Results for Q4 and Full-year FY26

MUMBAI, India, April 29, 2026 /PRNewswire/ — Piramal Pharma Limited (NSE: PPLPHARMA | BSE: 543635), a leading global pharmaceutical, health and wellness company, today announced its standalone and consolidated results for the Fourth Quarter (Q4) and Full-year ended 31st March 2026.

Consolidated Financial Highlights

(in ₹ Crores or as stated)

Particulars

Q4FY26

Q4FY25

YoY %

FY26

FY25

YoY %

Revenue from Operations

2,752

2,754

(0) %

8,869

9,151

(3) %

   CDMO

1,708

1,788

(4) %

4,915

5,447

(10) %

   CHG

755

705

7 %

2,703

2,633

3 %

   PCH

320

274

17 %

1,274

1,093

17 %

EBITDA

507

603

(16) %

1,135

1,580

(28) %

EBITDA Margin

18 %

22 %

13 %

17 %

PAT Before Expectational Item

167

154

9 %

(130)

91

NM

Exceptional Item1

(176)

NM

(196)

NM

PAT After Expectational Item

(9)

154

NM

(326)

91

NM

1. During the quarter, the management has recognized an impairment loss of ₹. 176Cr in relation to intangible assets under development. Based on a reassessment incorporating changes in market conditions and updated commercial viability estimates, management concluded that the probable future economic benefits from the asset are no longer expected to be adequate to justify further capital deployment.  Accordingly, the carrying amount has been written down in full.

Key Highlights

  • Revenue – Growth was impacted by inventory destocking, slower early-stage order inflows in H1FY26, and softer traction in inhalation anesthesia across ex‑US markets. Adjusted for inventory destocking, we delivered YoY growth in Q4 and FY26.
  • EBITDA Margin – Despite lower revenues, impact on EBITDA was partly offset by our efforts towards cost optimization and operational excellence.
  • Capex – US$94Mn invested in FY26 across growth and maintenance projects. Lexington and Riverview expansions on track. Seeing good customer interest.
  • Net Debt – No increase over FY25.

Nandini Piramal, Chairperson, Piramal Pharma Limited said, “FY26 was a transitional year, shaped by external disruptions and certain business-specific factors. Despite these challenges, we exited the year on a stronger note, with clear momentum across all our businesses. The meaningful recovery in biopharma funding seen from Sep’25,  is translating into good RFP momentum and healthy pick up in order inflows in our  CDMO business. In the CHG business, the recently completed Kenalog® acquisition alongside ramp up of inhalation anesthesia sales in ex-US markets are expected to be key growth drivers. Our Consumer Healthcare business is also well positioned to sustain its growth momentum with margin improvement driven by Power Brands and rapid growth in ecommerce.

Overall, all three businesses are well positioned to deliver growth in FY27, accompanied by accelerated growth in EBITDA and PAT.”

Key Business Highlights

Contract Development and Manufacturing Organization (CDMO):

  • Healthy traction in RFPs and order inflows in H2FY26 driven by stronger US biopharma funding (up YoY 75% in H2FY26, 30% in FY26) and M&A activity. (Industry Source)
  • Overseas sites seeing rising demand from shifting customer geographical preferences and strong growth in differentiated areas such as ADC, HP API, on‑shore injectables and drug product capabilities.
  • US$90Mn Capex on track to scale sterile injectable and payload-linker capacities at Lexington and Riverview sites.
  • Net Promoter Score of 60 – surpassing industry average. Meaningful improvement in execution with stronger performance across key operational matrices, driven by our operational excellence initiatives.
  • 209 customer site audits in FY26 vs. 165 in FY25 — highest ever. Reflecting heightened customer engagement, deeper technical interactions, and the growing complexity of programs we support.
  • Maintained our Best-in-Class Quality Track Record – Successfully closed 38 regulatory inspections, including 3 USFDA inspections in FY26. Continue to maintain our ‘Zero OAI’ status.

Complex Hospital Generics (CHG):

  • Completed Kenalog® acquisition

    – Upfront consideration of US$35Mn, and contingent consideration of up to US$65Mn.
    – Broadens CHG portfolio, adds revenues with minimal incremental cost, and expands presence in US, Europe & Asia Pacific.
    – Niche brand with complex manufacturing process. EBITDA margins in line with CHG business.

  • Inhalation Anesthesia (IA) 

    – Continue to maintain leadership with 47% market share – up from 45% in Mar’24. (Source:- IQVIA)
    – Initiated Sevoflurane supplies from lower cost Digwal facility in select RoW markets. Expect traction to build going ahead.

  • Intrathecal Therapy – Maintained our #1 Rank in intrathecal Baclofen segment in the US. (Source:- IQVIA)
  • Injectable Pain Management – Continue to work with our supplier to resolve supply constraints.

Piramal Consumer Healthcare (PCH):

  • Power Brands continued growth momentum with 24% YoY growth in FY26, contributing 52% to PCH sales. Little’s, Lacto Calamine, CIR, and i-range remained primary driver of growth.
  • New Product Launches – Fewer, high‑potential product launches with better success rates. Launched 31 new products and SKU in FY26. Focus on premiumization of portfolio.
  • E-commerce sales grew at 48% rate YoY in FY26, contributing about 27% to PCH sales. Evolve product mix toward premium offerings and high margin channel (e.g. quick commerce).
  • Invested about 12% of PCH sales on Media and Trade Promotion in FY26. Optimizing the media mix – Social Media, Television, Influencers, etc.

Consolidated Profit and Loss Statement

(in ₹ Crores or as stated)

Particulars

Quarterly

Full-year

Q4FY26

Q4FY25

YoY  %

Q3FY26

QoQ  %

FY26

FY25

YoY  %

Revenue from Operations

2,752

2,754

(0) %

2,140

29 %

8,869

9,151

(3) %

Other Income

46

42

10 %

43

7 %

213

135

58 %

Total Income

2,798

2,796

0 %

2,183

28 %

9,082

9,286

(2) %

Material Cost

1,056

955

11 %

786

34 %

3,239

3,232

0 %

Employee Expenses

586

612

(4) %

600

(2) %

2,416

2,307

5 %

Other Expenses

650

626

4 %

558

16 %

2,293

2,167

6 %

EBITDA

507

603

(16) %

239

112 %

1,135

1,580

(28) %

Interest Expenses

83

104

(20) %

89

(7) %

341

422

(19) %

Depreciation

218

243

(10) %

213

3 %

831

816

2 %

Share of Net Profit of Associates

14

16

(16) %

10

32 %

57

73

(22) %

Profit Before Tax

219

273

(20) %

(53)

NM

20

415

(95) %

Tax

52

119

(57) %

42

22 %

150

324

(54) %

Net Profit after Tax

167

154

9 %

(95)

NM

(130)

91

NM

Exceptional item1

(176)

NM

(41)

NM

(196)

NM

Net Profit after Tax after Exceptional Item

(9)

154

NM

(136)

NM

(326)

91

NM

  1. During the quarter, the management has recognized an impairment loss of Rs. 176Cr in relation to intangible assets under development. Based on a reassessment incorporating changes in market conditions and updated commercial viability estimates, management concluded that the probable future economic benefits from the asset are no longer expected to be adequate to justify further capital deployment.  Accordingly, the carrying amount has been written down in full.

Consolidated Balance Sheet

(in ₹ Cr.)

   Key Balance Sheet Items

As at

31-Mar-26

31-Mar-25

Total Equity

8,162

8,125

Net Debt

4,140

4,199

Total

12,302

12,324

Net Fixed Assets

9,784

9,110

    Tangible Assets

4,843

4,534

    Intangible Assets including goodwill

3,841

3,599

    CWIP (including IAUD2)

1,100

977

Net Working Capital

2,057

2,798

Other Assets3

462

416

Total Assets

12,302

12,324

2. IAUD – Intangible Assets Under Development; 3. Other Assets include Investments and Deferred Tax Assets (Net)

Earnings Conference Call

Piramal Pharma Limited will be hosting a conference call for investors / analysts on 29th April 2026 from 9:30 AM to 10:15 AM (IST) to discuss its Q4 and full-year FY26 Results.

The dial-in details for the call are as under:

Event

Location & Time

Telephone Number

Conference call on 29th April 2026

India – 09:30 AM IST

+91 22 6280 1461 / +91 22 7115 8320 (Primary Number)

1 800 120 1221 (Toll free number)

USA – 12:00 AM

(Eastern Time – New York)

Toll free number

18667462133

UK – 05:00 AM

(London Time)

Toll free number

08081011573

Singapore – 12:00 PM

(Singapore Time)

Toll free number

8001012045

Hong Kong – 12:00 PM

(Hong Kong Time)

Toll free number

800964448

Express Join with Diamond Pass™

Please use this link for prior registration to reduce wait time at the time of joining the call –Click here

About Piramal Pharma Limited:

Piramal Pharma Limited (PPL, NSE: PPLPHARMA I BSE: 543635), offers a portfolio of differentiated products and services through its 171 global development and manufacturing facilities and a global distribution network in over 100 countries. PPL includes Piramal Pharma Solutions (PPS), an integrated contract development and manufacturing organization; Piramal Critical Care (PCC), a complex hospital generics business; and Piramal Consumer Healthcare (PCH) business, selling over-the-counter consumer and wellness products. In addition, one of PPL’s associate companies, Abbvie Therapeutics India Private Limited, a joint venture between Abbvie and PPL, has emerged as one of the market leaders in the ophthalmology therapy area in the Indian pharma market. Further, PPL has a strategic minority investment in Yapan Bio Private Limited, that operates in the biologics / bio-therapeutics and vaccine segments.

For more information, visit:  Piramal Pharma | LinkedIn

1. Includes one facility via PPL’s minority investment in Yapan Bio.

Logo – https://laotiantimes.com/wp-content/uploads/2026/04/piramal_pharma_limited_logo.jpg

Ningbo’s “Eco+” Integration Practice showcased at SCO forum

NINGBO, China, April 9, 2026 /PRNewswire/ — The Shanghai Cooperation Organization’s (SCO) Green and Sustainable Development Forum was held in Ningbo, Zhejiang province, April 28–30. At this international event focused on green, low–carbon transition, Ningbo showcased concrete examples of harmonious coexistence between people and nature.

Meishan Port — Zhejiang’s first “Green Power Terminal” and a global benchmark for green porttransformation — reduces carbon emissions by about 15,000 tons annually.


An abandoned quarry has been converted into an international racetrack, whose engine roars have stimulated a growing cultural and tourism sector. A once–barren “firewood trail” has been upgraded into a national mountaineering route, spawning distinctive local industries now known as the “Hometown of China’s Sports Walking Sticks” and the “Capital of China’s Flashlights.” Ningbo continues to advance its “Eco+” integration model, turning ecological assets into industrial momentum, development potential and measurable gains in shared prosperity. The city has developed a practical path for realizing the value of lucid waters and lush mountains, offering a replicable “Ningbo model” for green, low–carbon urban transformation worldwide.

In Beilun, more than 500 species have been recorded, and the district has been designated a UN “Biodiversity Charming City.” From the revitalized Meishan Bay in Beilun to the misty expanse of Dongqian Lake in Yinzhou and the historic allure of Moon Lake in Haishu, local authorities are using the “golden key” of ecological governance to revive dormant green mountains and clear waters. Notably, Ningbo’s ecological governance goes beyond mountain repair and water treatment: it integrates “Eco+” development from the source through unified planning and coordinated implementation—protecting ecological foundations while preserving space for industry. This forward–looking approach has produced a win–win outcome for ecology and development; along Meishan Bay’s shore, cultural tourism and leisure industries have rapidly clustered, receiving more than 2 million visitors annually.

In Fenghua, the “Common Prosperity Studio” initiative has built a full–chain platform integrating “5G + IoT + Agriculture,” and introduced a model that combines village–collective fixed–rent leasing, professional enterprise operation and flexible farmer participation. In Yuyao, Hemudu pioneered China’s first ecological integrated farming of breeding soft–shelled turtles in water oat fields, balancing ecological protection, food security and farmers’ income growth. Zhenhai Refining & Chemical has established China’s first “Zero–Waste Petrochemical Base,” recognized as a national model case of a “Zero–Waste Industrial Park.”

Leveraging its mountain and sea resources, Ningbo has deepened chain–based integration of “Ecology + Cultural Tourism + Sports + Manufacturing,” continuously converting ecological value into tangible benefits for residents. Ninghai has transformed abandoned ancient paths into a 500–km national mountaineering trail and established a national sports–industry demonstration base. Xiangshan has used the Asian Games to invigorate coastal tourism and open channels for converting marine ecological value. Yinzhou and Haishu have developed biodiversity–friendly districts and townships, fostering new sectors such as educational tourism and cultural–creative industries.

To ensure green development proceeds steadily and sustainably, Ningbo is building a multi–stakeholder governance system that includes government, enterprises and the public. Ninghai has pioneered a “Soil and Forestland Bank,” using financial instruments to unlock the value of forestry resources. Yinzhou, Cixi and other areas have mobilized broad public participation in ecological protection, creating a co–construction and shared–benefits model that supports ongoing ecological value realization.

XGIMI TITAN Noir Series Surpasses $10 Million in Kickstarter Funding Following Strong Global Launch

The flagship lineup introduces the world’s first Dual Intelligent Iris System and delivers cinematic 4K performance designed for large-format home entertainment.

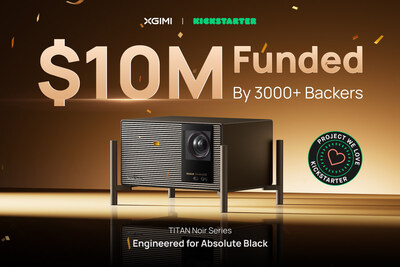
NEW YORK, April 29, 2026 /PRNewswire/ — XGIMI, a global leader in premium smart projection and home entertainment, today announced that its flagship TITAN Noir Series 4K projectors have surpassed $10 million in crowdfunding on Kickstarter since open orders from April 23, marking a major milestone for the company’s most advanced projector lineup to date.

XGIMI TITAN Noir Series Surpasses $10 Million in Kickstarter Funding Following Strong Global Launch

Since launching yesterday, the campaign has attracted support from more than 3000 backers worldwide, highlighting strong early demand for premium projection solutions capable of delivering cinema-quality performance at home.

A New Benchmark for Home Cinema

The TITAN Noir Series represents XGIMI’s most advanced engineering to date, developed for home theater enthusiasts seeking uncompromising image performance across large viewing surfaces for gaming, live sports and enjoyment. Central to the lineup is the world’s first Dual Intelligent Iris System, designed to dynamically optimize light control and deliver up to 10,000:1 native contrast for deeper blacks, enhanced highlights, and lifelike shadow detail.

“This level of early support reflects the growing importance consumers are placing on image quality and viewing scale when it comes to home entertainment,” said Apollo Zhong, Founder and CEO at XGIMI. “The TITAN Noir Series was developed to address the needs of viewers who expect exceptional contrast accuracy, brightness, and clarity across large-format displays. This momentum reinforces the direction we’re taking as we continue advancing projection technology.”

Engineered for Cinematic Precision

The TITAN Noir Series launched on Kickstarter with three models – TITAN Noir Max, TITAN Noir Pro, and TITAN Noir – each designed to support different performance needs while maintaining a consistent focus on cinematic image quality and precision engineering.

The lineup offers flexible performance tiers designed to support a range of home cinema environments. All three models are now available for order, with introductory pricing as follows:

  • TITAN Noir Max: $2,999 (MSRP $5,999)
  • TITAN Noir Pro: $2,699 (MSRP $4,999)
  • TITAN Noir: $2,499 (MSRP $3,999)
Stretch Goals – Unlocked & Coming Soon

To celebrate and reward backer support, XGIMI has introduced the following milestone gifts, which will be unlocked as the campaign progresses:

  • $10M – Unlocked
    All backers will receive 2 x XGIMI Active Shutter 3D Glasses
  • $15M – Next Goal
  • $20M – Final Goal

The TITAN Noir Series Kickstarter campaign will remain live until June 9th, 2026, with shipping also beginning in June. XGIMI is also offering exclusive launch pricing on select accessories, allowing backers to customize and optimize their home cinema or living room setups.

For more information, visit the official XGIMI TITAN Noir Series Kickstarter page or XGIMI.com.

About XGIMI

Since 2013, the state-of-the-art XGIMI projectors have helped countless people worldwide to create genuinely immersive audio-visual experiences. Working with reputable partners like Google, Harman Kardon, and Texas Instruments, XGIMI builds all-in-one entertainment devices, perfected due to their user-oriented philosophy. Through industry-leading innovation, streamlined setups, and unique designs, XGIMI always strives to develop the best home and portable projectors for everyone to enjoy. XGIMI is also expanding their expertise into commercial projector technology to bring immersive experiences to more spaces. Learn more at XGIMI Projector Technology.

Bemis Associates Appoints Christina Chen as President and Chief Operating Officer

SHIRLEY, Mass., April 29, 2026 /PRNewswire/ — Bemis Associates, Inc. (“Bemis”), a global leader in bonding and material innovation, today announced the appointment of Christina Chen as President and Chief Operating Officer.

Bemis Associates, Inc., a global leader in bonding and material innovation, today announced the appointment of Christina Chen as President and Chief Operating Officer.

Chen succeeds Michael Johansen, who will continue to serve as Chief Executive Officer, focusing on enterprise strategy, innovation, global partnerships, and long‑term growth while working closely with Chen as Bemis enters its next phase of acceleration.

 “This progression for Christina and the Bemis organization welcomes in the next phase of growth and success for Bemis,” Johnansen said. “Christina is one of the strongest leaders and businesspeople I have worked with throughout my career. Over nearly two decades of working together, we have built a strong partnership, and I am confident she will be an outstanding President who will help take Bemis to new heights.”

Chen brings more than 25 years of global business leadership experience across industries spanning semiconductor manufacturing, IT hardware, commercial testing and certification services, retail branding solutions, and tape manufacturing.

She has been a key member of the Bemis Executive Leadership Team since joining in 2019, most recently serving as Global Chief Operating Officer and President of the APAC Region, following her earlier role as Executive Vice President, Asia Pacific. During her tenure, Chen led the expansion of Bemis’s global operations footprint, regionalization of supply chain, strengthening of Asia Pacific leadership, and navigation of major supply chain and trade challenges.

As President and COO, Chen will lead Bemis’s executive leadership team in accelerating growth globally. She will also serve as a core member of the CEO’s leadership team, responsible for enterprise-wide alignment and strategy execution.

“I am honored to step into the role of President and COO of Bemis,” said Christina Chen. “I connect deeply with Bemis’s purpose of improving people’s lives and the Bemis values.  I am mindful of the global legacy the company has built over the past 115 years. As COO and President of APAC, I’ve had the privilege of working with Bemis teams globally and seeing firsthand the amazing value that the Bemis team can create. I am excited about the pivotal moment we are in as a company. As we enter our next phase of acceleration, I look forward to leading this amazing global team to elevate our value and impact to our customers, partners, team members, and communities we operate in around the world.”

About Bemis Associates

Bemis Associates, Inc., is a global leader in adhesives and bonding solutions, partnering with leading apparel, consumer electronics and industrial brands to improve product performance and aesthetics. Founded in 1910, we combine technical expertise, global scale, and a values‑driven culture to deliver innovative solutions. We develop and manufacture Sewfree® adhesives, embellishments, seam tapes, seam reinforcement tapes, and added value bonded solutions. We maintain offices, manufacturing facilities and Co-Lab design and application centers throughout the world. Learn more at bemisworldwide.com.

CGTN: What China’s strong start to the 15th FYP period signals

CGTN examines reasons behind the resilience and vitality of the Chinese economy. China is unswervingly deepening reform and opening up, advancing self-reliance in science and technology, ensuring the autonomy of industrial chains, and strengthening the internal drivers of economic growth all key factors behind the remarkable performance of Chinas economy at the start of the 15th Five-Year Plan.

BEIJING, April 29, 2026 /PRNewswire/ — The Chinese economy has started strong in the 15th Five-Year Plan period (2026-2030) despite external pressure and trade tensions, according to the meeting the Political Bureau of the CPC Central Committee held on Tuesday. The economic growth remains steady, industrial capacity continues to improve, and policy support is helping stabilize expectations.

What China's strong start to the 15th FYP period signals
What China’s strong start to the 15th FYP period signals

For an economy of China’s scale, maintaining this level of momentum not only proves its resilience but also its capacity to adapt and keep advancing under changing conditions.

The policy direction of the 15th Five-Year Plan, instead of relying primarily on land, property, and heavy investment, as the old growth playbook was wont to, is turning toward technology, innovation, and high-quality development.

By focusing on new quality productive forces – high-tech, high efficiency and high quality, in line with the new green development philosophy – China is aiming not just to grow faster but to grow smarter, with better productivity, stronger competitiveness, and more sustainable development.

During the January-March period, high-tech manufacturing saw strong growth, with profits rising 47.4%, adding 7.9 percentage points to overall industrial profit growth, according to the National Bureau of Statistics. Rapid advances in AI and semiconductor-related industries boosted profits in optical fiber manufacturing by a whopping 336.8%, optoelectronic device manufacturing (43%), and display device manufacturing (36.3%).

The 15th Five-Year Plan comes at a time when China is making steady progress in opening-up. China currently has 23 pilot free trade zones, which account for about 20% of the country’s foreign investment and trade. The negative list for foreign investment, which tabulates the sectors out of bounds for foreign investors, has been shortened to 29 items. Notably, all restrictions on foreign investment in manufacturing have been removed.

China’s opening-up is no longer only about trade volume or foreign investment. It is increasingly about institutional openness, market access, improved business environments, and stronger alignment with international standards.

At the same time, domestic demand is becoming an important engine of growth. At a press briefing on April 17, the National Development and Reform Commission said there would be a special action plan to expand domestic demand from 2026 to 2030.

As the second largest economy, China’s domestic market means immense potential and unlocking that potential will support more stable and sustainable expansion. By strengthening consumption and expanding domestic circulation, the country is building a broader foundation for development.

Instead of simply chasing short-term gains, China is thinking carefully about how to build a stronger and more balanced economy over time. The 15th Five-Year Plan begins with real strengths: the economy has shown resilience, opening-up continues to expand in quality and depth, and domestic demand is being given greater strategic importance.

These are all signs of a confident and adaptive development approach. Rather than seeing the current challenges as setbacks, China is using them to upgrade its growth model and build a more dynamic future.

https://news.cgtn.com/news/2026-04-28/What-China-s-strong-start-to-the-15th-FYP-period-signals–1MIqzxMJsys/p.html


This Mother’s Day, Give Her Support That Stays–with LiberNovo Omni

She supports everyone—but what supports her when no one’s around?

This Mother’s Day, give her support that’s always where it’s needed.

LOS ANGELES, April 29, 2026 /PRNewswire/ — This Mother’s Day, ergonomic innovator LiberNovo is celebrating everyday heroes with a more meaningful way to show you care. Through its Reward Your Hard Work campaign, the brand is promoting active recovery as a new standard for modern wellness in the workspace, alongside a limited-time offer on its flagship LiberNovo Omni from April 28 to May 12 (PDT).

LiberNovo for the Rad Moms, supports your every breakthrough

Built on the philosophy of dynamic support, LiberNovo Omni is recognized as the world’s first ergonomic chair designed to be responsive to natural movement while sitting—offering consistent support to anyone who must sit for long hours to work, innovate, and inspire others.

The LiberNovo Omni has been recognized with the Red Dot Design Award for its innovation in movement-based ergonomic design and has been certified GREENGUARD Gold for meeting one of the strictest standards for low chemical emissions and indoor air quality.

Mother’s Day = Real Care, Real Support

Today’s mothers are often required to step outside of any single role. They lead teams, build careers, raise families, and create space for themselves—often all within the same twenty-four hours. From remote professionals and artists to entrepreneurs or full-time caregivers, a mother’s life is in constant motion.

Behind all that momentum, there is often physical strain and accumulated fatigue that doesn’t simply disappear when the day is over. The meaning of gifting is evolving, and families are moving beyond symbolic gestures toward something more practical and lasting—support that improves everyday life. It’s this sentiment that lies at the heart of LiberNovo‘s message this Mother’s Day:

She doesn’t need more flowers. She needs support that helps her recover during hours of sitting, whether it’s working or taking a break. 

Dynamic Ergonomics & Active Recovery

LiberNovo’s approach to ergonomics challenges a long-standing assumption: that sitting is a static physical state.

Instead, dynamic ergonomics introduces a system that continuously adapts to the user’s movement—whether leaning forward into focus, reclining to think, or shifting during long work sessions. This allows the spine to remain naturally supported as the body moves naturally throughout the day, without the need for constant manual adjustments.

By supporting the body’s natural movement and providing support that follows through on every upright task or reclined break, recovery doesn’t need to be delayed until the end of the day; it can happen continuously, with every moment of sitting.

The LiberNovo Omni achieves this through its integrated design:

  • Dynamic Support System — Automatically adjusts support across the head, back, arms, and seat, following posture changes as you move in your seat
  • Bionic FlexFit Backrest — Sixteen ball joints and eight adaptive panels create a responsive S-curve that mirrors the spine and relieves pressure
  • Multi-Stage Recline (105°–160°) — A different recline angle for every part of your day. Meetings, entertainment, or full recovery.
  • Full Adjustability — 4D armrests, adjustable neck support, seat height control, and optional footrest for personalized comfort

Together, these elements transform the chair from a passive object into an active support system—one that moves with the body and supports it continuously throughout the day.

Mother’s Day Offer: Reward Your Hard Work

From April 28 to May 12 (PDT), LiberNovo is offering a limited-time promotion across North America to make Dynamic Recovery more accessible:

  • Free Cooling Seat Mat with every LiberNovo Omni Pro Bundle
  • Price Match Guarantee for confident purchasing
  • 0% APR, Pay in 4 for flexible payment
  • Double Credits earned on all eligible purchases from LiberNovos website, redeemable instantly at checkout

The campaign is built around two core ideas: #RewardYourSpine and #GiftMomComfort — reinforcing a shift toward meaningful, everyday support.

About LiberNovo

LiberNovo is redefining the modern work environment through motion-responsive ergonomics. Guided by a health-first design philosophy, the company develops solutions that adapt to motion and change how modern creatives interact with their workspace.

Designed for remote professionals, gamers, and anyone who spends long hours at a desk, the flagship LiberNovo Omni represents a new category of ergonomic seating—one where movement is not restricted, but supported.

By transforming sitting into a dynamic experience, LiberNovo’s mission is simple: to make every hour at the desk more comfortable and more sustainable.

For more information, visit libernovo.com

#RewardYourSpine #GiftMomComfort #DynamicErgonomics #HealthFirstDesign #SmartWorkspace


New Video Enhancer — MiniTool Released Video Converter 4.7

VANCOUVER, BC, April 29, 2026 /PRNewswire/ — MiniTool Video Converter 4.7 is now available from MiniTool Software Limited, featuring an integrated Video Enhancer feature.

Highlights of MiniTool Video Converter 4.7

  • Reconstruct pixels to improve video resolution to 4K.
  • Optimize anime linework and color blocks.
  • Remove noise and restore video clarity.
  • Compare changes with side-by-side preview.
  • No watermarks and restrictions.
  • Support multiple video formats.

Upscale Video Resolution to 4K

MiniTool Video Converter 4.7 uses advanced AI technology to improve video quality by reconstructing pixels at the source level. The software offers flexible upscaling options: keep the original resolution with small improvements, scale up to 2x for sharper images, or enlarge to 4x for professional results.

Optimize Anime Linework and Color Blocks

MiniTool Video Converter 4.7 includes an Anime Enhancer mode. It supports improving animation quality. While keeping the original anime art style, it sharpens lines and boosts color brightness.

Remove Noise and Restore Video Clarity

MiniTool Video Converter 4.7 comes with the Video Denoiser mode. This feature uses advanced smoothing technology. It finds unwanted grains and removes them, making the video clear. Furthermore, MiniTool Video Converter preserves every detail. The quality of the processed video footage has been significantly enhanced.

Compare Changes with Side-by-Side Preview

MiniTool Video Converter’s Video Enhancer feature includes a preview option. This option displays key frames from the original and enhanced videos side by side. This clear comparison ensures the final video meets all expectations.

No Watermarks and Restrictions

MiniTool Video Converter adds no watermarks to enhanced videos. The output remains completely clean and professional. Furthermore, this application places no limits on the length of the video it is going to process.

Support Multiple Video Formats

MiniTool Video Converter supports enhancing video in many popular formats, including MP4, MKV, MOV, WebM, AVI, WMV, 3GP, FLV, and more. This wide compatibility makes video enhancement accessible for everyone.

About MiniTool Video Converter

MiniTool Video Converter is a multifunctional application developed by MiniTool Software Ltd. In addition to video enhancement, it also provides these powerful features:

  • Convert video and audio across multiple formats with adjustable settings.
  • Reduce file sizes while preserving quality.
  • Transcribe video or audio to editable text.

1. Versatile Format Conversion

MiniTool Video Converter is great at converting video and audio formats. A wide range of formats are supported, including MP4, MKV, WMV, WAV, MOV, MP3, AAC, WMA, and more. Settings such as bit rate, resolution, frame rate, and others can also be freely adjusted for the converted files.

2. Watermark-free Video Compression

MiniTool Video Converter compresses video without losing quality. It handles videos up to 8K resolution. This program compresses up to 5 videos at once in a batch. The compression level ranges from 10% to 100%. In addition, MiniTool Video Converter includes a preview feature to check the final quality.

3. Quick Video and Audio Transcription

MiniTool Video Converter transcribes video and audio to text. It allows editing the transcribed text. MiniTool Video Converter supports exporting the text in SRT or TXT format. Furthermore, this application can create embedded subtitles for the video.

About MiniTool® Software Ltd.

MiniTool® Software Ltd. is a dedicated software development company that provides complete business software solutions across video conversion, video editing, data recovery, data backup, and partition management industry.