Home Blog Page 786

The Four-Wheel Shift, VinFast VF 3 Makes Indonesian Users Upgrade from Motorbikes


JAKARTA, INDONESIA – Media OutReach Newswire – 24 March 2026 – In Indonesia, where motorbikes have long dominated daily mobility, transitioning to a car has traditionally been seen as a major leap, one associated with higher costs, lifestyle adjustments, and urban constraints. However, the arrival of the VinFast VF 3 is rapidly reshaping that narrative.

VinFast VF 3

For many first-time car buyers, especially those upgrading from motorbikes, the most striking impression of the VF 3 is not its technology, but its sense of relief. No more exposure to heat, rain, or fatigue from long hours navigating traffic, common realities in cities like Jakarta or Surabaya.

‘A small car, yet a whole world of its own’

One user described the experience as “stepping into a completely different world”, a space where they can lean back, relax, and actually enjoy the journey instead of enduring it.

Despite its compact footprint, the VF 3 offers a surprisingly optimized cabin. Its minimalist yet functional design ensures that every element serves a clear purpose, from seating layout to dashboard ergonomics. The air-conditioning system cools the interior quickly, a crucial advantage in tropical climates.

A particularly thoughtful design detail is the upright windshield, which helps reduce direct sunlight entering the cabin, an issue that many traditional sedans in Southeast Asia still struggle with. These seemingly small refinements collectively deliver a noticeably improved everyday experience.

More importantly, for many Indonesian families, VF 3 quickly becomes part of daily life: school runs, grocery trips, and weekend getaways. A compact car, yet a complete personal space on wheels.

Effortless driving, confident journeys

One of the biggest psychological barriers for motorbike users switching to cars is driving complexity. The VF 3 addresses this by making the experience intuitive and approachable.

With a light steering feel, tight turning radius, and a length of just around 3 meters, this mini-SUV is perfectly suited for navigating dense urban environments, a defining characteristic of Indonesian cities.

The gear selector, positioned conveniently behind the steering wheel, further simplifies operation, especially for first-time drivers.

Beyond ease of use, the VF 3 delivers a distinctly different driving experience thanks to its electric powertrain. Acceleration is smooth and immediate, allowing for responsive maneuvering in traffic. Even at speeds of 70-80 km/h, the vehicle maintains stability and a planted feel, giving drivers confidence on highways and intercity routes.

Notably, with a maximum torque of up to 110 Nm, the VF 3 exceeds expectations for a vehicle in its segment. It handles inclines and varied terrains with ease, proving capable even on more challenging routes.

When cost is no longer a barrier

Beyond user experience, economics plays a decisive role in Indonesia’s mobility transition, and this is where VinFastcreates a compelling advantage.

Unlike gasoline vehicles, electric cars offer significantly more predictable operating costs. Users are no longer exposed to volatile global fuel prices. Instead, electricity costs are generally more stable and easier to forecast.

More importantly, VinFast introduces an innovative battery subscription model, which has already received positive feedback in Indonesia. By separating the battery, the most expensive component, from the vehicle price, the company significantly reduces upfront ownership costs.

This aligns closely with Indonesian consumer behavior, where affordability at the point of purchase remains a key decision factor, even if long-term savings are evident.

VinFast further strengthens this advantage through a seasonal promotion: free battery subscription fees for two years for vehicles invoiced before May 31, 2026. Economically, this is highly impactful, as it effectively eliminates a major portion of early-stage operating costs.

When both initial investment and ongoing expenses are minimized, the barrier to switching from motorbikes or gasoline cars to EVs becomes dramatically lower.

A “golden opportunity” to go electric

Amid increasing volatility in global fuel markets, Vingroup has launched the “Trade Gas for Electric” program across multiple markets, including Indonesia.

The initiative provides an additional 3% discount on VinFast electric cars and a 5% discount on VinFast electric scooters for customers who switch from older gasoline vehicles.

At the same time, GSM Green and Smart Mobility is supporting this transition through discounted electric mobility services, allowing users to experience EVs firsthand before making a purchase decision.

Together, these efforts reflect a comprehensive ecosystem approach, not just selling vehicles, but enabling a complete shift in mobility behavior.

In a country where motorbikes have long been the default choice, the VF 3 introduces a new paradigm: compact, accessible, and intelligently designed mobility. It delivers not only convenience and cost efficiency, but also a tangible upgrade in quality of life, from protection against weather conditions to creating a private, comfortable space for families.

As urbanization accelerates and mobility needs evolve, solutions like the VF 3 are no longer optional. Ultimately, the reason many Indonesian users are willing to “ditch motorbikes without regret” is simple. They are choosing a better way to move, and a better way to live.

Hashtag: #VinFast

The issuer is solely responsible for the content of this announcement.

OUE REIT Elevates Asset Value and Sustainability at OUE Bayfront

Unlocking over 2,100 sq m prime office space

SINGAPORE, March 24, 2026 /PRNewswire/ — OUE REIT Management Pte. Ltd., as manager (the “Manager”) of OUE Real Estate Investment Trust (“OUE REIT”), is pleased to announce that OUE Bayfront has obtained planning approval for the conversion of its Level 17 chiller system area into prime office space. The conversion is expected to be completed by the first half of 2027 and will deliver incremental rental income, further reinforcing OUE Bayfront’s long-term value.

OUE Bayfront commenced works to connect to the District Cooling System (“DCS”) in 2025. Once in operation, the DCS will enable OUE Bayfront to significantly reduce energy consumption, improve cooling efficiency, and lower greenhouse gas emissions. This initiative aligns with OUE Bayfront’s Net Zero Transition Plan and OUE REIT’s ESG Vision 2030 to reduce our Scope 1 and 2 absolute greenhouse gas (GHG) emissions by 40% for our commercial assets by 2030.

Beyond environmental benefits, the connection to the DCS also enables OUE Bayfront to decommission its existing chiller system located at Level 17, freeing up an estimated of over 2,100 square metres of gross floor area that can be converted into prime office space. This is expected to generate additional rental income and further strengthen the property’s long-term value.

Mr Han Khim Siew, Chief Executive Officer and Executive Director of the Manager, said, “At OUE REIT, we view sustainability not only as a moral imperative, but as a strategic and structural imperative that is integral to delivering long-term value creation. Following the OUE Bayfront’s upgrade to the BCA Green Mark Platinum certification last year, the conversion of the in-building chiller system area into new prime office space is another testament to how OUE REIT integrates sustainability with value creation. Moving forward, we will continue to identify and implement sustainability-led asset enhancement initiatives that future-proof our portfolio and deliver enduring returns for our stakeholders.”

With the estimated capital expenditure of up to approximately S$43.0 million, the space conversion is expected to deliver a stabilised return on investment exceeding 11.0%. The Manager intends to draw down on existing loan facilities to fully fund the space conversion and the conversion is not expected to have a material effect on the net tangible assets or aggregate leverage of OUE REIT and its subsidiaries for the financial year ending 31 December 2026.

About OUE REIT

OUE Real Estate Investment Trust (“OUE REIT”), formerly known as OUE Commercial Real Estate Investment Trust, is one of the largest diversified Singapore REITs (“S-REITs”) with total assets under management of S$5.8 billion as of 31 December 2024.

OUE REIT aims to deliver stable distributions and provide sustainable long-term growth in return to holders of units (“Unitholders”) by investing in income-producing real estate used primarily for hospitality, retail and/or office purposes in financial and business hubs, as well as real estate-related assets.

OUE REIT’s portfolio comprises six high-quality office, hospitality and retail assets located in Singapore. Its three office assets – OUE Bayfront, One Raffles Place and OUE Downtown Office – are situated within the Central Business District, with a total Net Lettable Area (“NLA”) of approximately 1.6 million square feet (“sq ft”).

OUE REIT’s two hotels, Hilton Singapore Orchard and Crowne Plaza Changi Airport, are strategically located along the prime Orchard Road belt and within the Changi Airport vicinity, offering a total of 1,655 upper upscale hotel rooms. Complementing Hilton Singapore Orchard is Mandarin Gallery, a 126,294 sq ft high-end retail mall that has been a preferred destination for international brands in the heart of Orchard Road.

Listed on the Main Board of the Singapore Exchange Securities Trading Limited since 27 January 2014, OUE REIT is managed by OUE REIT Management Pte. Ltd. (the “Manager”), a wholly-owned subsidiary of OUE Limited (the “Sponsor”). The Sponsor is a leading real estate and healthcare group, growing strategically to capitalise on growth trends across Asia. Its real estate activities include the development, investment and management of real estate assets across the commercial, hospitality, retail, residential and healthcare sectors.

For more information, please visit www.ouereit.com.

About the Sponsor: OUE Limited

OUE Limited (SGX:LJ3) is a leading real estate and healthcare group, growing strategically to capitalise on growth trends across Asia.

OUE’s real estate activities include the development, investment and management of real estate assets across the commercial, hospitality, retail and residential sectors. OUE manages two SGX-listed REITs: OUE REIT, one of Singapore’s largest diversified REITs, and First REIT (a subsidiary of OUE Healthcare), Singapore’s first listed healthcare REIT. As at 31 December 2025, OUE’s total assets were valued at S$8.3 billion, with S$7.3 billion in funds under management across OUE’s two REIT platforms and managed accounts. 

OUE Healthcare, an SGX Catalist-listed subsidiary of OUE, operates and owns high-quality healthcare assets in high-growth Asian markets. With a vision of creating a regional healthcare ecosystem that is anchored on Singapore’s medical best practices, OUE Healthcare’s portfolio of owned and operated businesses includes hospitals, medical centres, clinics and senior care facilities in Singapore, Japan, Indonesia, China and Myanmar.

Anchored by its “Transformational Thinking” philosophy, OUE has built a strong reputation for developing iconic projects, transforming communities, providing exceptional service to customers and delivering long-term value to stakeholders.

For more information, please visit www.oue.com.sg.

IMPORTANT NOTICE

The value of units in OUE REIT (“Units”) and the income derived from them, if any, may fall or rise. Units are not obligations of, deposits in, or guaranteed by, the Manager or any of its affiliates. An investment in Units is subject to investment risks, including the possible loss of the principal amount invested. The past performance of OUE REIT is not necessarily indicative of the future performance of OUE REIT.

Investors should note that they will have no right to request the Manager to redeem or purchase their Units for so long as the Units are listed on the SGX-ST. It is intended that holders of Units may only deal in their Units through trading on the SGX-ST. The listing of the Units on the SGX-ST does not guarantee a liquid market for the Units.

This press release may contain forward-looking statements that involve risks and uncertainties. Actual future performance, outcomes and results may differ materially from those expressed in forward-looking statements as a result of a number of risks, uncertainties and assumptions. Representative examples of these factors include (without limitation) general industry and economic conditions, interest rate trends, cost of capital and capital availability, competition from similar developments, shifts in expected levels of property rental income, changes in operating expenses (including employee wages, benefits, and training costs), property expenses and governmental and public policy changes. You are cautioned not to place undue reliance on these forward-looking statements, which are based on the Manager’s current view of future events.

Yumeya Metal Wood Grain Restaurant Chairs Protect European Furniture Importers From 4% EUDR Revenue Fines Through Zero Deforestation Innovation

HESHAN, China, March 24, 2026 /PRNewswire/ — The global furniture supply chain is entering a period of enforced transparency that many European importers are currently ill-prepared to handle. As the 2026 implementation of the European Union Deforestation Regulation (EUDR) approaches, Yumeya Furniture has introduced strategic, compliance-ready solution to ease regulatory pressure. By leveraging its pioneering metal wood grain technology, the company is helping European furniture importers and hospitality groups navigate the financial risks associated with timber traceability while establishing a new benchmark for sustainable contract furniture.

European restaurateurs have long adored the rustic charm of solid wood seating, but Brussels is now handing them a rather expensive reality check. The EUDR mandates total supply chain transparency, requiring importers to prove their timber products are entirely free from deforestation through mandatory due diligence statements. Those failing to provide exact geolocation coordinates face regulatory fines reaching up to 4% of their annual turnover. For major furniture distributors, this policy turns traditional wooden chairs from premium hospitality assets into severe compliance liabilities.

100% Recyclable. Zero Deforestation.Yumeya’s metal wood grain chairs offer European venues a premium look while entirely bypassing EUDR traceability mandates.

Faced with mounting paperwork and the threat of crippling penalties, European buyers are searching for viable alternatives. Yumeya Furniture offers an elegant escape route through its metal wood grain technology. The manufacturer produces commercial seating that mirrors the exact look and texture of solid timber while using high strength aluminum and steel frames. By decoupling luxury aesthetics from forest dependency, Yumeya’s metal-based infrastructure offers a frictionless transition into the EUDR era.

“The commercial furniture industry is at a crossroads where tradition meets a legal wall,” says Mr. Gong, founder of Yumeya, “Solid wood is becoming a high-risk liability due to the complexity of timber sourcing. Yumeya metal wood grain chairs offer a practical exit from this crisis, providing the warmth of wood with the legal immunity of high-grade metal.”

The environmental mathematics driving this shift are stark. Manufacturing a standard batch of 100 high-end solid wood dining chairs typically requires felling half a dozen century old European beech trees. This scale of logging wipes out the annual growth of an entire hectare of forest. Yumeya’s manufacturing process relies on a specialized heat transfer technique that bonds wood grain patterns to metal surfaces. The result provides the hospitality sector with natural aesthetics while leaving the forests untouched, giving corporate buyers a concrete metric to include in their annual environmental and social governance reports.

Switching to metal is not only about reducing pressure on forest resources. It is also a more practical materials strategy for long-term sustainability. Yumeya uses aluminum and steel frames that deliver the same warm wood appearance without depending on timber supply. When the chairs eventually reach the end of their service life, the metal materials can be recycled and returned to industrial use instead of being sent to landfill. For hospitality groups, this provides the hard data needed for ESG reporting—something that wood supply chains, with their complex chemical treatments, struggle to deliver.

The economic case is built on durability. Wood is an organic material that constantly reacts to changes in humidity and temperature. In high-traffic commercial environments, wooden chairs often wobble or creak as joints loosen and seams age, usually requiring replacement within five years. Yumeya eliminates this structural fatigue with fully welded frames that are engineered for a decade of service. In practical terms, a restaurant owner avoids an entire round of replacement furniture over a ten-year period. Purchasing twice instead of three times over a decade-long cycle cuts procurement budgets and removes the hidden drain of ongoing structural maintenance.

This technical maturity is the result of decades of quiet refinement. Mr. Gong first applied wood grain finishes to metal frames in 1998. The company has continually advanced the science of surface treatment since those early trials. By 2018, they introduced a 3D finish that accurately mimics the tactile grain of natural timber. More recently, in 2022, they adapted the process for outdoor patios, solving the perennial problem of weather faded exterior furniture.

As the 2026 EUDR enforcement deadline approaches, the European contract furniture market must adapt to survive. Relying on solid wood now carries an unprecedented financial and ecological cost. Yumeya demonstrates that protecting profit margins and preserving global forests can be achieved simultaneously.

About Yumeya Furniture

Yumeya Furniture is a world-leading manufacturer of metal wood grain contract furniture. With successful cases in over 80 countries and a mission to bring environment-friendly seating to the world, Yumeya combines 25 years of technical mastery with a commitment to $0 after-sale costs and 10-year structural warranties.

For more information, please visit: https://www.yumeyafurniture.com/ 

Media Contact:
Company: Heshan Yumeya Furniture Co., Ltd
Email: info@youmeiya.net
Whatsapp: +86 15219693331
Address: Zhennan Industry, Heshan City, Guangdong Province, China.

Feedzai Unveils RiskFM AI Foundation Model for Financial Crime Prevention

Built on pioneering research in tabular foundation models, RiskFM enables financial institutions to detect, prevent, and adapt to fraud and scams with unprecedented speed and precision

NEW YORK and LISBON, Portugal, March 24, 2026 /PRNewswire/ — Feedzai, the global leader in AI-native financial crime prevention, today unveiled RiskFM (Risk Foundation Model), the industry’s first Tabular Foundation Model purpose-built for financial data and risk decisioning.

RiskFM marks a fundamental shift in how financial crime is detected and prevented. For decades, institutions have relied on rules and manually-engineered machine learning models built one customer at a time. RiskFM changes that as a purpose built frontier model that spans across fraud detection, anti-money laundering (AML), and broader risk decisions across the entire financial crime lifecycle. Unlike current industry attempts limited to card network data, RiskFM is trained on a uniquely broad, deep, global dataset spanning onboarding, digital activity, payments, transfers, and AML workflows, enabling institutions to detect, prevent, and adapt to financial crime with unprecedented speed and precision.

Solving the Unique Challenge of Transactional Data

Recently, Large Language Models (LLMs) have effectively “solved” domains like language, audio, and video because they are highly constrained by finite grammar and causality. In language, next words are often predictable: in the sentence “Yesterday, a scammer contacted me and pretended to be my …”, the next word is likely “relative,” “friend,” or “coworker”. Similarly, in images and video, individual pixels are highly predictive of their nearby neighbors. Financial transactions, however, operate in a fundamentally different reality.

“Next transactions are far less predictable than the next word in a sentence,” said Pedro Bizarro, chief science officer at Feedzai. “Consumer spending habits, payment types, and fraud modes change continuously. More importantly, financial risk is an adversarial domain; fraudsters actively adapt to evade detection in real-time.”

Feedzai is uniquely positioned to explore large datasets, as the company annually risk-assesses $9T in payments across 120B events worldwide that span the entire financial risk lifecycle: from onboarding and digital activity to card payments and real-time transfers. This unparalleled breadth ensures RiskFM is tested at scale as a holistic model, rather than siloed in a single specialized application.

RiskFM is already showing it can match the performance of bespoke supervised models even with data from a single customer, and it surpasses them when trained with data from several institutions and geographies. The result is more value for customers, faster deployment times, and significantly lower implementation and maintenance costs.

“Foundation models have reshaped language, vision, and audio, but financial crime has remained stubbornly resistant to that wave,” said Sam Abadir, research director, risk, financial crime, and compliance for IDC. “Feedzai’s RiskFM is a credible attempt to close that gap. The ability to match bespoke supervised models out of the box, without manual feature engineering, has real implications for how institutions think about deployment speed, cost, and coverage across the full financial crime lifecycle, from card fraud to AML. The early performance data is worth watching, as is how the model holds up as it expands into more complex use cases.”

A Unified Model With Unprecedented Performance

Following rigorous testing and baseline experiments, RiskFM delivers unprecedented capabilities:

  • Compounding intelligence: When trained across multiple institutions and geographies simultaneously, RiskFM outperforms traditional models based on Gradient Boosting and Deep Learning approaches, and keeps improving as it ingests more data.
  • Ability to match highly-tuned models on Day One: When RiskFM is used to power a bespoke model for a single customer, it matches the performance of high-tuned supervised models without manual, time-consuming feature engineering.
  • One model from mule account detection to AML: RiskFM serves as the foundational AI layer for financial risk. It is designed to expand across the full range of financial crime prevention, from mule account detection to AML, providing institutions with a scalable, intelligent model that grows with their needs.

“Our vision is coming true: this is not just another Large Tabular Model for a single data type. We’ve developed a foundation model for financial data that covers multiple use cases — from cards to real-time payments — and geographies, delivering strong performance from Day One at global scale,” said Pedro Barata, chief product officer at Feedzai. “RiskFM proves our multi-year investment in foundation models is paying off. We’re not just part of the conversation; we’re defining how it applies to the complexities of global financial crime prevention.”

Feedzai is working with early adopters to validate initial RiskFM frameworks and plans to scale these methodologies to large datasets, ultimately integrating them across its full suite of use cases.

“Lloyds Banking Group works collaboratively across the industry to protect consumers from financial crime,” said Tom Martin, Lloyds Banking Group Business Platform Lead, Economic Crime Prevention. “We’ve been collaborating with Feedzai for years on AI innovation to give fraud fighters the upper hand against criminals, and RiskFM is an exciting milestone in that journey.”

About Feedzai

Feedzai powers trust in global finance. We protect people and payments using trusted AI to detect and prevent financial crime, fraud, and money laundering in real time, so money moves safely. Every year, the world’s top banks, payment networks, and acquirers use Feedzai’s technology to safeguard more than one billion consumers and $9 trillion in payment volume. Learn more at feedzai.com.

Inkhouse for Feedzai

feedzai@inkhouse.com

xStocks Now Live on Bybit Trading Bots, Expanding Automated Trading to Tokenized Equities

DUBAI, UAE, March 24, 2026 /PRNewswire/ — Bybit, the world’s second-largest cryptocurrency exchange by trading volume, is pleased to announce that select xStocks offerings are now officially available on Bybit Trading Bot, bringing popular tokenized U.S. equities into its advanced automated trading solutions.

Live on Bybit for Spot trading since summer 2025, xStocks has unlocked a new way for investors worldwide to access premium US equities 24/7, including major ETFs and stocks. The new integration now allows Bybit users to trade market volatility around the clock.

Whether they prioritize trading discipline or are highly in tune with market credence, skilled traders can now seamlessly create automated strategies around some of the world’s most influential companies using Bybit’s Spot Grid Trading Bots.

Premium Equities Now Available on Bybit Trading Bot

The launch features highly liquid, globally recognized tokenized stocks paired with USDT, including members of the Magnificent Seven technology sector:

  • Apple: Global technology and consumer electronics powerhouse
  • Tesla: Electric vehicle and clean energy innovation leader
  • Alphabet: Search, advertising, and cloud infrastructure giant
  • NVIDIA: AI and semiconductor technology pioneer
  • Amazon: E-commerce and cloud computing behemoth

Additional notable listings include:

  •  Robinhood: Pioneering fintech broker
  •  Circle: Digital currency infrastructure provider


The new expansion now empowers Bybit users to capture market opportunities in leading global stocks, while leveraging the efficiency and precision of Bybit’s automated trading tools. Whether traders are looking to diversify or optimize their automated strategy execution, xStocks on Trading Bot offers new possibilities.

xStocks is a blockchain-native equity solution enabling 24/7 trading of tokenized U.S. equities with instant settlement and programmable automation. Fully collateralized and freely transferable across blockchains, xStocks bring transparency, efficiency and accessibility to traditional capital markets. 

Terms and conditions apply. For details of eligibility and other restrictions, users may visit: xStocks Launches on Bybit Trading Bot

#Bybit / #TheCryptoArk / #IMakeIt

About Bybit

Bybit is the world’s second-largest cryptocurrency exchange by trading volume, serving a global community of over 80 million users. Founded in 2018, Bybit is redefining openness in the decentralized world by creating a simpler, open and equal ecosystem for everyone. With a strong focus on Web3, Bybit partners strategically with leading blockchain protocols to provide robust infrastructure and drive on-chain innovation. Renowned for its secure custody, diverse marketplaces, intuitive user experience, and advanced blockchain tools, Bybit bridges the gap between TradFi and DeFi, empowering builders, creators, and enthusiasts to unlock the full potential of Web3. Discover the future of decentralized finance at Bybit.com.

For more details about Bybit, please visit Bybit Press

For media inquiries, please contact: media@bybit.com

For updates, please follow: Bybit’s Communities and Social Media

Discord | Facebook | Instagram | LinkedIn | Reddit | Telegram | TikTok | X | Youtube

SanSara Presents a Limited-Time Four-Hands Collaboration with Chef Sohan Singh of MICHELIN Bib Gourmand-Awarded RANG (Da Nang, Vietnam)

SINGAPORE, March 24, 2026 /PRNewswire/ — SanSara at Grand Copthorne Waterfront Hotel Singapore unveils Two Masters, One Flame, a limited-time four-hands collaboration between Chef Pannalal Nath, Master Chef of SanSara, and Chef Sohan Singh of RANG, Da Nang, the MICHELIN Bib Gourmand–awarded modern Indian restaurant redefining Indian cuisine in Vietnam. Running from 24 to 28 March 2026, this five-day dining experience presents a co-created menu that harmonises contemporary innovation with classical Indian culinary craft.

From left to right: Chef Sohan Singh of RANG and SanSara’s Master Chef Pannalal Nath

Designed as a shared creative endeavour, the collaboration brings together two distinct culinary perspectives. Chef Sohan’s globally influenced style is shaped by his experience across Dubai, Sydney, the Maldives, the UK and the Caribbean, while Chef Nath draws on his classical North Indian roots, known for depth of flavour, refined technique and respect for heritage.

“This collaboration beautifully reflects the shared cultural heritage and rich culinary traditions that connect India and Singapore. It not only showcases the diversity of Indian cuisine but also strengthens people-to-people ties and cultural exchange between our communities,” shared Her Excellency Ms Pooja Tillu, Deputy High Commissioner of India to Singapore.

Selected for his modern interpretation of Indian cuisine, Chef Sohan brings the creative spirit behind RANG’s MICHELIN Bib Gourmand distinction, while Chef Nath anchors the experience with classical depth and technique.

“This collaboration allowed us to explore Indian cuisine from two complementary angles,” said Chef Sohan. “Working alongside Chef Pannalal, we focused on dishes that honour classical flavours while presenting them in a refined, contemporary way.”

“For me, this was about creating something meaningful together,” added Chef Pannalal Nath. “Each dish reflects a meeting point between classical foundations and modern expression, shaped with intention and balance.”

Guests can look forward to dishes such as Sweet Potato Gnocchi Chaat, Tandoori Octopus, Carrot Halwa Mille Feuille, Shorba Jhinga, Quinoa Aloobukhara Ki Tikki, and Sansara-Nasila Dunger Lal Maas, alongside Zaffrani Barramundi and Masala Chai Tiramisu.

Menus are available as four- and six-course set experiences, with optional beverage pairings, starting from $68++ per guest.

Following this collaboration, SanSara will unveil upcoming chef partnerships in June and July, further reinforcing its commitment to elevated dining experiences that celebrate culinary finesse and creativity.

For more information, please contact:

Claire Chan, Assistant Director of Marketing Communications
Claire.Chan@millenniumhotels.com 

Kok Nee Tsu, Assistant Manager of Marketing Communications
neetsu.kok@millenniumhotels.com 

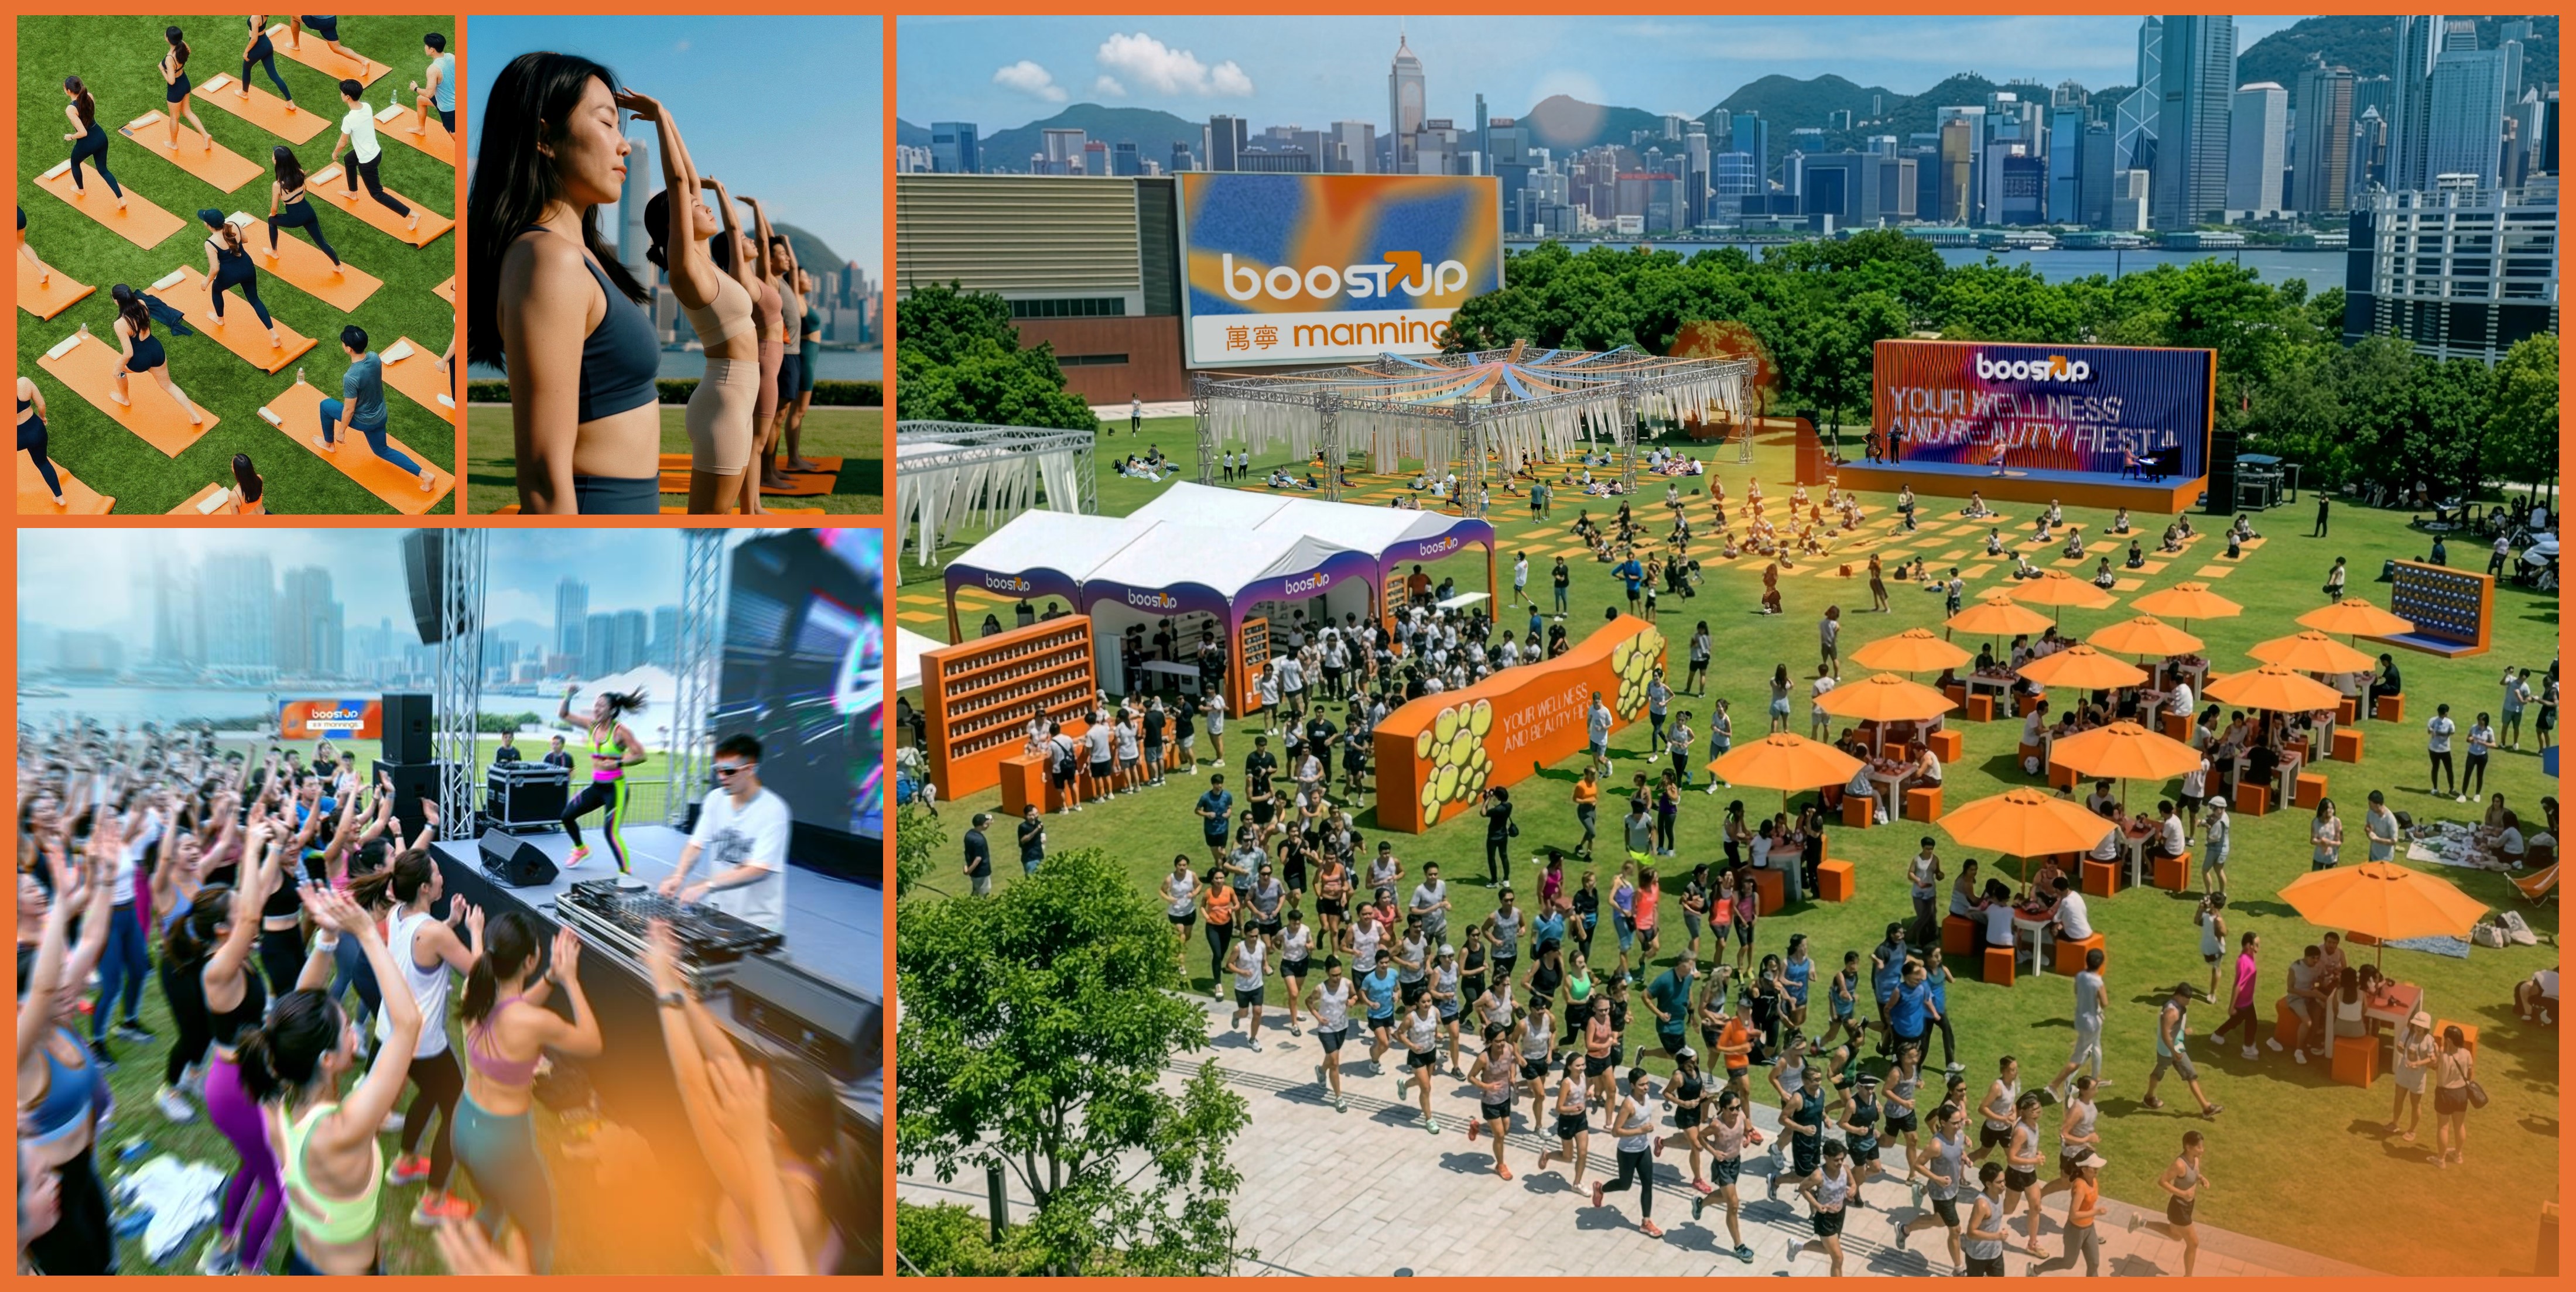
Mannings Introduces City-Wide Immersive Wellness Pop-Up “Mannings BoostUP – Your Wellness & Beauty Fiesta” Debuts This April in West Kowloon Cultural District

Reimagining Wellness and Inspiring a New State of Everyday Wellbeing


HONG KONG SAR – Media OutReach Newswire – 24 March 2026 – In a fast‑paced city where pressure and information overload are part of daily life, the definition of health has expanded beyond the absence of illness. For many Hongkongers, health now encompasses sleep quality, emotional balance, appearance confidence, and a sense of connection with others – for a more holistic, lifestyle‑driven state of wellbeing. It is highly individual, yet strengthened through community support.

Mannings BoostUP debuts this April in West Kowloon Cultural District

This April, Mannings is teaming up with Charlz Ng, a Hong Kong–based wellness advocate, brand strategist, and community builder, to bring Wellness from concept to everyday practice through the Mannings BoostUP Fiesta. The wellness & beauty discovery playground pop up will take place on 25–26 April at the West Kowloon Cultural District. Designed as a “Wellness Buffet”, Mannings BoostUP blends interactive experiences, mind‑body sessions, community‑driven activities, and a range of complimentary health assessments from the Mannings Professional Health Team. The goal is simple but transformative: to inspire everyone to move beyond reactive health habits and discover their own version of a good state at their own pace, in their own way.

Mannings Redefines Wellness Elevating Everyday Wellbeing

As Hong Kong’s leading Health & Beauty retailer with deep roots in the city for over 50 years, Mannings has accompanied generations of customers with authentic products, trusted advice and caring service. In recent years, the Mannings brand has evolved into The Trusted Advisor for Wellness, reflecting a growing public desire for more complete and balanced approach to wellbeing – not just physically, but emotionally, socially, and in everyday confidence. For younger generations in particular, they are looking for wellness that feels fun, relatable and part of real life.

That’s why Mannings is stepping outside the store and into the community, creating fresh, lively and varied wellness experiences that are easy to join and enjoyable for all. Through Mannings BoostUP, we are bringing together local wellness experts, movement leaders, and diverse communities to reimagine what Wellness can look and feel like, turning it into a “Wellness Buffet” where everyone can explore and try something new, elevating their holistic wellbeing. From young people to families to anyone curious about feeling better, Mannings BoostUp aims to spark a more vibrant, connected wellness culture across the city.

Alex Liu, Managing Director of Mannings Hong Kong, Macau and China, said: “Today’s customers see health as much more than ‘pills when you’re ill’. They aspire to build a richer, more vibrant life for themselves, nurturing their physical, emotional, appearance and social wellbeing every day. As Hong Kong’s Trusted Advisor for Wellness, Mannings is committed to supporting our customers on this journey – through professional expertise, technology and community networks. Mannings BoostUP marks an important milestone in how we re-imagine wellness and embodies our commitment to grow together with the city.”

Doreen Cheng, Marketing Director for DFI Retail Group Health & Beauty, North Asia, and H&B Own Brand Power Brand added: “Our customers are increasingly embracing wellness as a holistic, lifestyle‑driven pursuit. Mannings BoostUP is an experiential platform where wellness becomes immersive, uplifting and part of everyday life. Through these experiences, we invite customers to reconnect meaningfully with their complete selves, so that everyone can explore their own version of ‘being in good state’, at their own pace.”

Charlz Ng, Hong Kong–based wellness advocate, brand strategist, community builder and Founder of 120 Collective shared: “At Mannings BoostUP, you don’t need to be an athlete or gym enthusiast. We aren’t chasing records or keeping score, we’re here to help people understand themselves a little better. That’s why partnering with Mannings felt natural to us. We share the belief that wellness should be part of daily life, and that everyone should be able to engage with it in their own way. It’s about the courage to try something new, the joy of discovery, and the magic that happens when we move together.”

Six-zone Playground with 40+ Immersive Experiences – One Ticket, Access to Everything

Six-zone Playground with 40+ Immersive Experiences

The two‑day festival brings together over 50 wellness experts, movement leaders and community builders, offering 40+ experiences across six curated zones. Whether you’re a seasoned athlete or simply health‑curious, the Fiesta is designed for absolutely everyone – it’s fun, accessible, social and endlessly explorable.

  1. Mannings House: Mannings understands that everyone’s wellness journey is different, which is why the Mannings House sits as the starting point, an inviting space where guests can ease into their experience by getting to know their own mind-body condition. The Mannings Professional Health Team will offer a range of complimentary wellness assessments, including the Health Pod, Skin Assessment, AI Hair & Scalp Assessment, Modern Chinese Medicine Consultation, Cardiovascular & Stress Monitor, and Body Composition Analysis. With personalised insights based on ndividual results, participants can quickly understand their wellness needs and navigate the rest of the themed zones with clarity – helping them discover their own wellness track towards holistic health.
  2. BoostUP Stage: Get ready for countless unexpected collaborations on the BoostUP Stage! From Cantopop to classical music, high-energy workouts to mindfulness breathing, and coffee to matcha – there are untold paths toward wellness waiting to be encountered. The BoostUP Stage is primed to deliver an unprecedented sensory experience for every participant.
  3. Bloom Garden: Offers a variety of experiences to rejuvenate body and mind. From pilates to sound healing and aroma workshops, the garden leads visitors to rediscover passion and curiosity, through holistic experiences that relax mind, body and spirit, bringing a deeper understanding of individual preferences, opening new goals for inner and outer well-being, on the journey towards being your best self.
  4. Wellness Village: A curated marketplace offering an array of innovative wellness and beauty products, including brands: Mannings Guardian, 50 Megumi, Abbott, Colgate, Dermacept, DR. ALTHEA, FATION, FineNutri, G-NiiB, lilyeve, narka, REAL BARRIER, SHIMBI METHOD and TORRIDEN. Participants explore the latest health trends and experience comprehensive nourishment and rejuvenation, inside-out and outside-in.
  5. Play Zone: Where friendly competition meets pure fun. Team challenges, playful games, and moments of laughter, because wellness is a natural state and humans naturally like to play.
  6. Breathing Corner: A quiet corner to pause and reset. No instructions, no schedule. Just space to breathe, rest, and be.

Community × Citywide Celebration: A Wellness Festival Made for Hong Kong

The Mannings BoostUP is more than an event, it’s a citywide celebration inviting Hong Kong people to reconnect with themselves and with one another. Set against our magnificent harbour on the stylish West Kowloon Cultural District, Mannings BoostUP blends movement, music, recovery and restorative stillness, encouraging everyone to step back from the rush and touch the earth again. By bringing together diverse wellness communities, the event aims to spark conversation, connection, and insight – bringing Wellness back into neighbourhoods and city lifestyles, making it feel accessible, personal, and the natural way forward.

Mannings BoostUP Fiesta – Event Details
Date: 25–26 April 2026 (Saturday + Sunday), 9:00am – 7:00pm
Venue: Great Lawn, West Kowloon Cultural District, Tsim Sha Tsui

Programme Highlights: Six themed zones, two stages, 40+ experiences, star‑coach classes, Play Zone movement challenges, mind‑body recovery workshops, wellness expert talks, and more. (* Some sessions have limited capacity and will be available on a first‑come, first‑served basis.)

Early-Bird Tickets: HK$100 (1‑day pass), HK$180 (2‑day pass)
Standard Tickets: HK$200 (1‑day pass), HK$360 (2‑day pass)
On-Site Tickets: HK$300 (1-day pass)
Ticket Sales: On sale now. Early‑bird offer available until 15 April 2026
Ticket Link: https://manningsboostup.com/

Hashtag: #Mannings #TrustedAdvisorForWellness #HealthandBeauty #ManningsBoostUP #ReimagineWellnessTogether #WellnessAndBeautyFiesta #DFIRetailGroup

The issuer is solely responsible for the content of this announcement.

About Mannings

Mannings, the health and beauty business of DFI Retail Group, is Hong Kong’s largest health and beauty retailer, recognised No.1 Most Preferred Brand* for 6 consecutive years (2021-2026), operating over 300 outlets, including more than 60 in-store pharmacies, across Hong Kong and Macau. With a diverse range of products and services, Mannings is committed to integrating the concept of Wellness into our daily lives while pioneering a new era of health. By offering innovative health technologies, AI solutions, preventive healthcare, self-managed health tools, and digital wellness and beauty solutions, Mannings empowers individuals and families to prioritize their well-being. Mannings also provides complimentary professional services to safeguard the community’s health and beauty.

Cheetah Mobile Announces Fourth Quarter and Fiscal Year 2025 Unaudited Consolidated Financial Results

AI and Others revenue grew 84.7% year over year and accounted for 46.5% of total revenue in 2025

BEIJING, March 24, 2026 /PRNewswire/ — Cheetah Mobile Inc. (“Cheetah Mobile” or the “Company”) (NYSE: CMCM), a China-based IT company with a commitment to AI innovation, today announced its unaudited consolidated financial results for the fourth quarter and full year ended December 31, 2025.

Full Year 2025 Financial Highlights

Total revenues increased by 42.6% year over year to RMB 1,150.4 million (US$164.5 million) in 2025, driven by strong expansion across business segments.

  • Revenue from the Internet business increased by 19.0% year over year to RMB 615.3 million (US$88.0 million) .
  • Revenue from the AI and Others segment increased by 84.7% year over year to RMB 535.2 million (US$76.5 million), reflecting continued scaling of the Company’s emerging initiatives. The AI and Others segment accounted for 46.5% of total revenues in 2025, compared with 35.9% in 2024.

Gross profit increased by 53.0% year over year to RMB 834.0 million (US$119.3 million). Gross margin improved to 72.5% in 2025 from 67.6% in 2024. On a non-GAAP basis, gross profit was RMB 834.0 million (US$119.3 million), and non-GAAP gross margin was 72.5%.

Operating loss decreased by 59.0% year over year to RMB 179.4 million (US$25.7 million) in 2025. On a non-GAAP basis, operating profit was RMB 14.2 million (US$2.0 million), compared with a non-GAAP operating loss of RMB 231.8 million in 2024.

  • The Internet business generated adjusted operating profit of approximately RMB 114.9 million in 2025, representing a 82.8% year-over-year increase and reflecting improving profitability and strong cash flow generation. Adjusted operating margin for this segment was 18.7% in 2025, compared with 12.1% in 2024.
  • The AI and Others segment reported an adjusted operating loss of approximately RMB 274.5 million in 2025, representing a 42.1% year-over-year reduction, as the Company continued improving operating efficiency while scaling emerging initiatives.

Cash and cash equivalents were RMB 1,506.6 million (US$215.4 million) as of December 31, 2025.

Fourth Quarter 2025 Financial Highlights

Total revenues increased by 30.3% year over year and 7.5% quarter over quarter to RMB 308.9 million (US$44.2 million) in the fourth quarter of 2025.

  • Revenue from the Internet business was RMB 155.9 million (US$22.3 million) in the fourth quarter of 2025. While Internet business revenue declined slightly year over year, it increased 9.5% quarter over quarter.
  • Revenue from the AI and Others segment reached RMB 153.0 million (US$21.9 million), representing a 98.8% year-over-year increase and a 5.5% quarter-over-quarter increase, reflecting continued growth momentum of the Company’s emerging initiatives. The AI and Others segment accounted for 49.5% of total revenues in the fourth quarter of 2025, compared with 32.5% in the same period last year, representing nearly half of total revenue.

Gross profit increased by 18.9% year over year to RMB 205.4 million (US$29.4 million) in the fourth quarter of 2025. On a non-GAAP basis, gross profit increased by 19.2% year over year to RMB 205.4 million (US$29.4 million).

Operating loss decreased by 29.6% year over year to RMB 145.8 million (US$20.8 million) in the fourth quarter of 2025. On a non-GAAP basis, operating profit was RMB 15.5 million (US$2.2 million), compared with a non-GAAP operating loss of RMB 42.5 million in the fourth quarter of 2024.

  • The Internet business generated adjusted operating profit of approximately RMB 46.7 million in the fourth quarter of 2025, representing a 78.1% year-over-year increase, and continued to serve as a stable profit contributor to the Company.
  • The AI and Others segment reported an adjusted operating loss of approximately RMB 183.3 million in the fourth quarter of 2025, representing a 19.7% year-over-year reduction in operating loss.

Management Commentary

Fu Sheng, Chief Executive Officer of Cheetah Mobile, commented: “2025 marked a turning point for Cheetah Mobile. We delivered revenue growth while meaningfully improving operating efficiency and achieved full-year non-GAAP operating profitability. Our robotics business, which represented approximately 18.9% of total revenue in the fourth quarter, increased 93.6% year over year and 42.9% quarter over quarter, showing strong growth momentum. We are expanding our robotic product portfolio with a consumer-facing smart wheelchair, leveraging our existing autonomous mobility technologies. Our internet business remained a stable cash-generating platform, supporting disciplined investment in AI-driven capabilities. Leveraging our long-standing utility product experience, we continued to enhance our AI agent products, with the introduction of EasyClaw, our AI coworker platform designed to help users create and deploy AI agents more easily. While monetization remains at an early stage, these initiatives are part of our long-term strategy to build sustainable growth engines.”

Thomas Ren, Chief Financial Officer of Cheetah Mobile, commented: “In 2025, we continued to strengthen operating discipline and improve cost efficiency across the organization. Although we reported a GAAP operating loss for the year, operating loss narrowed significantly year over year. On a non-GAAP basis, we achieved operating profitability, reflecting an improved cost structure and increasing operating leverage. Within our Internet business, internet value-added services, which contributed 74.8% of this segment’s revenues in the fourth quarter of 2025, expanded by 32.0% year over year and 16.2% quarter over quarter, enhancing earnings visibility and margin stability. In our AI and Others segment, revenue contribution increased year over year and accounted for nearly half of total revenues in the fourth quarter of 2025, while operating loss narrowed as we maintained selective investment and cost control. We ended the year with a solid cash position, providing financial flexibility to support disciplined capital allocation.”

Conference Call Information

The Company will hold a conference call on March 24, 2026, at 7:00 a.m. Eastern Time (or 7:00 p.m. Beijing Time) to discuss its financial results. Listeners may access the call by dialing the following numbers:

Main Line:
International: 1-412-317-6061
United States Toll Free: 1-888-317-6003
Mainland China Toll Free: +86-4001-206115
Hong Kong Toll Free: 800-963976
Conference ID: 8826704

English Translation:
International: 1-412-317-6061
United States Toll Free: 1-888-317-6003
Mainland China Toll Free: +86-4001-206115
Hong Kong Toll Free: 800-963976
Conference ID: 6928279

A live and archived webcast of the conference call will also be available at the Company’s investor relations website at http://ir.cmcm.com.  

Exchange Rate

This press release contains translations of certain Renminbi amounts into U.S. dollars at specified rates solely for the convenience of readers. Unless otherwise noted, all translations from Renminbi to U.S. dollars in this press release were made at a rate of RMB6.9931 to US$1.00, the exchange rate in effect as of December 31, 2025, as set forth in the H.10 statistical release of the Federal Reserve Board. Such translations should not be construed as representations that RMB amounts could be converted into U.S. dollars at that rate or any other rate, or to be the amounts that would have been reported under accounting principles generally accepted in the United States of America (“U.S. GAAP”).

About Cheetah Mobile Inc.

Cheetah Mobile is a China-based IT company with a commitment to AI innovation. It has developed and launched a diversified suite of software products for PCs and mobile devices, designed to address users’ needs in document processing, system optimization, image editing and web browsing, among others. Cheetah Mobile provides advertising services to advertisers worldwide, value-added services including the sale of premium membership to its users, multi-cloud management platform to companies globally, as well as robotic products to international clients. At the same time, it actively engages in research and development of advanced technologies to empower its products and services. Cheetah Mobile has been listed on the New York Stock Exchange since May 2014.

Safe Harbor Statement

This press release contains forward-looking statements. These statements, including management quotes and business outlook, constitute forward-looking statements under the U.S. Private Securities Litigation Reform Act of 1995. These forward-looking statements can be identified by terminology such as “will,” “expects,” “anticipates,” “future,” “intends,” “plans,” “believes,” “estimates” and similar statements. Such statements involve inherent risks and uncertainties. A number of factors could cause actual results to differ materially from those contained in the forward-looking statements, including but are not limited to the following: Cheetah Mobile’s growth strategies; Cheetah Mobile’s ability to retain and increase its user base and expand its product and service offerings; Cheetah Mobile’s ability to monetize its platform; Cheetah Mobile’s future business development, financial condition and results of operations; competition with companies in a number of industries including internet companies that provide online marketing services and internet value-added services; expected changes in Cheetah Mobile’s revenues and certain cost or expense items; and general economic and business condition globally and in China. Further information regarding these and other risks is included in Cheetah Mobile’s filings with the U.S. Securities and Exchange Commission. Cheetah Mobile does not undertake any obligation to update any forward-looking statement as a result of new information, future events or otherwise, except as required under applicable law.

Use of Non-GAAP Financial Measures

This release contains non-GAAP financial measures, including but not limited to:

  • Non-GAAP cost of revenues excludes share-based compensation expenses;
  • Non-GAAP gross profit excludes share-based compensation expenses;
  • Non-GAAP gross margin excludes share-based compensation expenses;
  • Total non-GAAP operating expenses exclude share-based compensation expenses, amortization of intangible assets  resulting from business acquisitions, impairment of goodwill and intangible assets resulting from business acquisitions;
  • Non-GAAP research and development expenses exclude share-based compensation expenses, amortization of intangible assets  resulting from business acquisitions;
  • Non-GAAP selling and marketing expenses exclude share-based compensation expenses , amortization of intangible assets  resulting from business acquisitions;
  • Non-GAAP general and administrative expenses exclude share-based compensation expenses;
  • Non-GAAP operating profit/loss excludes share-based compensation expenses, amortization of intangible assets  resulting from business acquisitions and impairment of goodwill and intangible assets resulting from business acquisitions;
  • Non-GAAP net income/loss attributable to Cheetah Mobile shareholders excludes share-based compensation expenses, amortization of intangible assets  resulting from business acquisitions, impairment of goodwill and intangible assets resulting from business acquisitions;
  • Non-GAAP diluted earnings/losses per ADS excludes share-based compensation expenses, amortization of intangible assets  resulting from business acquisitions, impairment of goodwill and intangible assets resulting from business acquisitions.

The Company reviews these non-GAAP financial measures together with GAAP financial measures to obtain a better understanding of its operating performance. It uses the non-GAAP financial measures for planning, forecasting and measuring results against the forecast. The Company believes that non-GAAP financial measures are useful supplemental information for investors and analysts to assess its operating performance without the effect of share-based compensation expenses, amortization of intangible assets, amortization of intangible assets  resulting from business acquisitions, impairment of goodwill and intangible assets resulting from business acquisitions, which have been and will continue to be significant recurring expenses in its business. However, the use of non-GAAP financial measures has material limitations as an analytical tool. One of the limitations of using non-GAAP financial measures is that they do not include all items that impact the Company’s net income for the period. In addition, because non-GAAP financial measures are not measured in the same manner by all companies, they may not be comparable to other similarly titled measures used by other companies. In light of the foregoing limitations, you should not consider non-GAAP financial measure in isolation from or as an alternative to the financial measure prepared in accordance with U.S. GAAP. For more information on these non-GAAP financial measures, please see the tables captioned “Cheetah Mobile Inc. Reconciliation of GAAP and non-GAAP Results”.

Investor Relations Contact

Helen Jing Zhu
Cheetah Mobile Inc.
Tel: +86 10 6292 7779
Email: ir@cmcm.com 


CHEETAH MOBILE INC.

Condensed Consolidated Balance Sheets

(Unaudited, amounts in thousands of Renminbi (“RMB”) and US dollars (“US$”))

As of

December 31, 2024

December 31, 2025

RMB

RMB

USD

ASSETS

Current assets:

Cash and cash equivalents

1,833,031

1,506,625

215,445

Short-term investments

335

9,527

1,362

Accounts receivable, net

473,619

468,058

66,931

Prepayments and other current assets, net

1,365,761

1,154,774

165,132

Due from related parties, net

106,934

94,821

13,559

Total current assets

3,779,680

3,233,805

462,429

Non-current assets:

Property and equipment, net

51,564

40,238

5,754

Operating lease right-of-use assets

26,323

16,833

2,407

Intangible assets, net

190,665

54,069

7,732

Goodwill

424,099

460,034

65,784

Long-term investments

817,330

688,459

98,448

Deferred tax assets

128,581

112,913

16,146

Other non-current assets

86,059

77,521

11,085

Total non-current assets

1,724,621

1,450,067

207,356

Total assets

5,504,301

4,683,872

669,785

LIABILITIES, MEZZANINE EQUITY
AND SHAREHOLDERS’ EQUITY

Current liabilities:

Accounts payable

219,566

211,689

30,271

Accrued expenses and other current liabilities

2,756,805

2,264,659

323,842

Due to related parties

69,606

18,613

2,662

Income tax payable

35,804

54,430

7,783

Total current liabilities

3,081,781

2,549,391

364,558

Non-current liabilities:

Deferred tax liabilities

43,046

21,711

3,105

Other non-current liabilities

172,348

154,422

22,082

Total non-current liabilities

215,394

176,133

25,187

Total liabilities

3,297,175

2,725,524

389,745

Mezzanine equity:

Redeemable noncontrolling interests

189,725

197,560

28,251

Shareholders’ equity:

Ordinary shares

248

254

36

Additional paid-in capital

2,722,504

2,736,117

391,260

Accumulated deficit

(1,232,577)

(1,490,947)

(213,203)

Accumulated other comprehensive income

410,423

362,245

51,800

Total Cheetah Mobile Inc. shareholders’
equity

1,900,598

1,607,669

229,893

Noncontrolling interests

116,803

153,119

21,896

Total shareholders’ equity

2,017,401

1,760,788

251,789

Total liabilities, mezzanine equity and
shareholders’ equity

5,504,301

4,683,872

669,785


CHEETAH MOBILE INC.

Condensed Consolidated Statements of Comprehensive Loss

(Unaudited, amounts in thousands of Renminbi (“RMB”) and US dollars (“US$”), except for number of shares and per share(or ADS) data)

For The Three Months Ended

For The Year Ended

December 31,
2024

December 31,
2025

December 31,
2025

December 31,
2024

December 31,
2025

December 31,
2025

RMB

RMB

USD

RMB

RMB

USD

Revenues

237,089

308,851

44,165

806,877

1,150,444

164,511

     Internet business

160,152

155,896

22,293

517,188

615,281

87,984

     AI and others

76,937

152,955

21,872

289,689

535,163

76,527

Cost of revenues (a)

(64,317)

(103,475)

(14,797)

(261,682)

(316,411)

(45,246)

Gross profit

172,772

205,376

29,368

545,195

834,033

119,265

Operating income and expenses:

Research and development (a)

(65,506)

(149,863)

(21,430)

(243,391)

(346,152)

(49,499)

Selling and marketing (a)

(104,851)

(72,657)

(10,390)

(342,421)

(362,735)

(51,870)

General and administrative (a)

(56,281)

(87,101)

(12,455)

(244,385)

(266,522)

(38,112)

Impairment of goodwill and intangible
assets

(152,890)

(41,563)

(5,943)

(152,890)

(41,563)

(5,943)

Other operating (expense)/income

(377)

31

4

637

3,496

500

Total operating income and expenses

(379,905)

(351,153)

(50,214)

(982,450)

(1,013,476)

(144,924)

Operating loss

(207,133)

(145,777)

(20,846)

(437,255)

(179,443)

(25,659)

Other income/(expenses):

Interest income, net

9,862

5,484

784

44,422

30,629

4,380

Foreign exchange (losses)/gains

(32,236)

14,156

2,024

(21,726)

30,783

4,402

Other expense, net

(82,300)

(74,481)

(10,651)

(139,769)

(108,652)

(15,537)

Loss before income taxes

(311,807)

(200,618)

(28,689)

(554,328)

(226,683)

(32,414)

Income tax (expenses)/benefits

(51,064)

13,722

1,962

(47,258)

(8,469)

(1,211)

Net loss

(362,871)

(186,896)

(26,727)

(601,586)

(235,152)

(33,625)

Less: net income attributable to
noncontrolling interests

3,913

3,843

550

15,971

22,561

3,226

Net loss attributable to Cheetah
Mobile shareholders

(366,784)

(190,739)

(27,277)

(617,557)

(257,713)

(36,851)

Net loss per share

Basic

(0.2438)

(0.1262)

(0.0180)

(0.4161)

(0.1754)

(0.0251)

Diluted

(0.2439)

(0.1262)

(0.0180)

(0.4162)

(0.1764)

(0.0252)

Net loss per ADS

Basic

(12.1907)

(6.3082)

(0.9000)

(20.8042)

(8.7724)

(1.2550)

Diluted

(12.1947)

(6.3082)

(0.9000)

(20.8097)

(8.8185)

(1.2600)

Weighted average number of shares
outstanding

Basic

1,512,707,145

1,550,604,238

1,550,604,238

1,503,054,847

1,533,473,068

1,533,473,068

Diluted

1,512,707,145

1,550,604,238

1,550,604,238

1,503,054,847

1,533,473,068

1,533,473,068

Weighted average number of ADSs
outstanding

Basic

30,254,143

31,012,085

31,012,085

30,061,097

30,669,461

30,669,461

Diluted

30,254,143

31,012,085

31,012,085

30,061,097

30,669,461

30,669,461

Other comprehensive income/(loss) ,
net of tax of nil

Foreign currency translation adjustments

51,667

(25,511)

(3,648)

49,045

(50,422)

(7,210)

Unrealized gains/(losses) on available-
for-sale securities, net

7,277

(5,541)

(792)

2,642

1,121

160

Other comprehensive income/(loss)

58,944

(31,052)

(4,440)

51,687

(49,301)

(7,050)

Total comprehensive loss

(303,927)

(217,948)

(31,167)

(549,899)

(284,453)

(40,675)

Less: Total comprehensive income
attributable to noncontrolling
interests

2,199

1,889

270

14,089

21,438

3,066

Total comprehensive loss attributable to
Cheetah Mobile shareholders

(306,126)

(219,837)

(31,437)

(563,988)

(305,891)

(43,741)

For The Three Months Ended

For The Year Ended

December 31,
2024

December 31,
2025

December 31,
2025

December 31,
2024

December 31,
2025

December 31,
2025

(a) Share-based compensation expenses

RMB

RMB

USD

RMB

RMB

USD

Cost of revenues

(460)

2

–

81

16

2

Research and development

1,280

1,007

144

1,924

1,193

171

Selling and marketing

(495)

290

41

(662)

773

111

General and administrative

4,819

7,867

1,125

24,758

17,858

2,554

Total

5,144

9,166

1,310

26,101

19,840

2,838


CHEETAH MOBILE INC.

Reconciliation of GAAP and Non-GAAP Results

(Unaudited, amounts in thousands of Renminbi (“RMB”) and US dollars (“US$”), except for per share data )

For The Three Months Ended December 31, 2025

For The Year Ended December 31, 2025

GAAP

Share-based

Amortization
of

Impairment

Non-GAAP

GAAP

Share-based

Amortization
of

Impairment

Non-GAAP

Result

Compensation

intangible
assets*

of goodwill
and

intangible
assets

Result

Result

Compensation

intangible
assets*

of goodwill
and

intangible
assets

Result

RMB

RMB

RMB

RMB

RMB

USD

RMB

RMB

RMB

RMB

RMB

USD

Revenues

308,851

–

–

–

308,851

44,165

1,150,444

–

–

–

1,150,444

164,511

Cost of revenues

(103,475)

2

–

–

(103,473)

(14,797)

(316,411)

16

–

–

(316,395)

(45,244)

Gross profit

205,376

2

–

–

205,378

29,368

834,033

16

–

–

834,049

119,267

Research and development

(149,863)

1,007

108,471

–

(40,385)

(5,775)

(346,152)

1,193

127,171

–

(217,788)

(31,143)

Selling and marketing

(72,657)

290

2,070

–

(70,297)

(10,053)

(362,735)

773

5,078

–

(356,884)

(51,033)

General and administrative

(87,101)

7,867

–

–

(79,234)

(11,330)

(266,522)

17,858

–

–

(248,664)

(35,558)

Impairment of goodwill and
intangible assets

(41,563)

–

–

41,563

–

–

(41,563)

–

–

41,563

–

–

Other operating income, net

31

–

–

–

31

4

3,496

–

–

–

3,496

500

Total operating income and
expenses

(351,153)

9,164

110,541

41,563

(189,885)

(27,154)

(1,013,476)

19,824

132,249

41,563

(819,840)

(117,234)

Operating (loss)/income

(145,777)

9,166

110,541

41,563

15,493

2,214

(179,443)

19,840

132,249

41,563

14,209

2,033

Net loss attributable to Cheetah
Mobile shareholders

(190,739)

9,166

110,541

41,563

(29,469)

(4,217)

(257,713)

19,840

132,249

41,563

(64,061)

(9,159)

Diluted losses per ordinary share
(RMB)

(0.1262)

0.0059

0.0714

0.0268

(0.0221)

(0.1764)

0.0129

0.0863

0.0271

(0.0501)

Diluted losses per ADS (RMB)

(6.3082)

0.2950

3.5682

1.3400

(1.1050)

(8.8185)

0.6450

4.3135

1.3550

(2.5050)

Diluted losses per ADS (USD)

(0.9000)

0.0422

0.5082

0.1916

(0.1580)

(1.2600)

0.0922

0.6158

0.1938

(0.3582)


For The Three Months Ended December 31, 2024

For The Year Ended December 31, 2024

GAAP

Share-based

Amortization of

Impairment

Non-GAAP

GAAP

Share-based

Amortization of

Impairment

Non-GAAP

Result

Compensation

intangible
assets*

of goodwill
and

intangible
assets

Result

Result

Compensation

intangible
assets*

of goodwill
and

intangible
assets

Result

RMB

RMB

RMB

RMB

RMB

RMB

RMB

RMB

RMB

RMB

Revenues

237,089

–

–

–

237,089

806,877

–

–

–

806,877

Cost of revenues

(64,317)

(460)

–

–

(64,777)

(261,682)

81

–

–

(261,601)

Gross profit

172,772

(460)

–

–

172,312

545,195

81

–

–

545,276

Research and development

(65,506)

1,280

6,156

–

(58,070)

(243,391)

1,924

24,624

–

(216,843)

Selling and marketing

(104,851)

(495)

469

–

(104,877)

(342,421)

(662)

1,876

–

(341,207)

General and administrative

(56,281)

4,819

–

–

(51,462)

(244,385)

24,758

–

–

(219,627)

Impairment of goodwill and intangible
assets

(152,890)

–

–

152,890

–

(152,890)

–

–

152,890

–

Other operating income, net

(377)

–

–

–

(377)

637

–

–

–

637

Total operating income and expenses

(379,905)

5,604

6,625

152,890

(214,786)

(982,450)

26,020

26,500

152,890

(777,040)

Operating loss

(207,133)

5,144

6,625

152,890

(42,474)

(437,255)

26,101

26,500

152,890

(231,764)

Net loss attributable to Cheetah Mobile
shareholders

(366,784)

5,144

6,625

152,890

(202,125)

(617,557)

26,101

26,500

152,890

(412,066)

Diluted losses per ordinary share (RMB)

(0.2439)

0.0034

0.0044

0.1011

(0.1350)

(0.4162)

0.0174

0.0176

0.1017

(0.2795)

Diluted losses per ADS (RMB)

(12.1947)

0.1700

0.2200

5.0547

(6.7500)

(20.8097)

0.8700

0.8800

5.0847

(13.9750)


* This represents amortization of intangible assets resulting from business acquisitions.


CHEETAH MOBILE INC.

Information about Segment

(Unaudited, amounts in thousands of Renminbi (“RMB”) and US dollars (“US$”), except for percentage)

For The Three Months Ended  December 31, 2025

For The Year Ended December 31, 2025

Internet Business

AI and others

Consolidated

Internet Business

AI and others

Consolidated

RMB

RMB

RMB

USD

RMB

RMB

RMB

USD

Revenues

155,896

152,955

308,851

44,165

615,281

535,163

1,150,444

164,511

Operating Costs and expenses

Cost of revenues(i)

31,300

72,173

103,473

14,797

106,606

209,789

316,395

45,244

Selling and marketing(i)

45,326

27,041

72,367

10,349

220,312

141,650

361,962

51,759

Research and development(i)

10,367

138,489

148,856

21,286

110,060

234,899

344,959

49,328

Other segment items(i)

22,237

98,529

120,766

17,269

63,436

223,295

286,731

41,001

Adjusted operating income/(losses)

46,666

(183,277)

(136,611)

(19,536)

114,867

(274,470)

(159,603)

(22,821)

Unallocated amounts-share based compensations

(9,166)

(1,310)

(19,840)

(2,838)

Operating loss

(145,777)

(20,846)

(179,443)

(25,659)

Reconciliation of segment profit/(loss)

Interest income, net

5,484

784

30,629

4,380

Foreign exchange gains, net

14,156

2,024

30,783

4,402

Other expense, net

(74,481)

(10,651)

(108,652)

(15,537)

Loss before income taxes

(200,618)

(28,689)

(226,683)

(32,414)


For The Three Months Ended December 31, 2024

For The Year Ended December 31, 2024

Internet
Business

AI and others

Consolidated

Internet
Business

AI and others

Consolidated

RMB

RMB

RMB

RMB

RMB

RMB

Revenues

160,152

76,937

237,089

517,188

289,689

806,877

Operating Costs and expenses

Cost of revenues(i)

21,174

43,603

64,777

79,812

181,789

261,601

Selling and marketing(i)

70,243

35,103

105,346

200,945

142,138

343,083

Research and development(i)

30,651

33,575

64,226

115,476

125,991

241,467

Other segment items(i)

11,877

192,852

204,729

58,122

313,758

371,880

Adjusted operating income/(losses)

26,207

(228,196)

(201,989)

62,833

(473,987)

(411,154)

Unallocated amounts-share based compensations

(5,144)

(26,101)

Operating loss

(207,133)

(437,255)

Reconciliation of segment profit/(loss)

Interest income, net

9,862

44,422

Foreign exchange gains, net

(32,236)

(21,726)

Other expense, net

(82,300)

(139,769)

Loss before income taxes

(311,807)

(554,328)


(i) Share-based compensations were not allocated to segments. Other segment items include general and administrative expenses and other operating expenses allocated to the respective segments.


CHEETAH MOBILE INC.

Reconciliation from Net Loss Attributable to Cheetah Mobile Shareholders to Adjusted EBITDA (Non-GAAP)

(Unaudited, amounts in thousands of Renminbi (“RMB”) and US dollars (“US$”))

For The Three Months Ended

For The Year Ended

December 31,
2024

December 31,
2025

December 31,
2025

December 31,
2024

December 31,
2025

December 31,
2025

RMB

RMB

USD

RMB

RMB

USD

Net loss attributable to Cheetah Mobile
shareholders

(366,784)

(190,739)

(27,277)

(617,557)

(257,713)

(36,851)

Add:

Income tax expenses/(benefits)

51,064

(13,722)

(1,962)

47,258

8,469

1,211

Interest income, net

(9,862)

(5,484)

(784)

(44,422)

(30,629)

(4,380)

Depreciation and other amortization

14,619

114,426

16,363

51,453

147,235

21,054

Net income attributable to noncontrolling
interests

3,913

3,843

550

15,971

22,561

3,226

Other expense, net

114,536

60,325

8,627

161,495

77,869

11,135

Share-based compensation

5,144

9,166

1,310

26,101

19,840

2,838

Impairment of goodwill and intangible
assets

152,890

41,563

5,943

152,890

41,563

5,943

Adjusted EBITDA

(34,480)

19,378

2,770

(206,811)

29,195

4,176