Home Blog Page 801

Gamehaus Holdings Inc. Announces Unaudited Financial Results for the Second Quarter of Fiscal 2026 Ended December 31, 2025

SHANGHAI, March 23, 2026 /PRNewswire/ — Gamehaus Holdings Inc. (“Gamehaus” or the “Company”) (Nasdaq: GMHS), a technology-driven mobile game publisher, today announced its unaudited financial results for the second quarter of fiscal year 2026 ended December 31, 2025.

Second Quarter of Fiscal Year 2026 Financial Highlights

  • Total revenue was US$26.3 million, representing a 7.8% decrease from US$28.5 million in the second quarter of fiscal year 2025. In-app purchases contributed US$23.9 million, while advertising revenue reached US$2.4 million.
  • Total operating costs and expenses were US$25.4 million, representing a 10.1% reduction from US$28.3 million in the second quarter of fiscal year 2025.
  • Net income was US$0.9 million, representing a 151.2% increase from US$0.4 million in the second quarter of fiscal year 2025.

Second Quarter of Fiscal Year 2026 Operating Highlights

in thousands, except percentages

For the Three Months Ended

December 31,

2025

2024

Average MAUs[1]

2,760

3,832

Average DAUs[2]

499

716

ARPDAU[3]

0.566

0.440

Average DPUs[4]

13

15

Average Daily Payer Conversion Rate[5]

2.5

%

2.1

%

Average 7D Retention Rate[6]

8.7

%

10.2

%

[1] Average Monthly Active Users, or Average MAUs, is defined as the number of individual users who play a game during a particular month.

[2] Average Daily Active Users, or Average DAUs, is defined as the number of individual users who play a game on a particular day.

[3] Average Revenue Per Daily Active User, or ARPDAU, is calculated by dividing revenue generated during a specific period by the Average DAU for that period, then further dividing by the number of days in the period.

[4] Average Daily Paying Users, or Average DPUs, is defined as the number of individuals who made a purchase in a game during a particular day.

[5] Average Daily Payer Conversion Rate is calculated by dividing Average DPUs for a specific period by the Average DAUs for that period.

[6] Average Day Seven Retention Rate is calculated by dividing the number of new users who continue using the app on the seventh day after installation for a specific period by the total number of new users for that period.

Mr. Feng Xie, founder and chairman of Gamehaus, commented: “We are pleased with our second quarter results, which demonstrate continued progress in our transition toward a more efficient and sustainable operating model. Revenue of $26.3 million came in near the upper end of ourrevenue forecast for the second quarter, and more importantly, net income grew approximately 151% period-over-period while operating margin expanded to 3.3% from 0.8% in the year-ago period. These improvements reflect the cumulative impact of the disciplined adjustments we have made across our cost structure, user acquisition strategy, and product portfolio over the past several quarters. Looking ahead, we are advancing a diversified product pipeline across both RPG and Puzzle genres, with multiple titles moving into active development and scheduled launches. We remain focused on strengthening our platform capabilities and leveraging AI-driven efficiencies to position us for our next phase of growth.”

Second Quarter of Fiscal Year 2026 Unaudited Financial Results

Revenue

Total revenue was US$26.3 million in the second quarter of fiscal year 2026, decreasing 7.8% from US$28.5 million in the second quarter of fiscal year 2025. The decline primarily resulted from the Company’s reduction in user acquisition spending, which was a strategic move to optimize resource allocation and redirect investment toward the development of new game categories and upcoming projects, as well as their subsequent launch and promotion, aiming to strengthen the Company’s game portfolio and support sustainable long-term growth.

Advertising costs decreased by 18.9% in the second quarter of fiscal year 2026 compared to the second quarter of fiscal year 2025, resulted in reduced traffic and user acquisition, which in turn affected revenue performance. In-app purchase revenue decreased 6.4% to US$23.9 million in the second quarter of fiscal year 2026 from US$25.5 million in the second quarter of fiscal year 2025, while advertising revenue was US$2.4 million in the second quarter of fiscal year 2026, compared to US$3.0 million in the second quarter of fiscal year 2025. These headwinds were partially offset by enhanced in-game content and live-ops features, which continued to drive engagement and monetization among the Company’s existing player base.

Additionally, the Company is actively expanding its pipeline of games, with new titles in the Puzzle and RPG genres currently in the development and testing phase. The Company strategically allocated marketing budgets to support these products and intends to launch extensive promotional campaigns upon their commercial release.

Operating Costs and Expenses

Total operating costs and expenses were US$25.4 million in the second quarter of fiscal year 2026, representing a 10.1% reduction from US$28.3 million in the second quarter of fiscal year 2025.

  • Cost of revenue decreased by 10.2% to US$12.2 million in the second quarter of fiscal year 2026, from US$13.5 million in the second quarter of fiscal year 2025. The decrease was primarily due to lower platform fees and reduced profit-sharing payments to game developers.
  • Research and development expenses increased 7.5% to US$2.1 million in the second quarter of fiscal year 2026, from US$2.0 million in the second quarter of fiscal year 2025. The increase was mainly attributable to the Company’s strategic collaborations with multiple developers throughout the development and testing phases.
  • Selling and marketing expenses decreased by 18.4% to US$9.7 million in the second quarter of fiscal year 2026, from US$11.9 million in the second quarter of fiscal year 2025. The reduction was primarily driven by a US$2.1 million decline in advertising costs related to player acquisition and retention, consistent with the Company’s strategy to scale back promotional spending amid volatile ad performance across major platforms and to optimize efficiency for mature titles.
  • General and administrative expenses were US$1.4 million in the second quarter of fiscal year 2026, representing an increase of 65.5% from US$0.9 million in the second quarter of fiscal year 2025. The increase was primarily attributable to higher salary expenses primarily associated with the Company’s efforts to improvecorporate governance, financial reporting, and investor relations capabilities as a public company, as well as the strengthening of the management team and key functional roles as part of its strategic workforce planning to support business expansion and long-term growth.

Operating Income

Operating income was US$0.9 million in the second quarter of fiscal year 2026, compared to US$0.2 million in the second quarter of fiscal year 2025. Operating margin was 3.3% in the second quarter of fiscal year 2026, compared to 0.8% in the second quarter of fiscal year 2025.

Other Income, Net

Other income, net, which mainly included the Company’s non-operating income and expenses, interest income and expenses, investment income (loss), and other income and expenses, was US$0.1 million in the second quarter of fiscal year 2026, compared to US$0.2 million in the second quarter of fiscal year 2025.

Net Income

Net income was US$0.9 million for the second quarter of fiscal year 2026, compared to US$0.4 million in the second quarter of fiscal year 2025. Net income attributable to Gamehaus Holdings Inc.’s shareholders per ordinary share was US$0.02 for the second quarter of fiscal year 2026, compared to US$0.01 in the second quarter of fiscal year 2025.

Cash and Cash Equivalents

Cash and cash equivalents were US$17.4 million as of December 31, 2025, compared to US$15.2 million as of June 30, 2025, which the Company believes is sufficient to meet its current liquidity and working capital needs for the next 12 months.

Business Outlook

For the third quarter of fiscal year 2026 ending March 31, 2026, the Company expects its total revenue to be in the range of approximately US$24 million to US$26 million. This forecast reflects the Company’s current and preliminary view of its expected financial performance, business situation and market condition, which is subject to change.

Recent Development

Share Repurchase Plan Update

In August 2025, the board of directors of the Company approved a share repurchase plan, pursuant to which the aggregate value of Class A ordinary shares authorized for repurchase under the plan through August 28, 2026 shall not exceed US$5 million. Repurchases may be made from time to time through open market transactions at prevailing market prices, in privately negotiated transactions, in block trades, and/or through other legally permissible means, including through the use of trading plans, intended to qualify under Rule 10b-18 under the Securities Exchange Act of 1934, as amended, in accordance with applicable securities laws and other restrictions and subject to market conditions and in accordance with applicable federal securities laws. The timing and actual amount of repurchases will be determined at the discretion of the Company’s management, based on factors including share price, trading volume, market conditions, business outlook, and capital allocation priorities. 

As of December 31, 2025, the Company had repurchased approximately 370,000 of its Class A ordinary shares for approximately US$459,000.

Conference Call Information

The management team of Gamehaus will host a conference call at 08:00 A.M. Eastern Time on Monday, March 23, 2026 (08:00 P.M. Beijing/Hong Kong time on the same day) to discuss the financial results. In advance of the conference call, all participants must use the following link to complete the online registration process. Upon registering, each participant will receive access details for this conference including a conference passcode, a unique PIN number (personal access code), dial-in numbers, and an e-mail with detailed instructions to join the conference call.

Participant Online Registration: https://dpregister.com/sreg/10207119/10368ff0a4d

A live and archived webcast of the conference call will be available on the Company’s Investor Relations website at https://ir.gamehaus.com/.

About Gamehaus

Gamehaus Holdings Inc. is a technology-driven global mobile game publisher dedicated to bridging creative studios and players worldwide. With a portfolio spanning mid-core and casual games, Gamehaus delivers full-stack publishing support across market insights, user growth, live-ops, data analytics and monetization optimization. With a vision to be the go-to partner for creative teams, the company specializes in combining global publishing reach with AI- and data-powered solutions to help partners build lasting success. For more information, please visit https://ir.gamehaus.com.

Forward-Looking Statements

Certain statements in this announcement are forward-looking statements, including, but not limited to, the Company’s business plan and outlook. These forward-looking statements involve known and unknown risks and uncertainties and are based on the Company’s current expectations and projections about future events that may affect its financial condition, results of operations, business strategy and financial needs. Investors can find many (but not all) of these statements by the use of words such as “approximates,” “believes,” “hopes,” “expects,” “anticipates,” “estimates,” “projects,” “intends,” “plans,” “will,” “would,” “should,” “could,” “may”, or other similar expressions in this press release. The Company undertakes no obligation to update or revise publicly any forward-looking statements to reflect subsequent occurring events or circumstances, or changes in its expectations, except as may be required by law. Although the Company believes that the expectations expressed in these forward-looking statements are reasonable, it cannot assure you that such expectations will turn out to be correct, and the Company cautions investors that actual results may differ materially from the anticipated results due to various risks and uncertainties, including but not limited to those described under the “Risk Factors” section in the Company’s annual report on Form 20-F filed with the U.S. Securities and Exchange Commission.

Investor Relations Contact

Gamehaus Holdings Inc.
Investor Relations Team
Email: IR@Gamehaus.com 

The Blueshirt Group
Mr. Jack Wang
Email: Gamehaus@TheBlueshirtGroup.co 


GAMEHAUS HOLDINGS INC. AND ITS SUBSIDIARIES

UNAUDITED CONDENSED CONSOLIDATED BALANCE SHEETS

(Amount in USD dollars, except for number of shares or otherwise noted)

As of

December 31,

2025

June 30,

2025

(Unaudited)

(Audited)

ASSETS

CURRENT ASSETS:

Cash and cash equivalents

$

17,355,214

$

15,234,745

Short-term investments

2,609,549

1,345,154

Accounts receivable

9,876,025

10,423,418

Advanced to suppliers

9,737,823

9,442,382

Prepaid expenses and other current assets

3,599,492

3,128,788

TOTAL CURRENT ASSETS

43,178,103

39,574,487

NON-CURRENT ASSETS:

Plant and equipment, net

142,139

124,503

Intangible assets, net

4,619,603

5,001,523

Right-of-use assets, net

332,610

512,647

Equity investments

1,951,542

1,995,021

TOTAL NON-CURRENT ASSETS

7,045,894

7,633,694

TOTAL ASSETS

$

50,223,997

$

47,208,181

LIABILITIES

CURRENT LIABILITIES:

Short-term borrowing

$

286,000

$

–

Accounts payable

10,112,213

10,752,234

Contract liabilities

1,711,540

1,871,120

Accrued expenses and other current liabilities

1,473,620

903,252

Lease liabilities

262,856

463,064

Taxes payable

75,570

51,599

TOTAL CURRENT LIABILITIES

13,921,799

14,041,269

NON-CURRENT LIABILITY:

Lease liabilities

33,090

58,517

TOTAL NON-CURRENT LIABILITY

33,090

58,517

TOTAL LIABILITIES

$

13,954,889

$

14,099,786

SHAREHOLDERS’ EQUITY:

Class A ordinary shares (par value of $0.0001 per share;
900,000,000 shares authorized, 49,520,156 and 37,971,245 shares
issued and outstanding as of December 31, 2025 and June 30, 2025,
respectively)

4,952

3,797

Class B ordinary shares (par value of $0.0001 per share;
100,000,000 shares authorized, 7,799,057 and 15,598,113 shares
issued and outstanding as of December 31, 2025 and June 30, 2025,
respectively)

780

1,560

Additional paid-in capital

10,953,826

10,954,201

Treasury Stock

(458,738)

–

Retained earnings

26,435,808

23,543,001

Accumulated other comprehensive loss

(423,266)

(1,276,222)

TOTAL GAMEHAUS HOLDING INC’S SHAREHOLDERS’
EQUITY

36,513,362

33,226,337

Non-controlling interests

(244,254)

(117,942)

TOTAL SHAREHOLDERS’ EQUITY

36,269,108

33,108,395

TOTAL LIABILITIES AND SHAREHOLDERS’ EQUITY

$

50,223,997

$

47,208,181


GAMEHAUS HOLDINGS INC. AND ITS SUBSIDIARIES

UNAUDITED CONDENSED CONSOLIDATED STATEMENTS OF OPERATIONS

AND COMPREHENSIVE INCOME

(Amount in USD dollars, except for number of shares or otherwise noted)

For the

Three Months Ended

December 31,

For the
Six Months Ended

December 31,

2025

2024

2025

2024

(Unaudited)

(Unaudited)

(Unaudited)

(Unaudited)

REVENUE

$

26,295,028

28,518,928

$

54,033,904

$

58,488,446

OPERATING COST AND EXPENSES

   Cost of revenue

(12,155,827)

(13,542,268)

(25,438,752)

(27,565,976)

   Research and development expenses

(2,131,820)

(1,983,658)

(3,311,498)

(2,985,550)

   Selling and marketing expenses

(9,728,443)

(11,914,898)

(20,570,983)

(24,450,883)

   General and administrative expenses

(1,408,092)

(850,824)

(2,841,247)

(1,763,336)

OPERATING INCOME

$

870,846

$

227,280

$

1,871,424

$

1,722,701

OTHER INCOME (EXPENSES):

    Investment income (loss), net

(122,761)

24,668

557,325

5,225

    Interest income

160,652

124,896

335,284

279,386

    Other income, net

32,755

65,102

40,399

52,161

        Total other income, net

70,646

214,666

933,008

336,772

INCOME BEFORE INCOME TAXES

941,492

441,946

2,804,432

2,059,473

INCOME TAXES EXPENSES

(25,792)

(77,406)

(38,270)

(128,236)

NET INCOME

915,700

364,540

2,766,162

1,931,237

Less: net loss attributable to non-controlling interests

(63,206)

(38,950)

(126,645)

(29,502)

NET INCOME ATTRIBUTABLE TO
  GAMEHAUS HOLDINGS INC’S
  SHAREHOLDERS

978,906

403,490

2,892,807

1,960,739

OTHER COMPREHENSIVE INCOME

Net income

915,700

364,540

2,766,162

1,931,237

Foreign currency translation adjustment, net of tax

1,172,520

1,428,152

853,289

(180,335)

TOTAL COMPREHENSIVE INCOME

$

2,088,220

$

1,792,692

$

3,619,451

$

1,750,902

Less: total comprehensive loss attributable to non-
   controlling interests

(62,927)

(38,304)

(126,312)

(28,495)

TOTAL COMPREHENSIVE INCOME
   ATTRIBUTABLE TO GAMEHAUS
   HOLDINGS INC’S SHAREHOLDERS

2,151,147

1,830,996

3,745,763

1,779,397

BASIC AND DILUTED EARNINGS PER
   SHARE:

Net income attributable to Gamehaus Holdings Inc’s
   shareholders per share

    Basic and diluted

$

0.02

$

0.01

$

0.05

$

0.04

Weighted average shares outstanding used in
   calculating basic and diluted income per share

Basic and diluted

$

53,310,709

$

50,000,000

$

53,437,778

$

50,000,000

* Presented on a retroactive basis to reflect the reverse recapitalization.


ASUS Unveils Complete Portfolio Support for Intel® Core™ 200S Series

Accelerating Edge AI solutions

TAIPEI, March 23, 2026 /PRNewswire/ — ASUS, a global leader in AIoT solution, today announced full compatibility across its product portfolio with the newly launched Intel® Core™ 200S Series processors. This integration spans a comprehensive range of industrial motherboards, configurable turnkey-to-order (CTOS) embedded systems, and rugged edge AI computers, further empowering sophisticated edge AI applications with enhanced performance, scalability, and reliability.

ASUS Unveils Complete Portfolio Support for Intel® Core™ 200S Series

Purpose-built for embedded and industrial markets, the Intel Core 200S Series leverages the mature LGA 1700 socket and advanced performance hybrid architecture. Customers can easily upgrade existing Intel 600 series-based systems with a simple BIOS update, delivering up to 24 cores and 32 threads with PCIe® 5.0 connectivity and DDR5-5600 memory support. This unlocks significant multi-tasking and AI inferencing power—especially for demanding use cases like machine vision, autonomous vehicles, and intelligent video analytics (IVA).

ASUS is committed to long-term product availability, ensuring supply through 2035 to support extended deployment lifecycles and operational stability—critical for commercial and industrial applications. These solutions maximize the unique advantages of the Intel Core 200S Series, with purposeful design for challenging environments and evolving AI workloads.

Engineered for Reliability and Real-World Performance

ASUS AIoT solutions are engineered to deliver exceptional reliability and performance in real-world edge environments. Each system is rigorously designed to withstand the challenges of industrial and commercial deployments, offering wide operating temperature and voltage ranges as well as robust resistance to shock and vibration—up to 5 GRMS—for dependable operation in factories, vehicles, and outdoor installations. For application-specific needs, ASUS provides tailored features such as in-vehicle platforms with 8~48 volt wide-range DC input and built-in ignition power control, supporting safe and stable operation in mobile and transportation scenarios.

The integration of powerful CPUs and flexible GPU configurations enables advanced AI inferencing and multi-tasking capabilities, making ASUS platforms ideally suited for complex, vision-based edge AI deployments that demand both performance and dependability.

Product Availability

The following ASUS AIoT offerings are now available with Intel Core 200S Series processor support:

For more information, please visit: https://iot.asus.com/discover/asus-iot-edge-ai-systems/

2026 CIFM / interzum guangzhou Ushers in a New Era of Smart Furniture Manufacturing

GUANGZHOU, China, March 23, 2026 /PRNewswire/ — From 28 to 31 March 2026, CIFM / interzum guangzhou, co-organized by Koelnmesse GmbH and China Foreign Trade Centre Group, Ltd., will return to Canton Fair Complex in Guangzhou, China. Under the core theme of “Smart Revolution”, the fair will establish a 180,000 sqm trading platform, bringing together around 1,600 leading global enterprises and expecting to attract more than 220,000 professional visitors.


interzum guangzhou 2026 Video

Endorsement from Global Leaders

As Asia’s most comprehensive trade fair for woodworking and upholstery machinery, furniture production and interior design, CIFM / interzum guangzhou 2026 has garnered significant global attention. Industry leaders have shared their messages, inviting the global furniture community to explore the smart transformation of the furniture sector.

Matthias Pollmann, Vice President of Koelnmesse GmbH, stated: “As a crucial anchor in the interzum brand family, interzum guangzhou is dedicated to reshaping the Asian furniture industry landscape. The 2026 fair will gather the pinnacle of global furniture manufacturing, promoting green, intelligent production and global collaboration to build a more structured industry ecosystem.”

Frederik Meyer, President of the European Federation of Woodworking Machinery Manufacturers (EUMABOIS), extended a warm invitation: “interzum guangzhou is an essential opportunity to discover innovation, build partnerships, and strengthen presence in a market that keeps evolving at great speed. It offers a valuable opportunity to explore the halls, join the forums, and take part in conversations that can inspire new solutions from manufacturing technologies to design trends and next-generation materials.”

Ian Chang, Chairman of the Taiwan Woodworking Machinery Association (TWMA), also expressed high expectations: “This exhibition is one of the most influential platforms for the Asian woodworking and furniture industry. It will showcase cutting-edge technologies and solutions for global furniture production machinery, providing invaluable communication opportunities for suppliers, partners, and professional buyers from around the world.”

Upgraded International Lineup

The international participation at this year’s fair will reach new heights, with five halls covering core furniture manufacturing categories, offering one-stop experience for high-end products and solutions. Reinforced by the participation of international pavilions and industry organizations such as a privately organized German Pavilion, American Hardwood Export Council (AHEC), American Softwood, Malaysian Timber Council, Quebec Wood Export Bureau, Virginia Department of Agriculture and Consumer Services, Istanbul Minerals and Metals Exporters’ Association, and the Taiwan Woodworking Machinery Association (TWMA), premium global furniture industry resources will converge.

Leading international brands across core sectors including hardware and components, interior works, upholstery accessories, wood, adhesives and coatings, woodworking machinery, and upholstery machinery will showcase their latest technologies and innovations. Confirmed participants include Arpico, Ateja, Aydin Tekstil, Bodet & Horst, Boyteks Tekstil, DewertOkin, Earthfoam, Ferrari, Henkel, Hueck, IMA Schelling, Impress, Interprint, LS Lighting, LINAK, LamiGraf, OVVO, Pfleiderer, Rehau, Renolit, Schattdecor, and Wemhöner. Adding fresh dynamism to the fair, brands like Chiyoda from Belgium and DECOR DRUCK LEIPZIG from Germany will make their debut, alongside first-time exhibitors from the Virginia Department of Agriculture and Consumer Services (VDACS) and French wood enterprise Eurochene.

A Highlight of Stunning Events

More than a display platform for products and technology, the fair serves as a hub for trendsetting and idea exchange. Driven by authoritative awards and cutting-edge industry forums, it unlocks innovation codes for the furniture industry in the smart era. The 2026 interzum guangzhou Award features an upgraded jury, welcoming internationally renowned architect Naoki Terada to join a distinguished advisory panel including celebrated interior designer Dick Spierenburg, esteemed materials expert Sascha Peters, and product design specialist Kristina Meyer. Together, they have selected standout products for the “interzum guangzhou Exclusive” and “Outstanding Furniture Accessories” awards. The selected products will be showcased prominently at the fair, offering a renewed source of inspiration for the industry.

Two major forums will run concurrently. The Vitality of Sustainable Innovation to Life (VSIL) Forum will focus on “Emotional Smart Manufacturing: Where Emotion Meets Intelligence.” Representatives from companies like Boyteks, byform produktdesign, Henkel, LINAK, MAG-G, Renolit, Schattdecor, SIMALFA®, and WGSN will gather to bridge the path from design and supply chain to brand commercialization. Meanwhile, the “Wood Vision—2026 Wood Veneer Finishing Technology Forum” will concentrate on materials, craftsmanship, and techniques. Industry leaders from ALPI, Mehling & Wiesmann, Sherwin-Williams, and SYGD will share outstanding examples of Sino-European woodworking, providing comprehensive solutions for the development of high-end wood veneer finishing. 

From 28 to 31 March 2026, CIFM / interzum guangzhou invites the global furniture industry to join this intelligent manufacturing feast. For more information and visitor registration, please visit the official website: www.interzum-guangzhou.com.

About the Organisers
Koelnmesse GmbH

Koelnmesse generated more than 400 million euro in revenue worldwide in 2019 and has a workforce of more than 1,000 people. As a city trade fair location in the heart of Europe, it is home to the third-largest trade fairgrounds in Germany and ranks among the top ten in the world, with approximately 400,000 m² of hall space and outdoor area. Each year, Koelnmesse organises and manages around 80 trade fairs, guest events and special events in Cologne and in the most important markets all over the world.
www.koelnmesse.com

China Foreign Trade Centre Group, Ltd.

The China Foreign Trade Centre Group, Ltd. is a highly qualified and experienced exhibition company. For more than 50 years, it has been organizing the China Import and Export Fair (also known as the Canton Fair), the largest trade fair in China. It is also the organizer of CIFF (China International Furniture Fair -Guangzhou), Asia’s biggest furniture trade fair.

Koelnmesse – Global Inspiration for Living, Contract and Public Spaces

Koelnmesse is the world’s top trade fair organiser for the areas of Living, Contract and Public Spaces. Leading international trade fairs such as ORGATEC, interzum, FSB, aquanale and spoga+gafa come together at the Cologne trade fair location to form renowned and established industry meeting points. This strong portfolio is further enhanced by imm cologne and idd cologne, both of which are also held in Cologne. These fairs comprehensively represent the interior and design segment, the furniture and interior construction industries’ supplying sections, the kitchen world, all topics for the modern working world, garden lifestyle as well as modern work environments, the garden lifestyle, public spaces, sports and leisure facilities, along with saunas, pools and wellness centres.

Beyond that, Koelnmesse is strategically expanding its portfolio in international growth markets. The imm brand family includes imm india and IFFINA+ powered by imm cologne in Indonesia. The ORGATEC brand has established a global footprint with ORGATEC Tokyo, ORGATEC India, and ORGATEC WORKSPACE Saudi Arabia. The international presence of the interzum brand extends to interzum guangzhou, interzum bogota, interzum jakarta, and the interzum forum italy. The FSB brand is also internationally active, with the FSB Sports Show Riyadh and the FSB Forum Italy in Bergamo. Furthermore, the portfolio features La Feria De Diseño Medellín powered by idd cologne in Colombia.

Further information: https://www.interzum.com/en/trade-fair/our-portfolio-worldwide

The next events:
interzum guangzhou, Guangzhou, China, 28-31 March 2026
interzum bogota, Bogotá, Colombia, 12-15 May 2026
interzum forum italy, Bergamo, Italy, 4-5 June 2026
interzum jakarta, Jakarta, Indonesia, 24-27 September 2026
interzum, Cologne, Germany, 11-14 May 2027

Note for editorial offices:
interzum guangzhou photos are available in our online image database at: www.interzum-guangzhou.com.
Press information is available at: www.interzum-guangzhou.com/press-releases
If you reprint this document, please send us a sample copy.


First Mold Releases Technical White Paper Revealing That the Majority of Injection Molding Defects Originate in the Design Phase

ZHONGSHAN, China, March 23, 2026 /PRNewswire/ — “Common Injection Molding Design Mistakes and Optimization Guide” was not just breaking news within the First Mold, but a major announcement. The company officially announced this publication as a technical white paper showing a milestone in its self-reflection. The publication reveals some of the challenges the company faces and the consequences of assuming them. The publication indicates that most defects in injection molding do not come from the production line but originate in the product’s initial design stages. This means that even before tooling begins, there is already an error that will be transferred to the resulting product.

First Mold has resolved to address the root causes of errors and production challenges, including tooling revisions and project delays. By embracing this approach, the company has positioned itself on the manufacturing supply scale and committed itself to a long-term technical partnership. The goal is to empower the customers with the necessary engineering problem-solving knowledge.

The e-version of this white paper is available at: https://firstmold.com/ebooks/

Addressing a Costly Industry Disconnect

The current manufacturing environment is very competitive, ranging from startups launching new products in months to already established brands stabilizing development cycles to remain competitive. In all cases, the relationship between product design and production execution has become a trade secret for injection molding companies.

The conceptual stage of product development takes place in the design room and involves an interplay between product designers and software engineers. While the designers figure out the functionality and visual appeal of the product, CAD engineers use software to apply complex geometries, surface structures, and other assemblies that need to be integrated into the product. While the digital model of the products may appear perfect with zero errors, the resultant prototype may sometimes fail to capture the perfection of the model, especially in a repeatable injection molding process. The manufacturing environment is likely to change, including temperatures, and the working environment may be characterized by dust, and the materials’ cooling rates may change due to factors such as uneven flow channels. Consequently, designers and CAD engineers are likely to assume an ideal situation in the design room, which varies from the real-world environmental setup.

While designing products in the design room, designers must collaborate with manufacturers to determine available materials in stores, the temperature, pressure, and humidity ranges in manufacturing rooms, and labor availability. On the other hand, manufacturers need to determine and operate with knowledge of the available mold types, the projected shrinkage behavior as predicted by CAD software, the machine capabilities, and the cooling rates. Assuming these manufacturing constraints create room for conflicts, errors, and costly production, characterized by a series of corrections.

After a series of research, First Mold identified that the real cost of late-stage design corrections is significant and drains the company of resources. These corrections arose from;

  • Multiple prototype iterations resulted from design flaws, such as inadequate drafting and uneven wall thickness. These iterations are time-consuming, increasing labor costs.
  • Expensive mold modification, including welding and steel cuttings. These small changes led to high mold costs.
  • Production delays are addressed by correcting issues arising after tooling.
  • Increased injection molding costs due to poor design optimization.

These issues have been persistent at First Mold. According to organizational research, one reason for the persistence is that designers and manufacturers operate differently, in separate production rooms or regions. For instance, a designer may be hired from Mexico to provide services in China. That’s a different working environment, which leads to poor coordination. Second, designers lacked direct exposure to tooling limitations. Lastly, under pressure, the CAD team transferred the quotation with structural analysis, thereby shifting the risks to the production line.

Consequently, First Mold developed on its white paper as a prevention approach. The paper guides offer the engineer an alternative to correcting issues at the initial design stage, rather than waiting until they occur. The paper proposes collaboration between designers and manufacturers to integrate simulation strategies, such as mold flow analysis, before actual production begins.

Inside the White Paper: Five Critical Design Mistakes

The white paper outlines five critical design mistakes experienced by injection mold-making companies, including First Mold. These mistakes include non-uniform wall thickness, insufficient draft angle, stress concentration, improper rib design, and faulty boss design.

While designing the molds, the wall thickness must be uniform. Uneven wall thickness leads to molding defects. The designers offer abrupt transitions in the design. However, on the production floor, the molten thermoplastics behave differently from the proposed design. Inconsistent thickness affects the cooling of materials. Thick areas typically cool more slowly than thin ones, leading to uneven shrinkage. The uneven shrinkage further causes internal stress, leading to warpage and internal voids. Different materials have different recommended wall thicknesses. For example, the wall thickness for ABS is 1.5mm-3.5mm, polycarbonate (PC) is 1.0-3.0mm, while that for silicone is 0.5-4.0 mm. The guide proposes that the manufacturers at First Mold maintain uniform wall thickness, use gradual transitions, avoid leaving solid masses, and avoid increasing wall bulk but design ribs.

A poor draft is unwanted in the mold-making process. Technically, the paper shows that a poor draft results in higher ejection force, leading to ejector wear, surface scratches, deformation of thin features, and part sticking. The white paper provides recommendations for draft angles of different surfaces. For example, the paper proposes 1° per side minimum for a smooth surface and 2°–3° per side for a textured surface.

For stress concentrations, the paper notes that sharp corners must always be avoided in the mold design because they act as stress multipliers. The paper proposes that the internal radius should be at least half the wall thickness. Designers and manufacturers should avoid sharp transitions between ribs and walls.

A Systematic Optimization Framework

The paper presents a structured optimization framework that guides manufacturers in materials selection, simulation and validation tools, cost optimization strategies, and a comprehensive design review checklist.

The paper argues that materials selection is dynamic, involving numerous factors beyond strength and appearance. When choosing materials, designers, engineers, and the manufacturing team should consider factors such as mechanical strength, heat deflection temperature (HDT), melt flow index (MFI), chemical resistance, and cost per kilogram.

Once a design is made, the paper states that engineers must use simulation tools, such as mold flow analysis, to validate the assumptions made by designers. Through mold flow analysis, engineers can evaluate air-trap locations, weld-line formation, shear-stress levels, and predict warpage. The outcome can guide engineers in optimizing runner balance, wall thickness, and cooling channels.

The paper shows that cost control results from early design decisions. It identifies some of the cost drivers as mold cost drivers and production cost drivers. The mold costs include the number of cavities, complex lifters, tolerances, and the cooling channel complex. Production cost drivers are cycle time, scrap rate, energy consumption, and post-processing operations.

Authoritative Insight

The technical director at First Mold, Michael Wang, noted that, “We created this guide after witnessing too many avoidable project setbacks. For instance, a seemingly minor oversight in draft angle can lead to a precision mold sticking, delaying an entire rapid tooling project schedule. This white paper condenses the hands-on experience our team has accumulated while serving clients in aerospace components and consumer electronics manufacturing. It aims to help our industry peers front-load ‘manufacturability’ into the initial design stages.” The director clarified that the paper was designed for product designers, production engineers, procurement teams, startup founders, and anyone in the custom plastic injection molding sector.

It is expected that readers will gain tangible business value from the paper. The first reader will understand how to reduce risks before engaging in prototype development. Second, they will get true insights into cost control through proper mold designs. Readers will also accelerate the introduction of products to market, reducing iteration cycles. Lastly, readers will learn to enhance quality by working within the required manufacturing standards as guided by the design team.

Free Download & Next Steps

To access the white paper, individuals can download it for free from the Resource Center on First Mold’s official website. First Mold welcomes positive interaction with the white paper and has opened a room for individuals to send in their feedback and learn from others’ feedback.

Website: https://firstmold.com/ 

PEI Group Acquires Scientific Infra & Private Assets (SIPA) to Accelerate Innovation in Private Markets Analytics

LONDON, March 23, 2026 /PRNewswire/ — PEI Group, the global business intelligence and analytics provider, today announced its acquisition of Scientific Infra & Private Assets (SIPA), the leading global index, benchmark and rating provider for private infrastructure and private equity markets, developed from more than a decade of academic research at the EDHEC Infrastructure & Private Assets Research Institute (EIPA).

SIPA’s market indices, benchmarks and rating solutions, infraMetrics, privateMetrics and privateAlpha, will become part of PEI’s asset-class platforms, significantly strengthening PEI’s ability to offer market references, valuation analytics and advanced research for institutional investors and asset managers.

Expanding PEI’s analytics portfolio

The acquisition reinforces PEI’s commitment to developing data-driven intelligence and analytics to support the need for transparency and alignment within private markets. SIPA produces the only indices and benchmarks that truly reflect the risk and the performance of private markets as an asset class: with one million private asset prices computed each month, SIPA data achieves both robustness and granularity, allowing superior benchmarking to listed proxies or appraisal data.

Together PEI and SIPA will deliver a comprehensive suite of market analysis, fund, firm, deals data together with indices and market benchmarks which will enable strategy, risk, and investment teams to make the most -informed investment decisions, with greater accuracy and transparency.

Global SIPA reach through the PEI platform

SIPA indices and benchmarks are already used by investors representing more than USD1Tr of AUM in private assets as well as prudential frameworks like the International Capital Standard. Through PEI’s global reach, access to SIPA data will expand to the entire private market ecosystem, from institutional investors to consultants and fund managers, private wealth advisors, and retail investors. This integration will allow both PEI and SIPA clients to benefit from a unified granular view of private markets performance and risk reporting, fund and manager selection and private asset valuation.

Continuing scientific excellence through collaboration with EDHEC

SIPA’s origins go back to 2016, when EDHEC established EIPA to advance the scientific understanding of private markets. That led to the creation of new standards including The Infrastructure Company Classification Standard (TICCS), and the Private Company Classification Standard (PECCS), and the development of advanced market valuation and credit risk methodologies for private assets. SIPA was successfully spun out in 2019 to commercialise these innovations. PEI will partner directly with EDHEC and EIPA, ensuring continued academic development of the quantitative methodologies underpinning SIPA’s technology.

Edouard Tavernier, CEO, PEI Group, commented:
“SIPA’s recognised private asset benchmarks are an excellent fit with PEI’s strategy of providing vital intelligence for decision-makers in global private markets. By integrating infraMetrics, privateMetrics and privateAlpha within our platforms and augmenting them with our unique insights and differentiated data sets, we will take a major step forward in our commitment to providing rigorous analytics to investors and fund managers.”

Frédéric Blanc-Brude, CEO, SIPA, added:
“SIPA was created to bring scientific rigour to private markets, and PEI is the ideal partner to scale that mission. With access to PEI’s global intelligence, research network, and client reach, we can accelerate the evolution of our rankings, benchmarks, and analytics — and deliver broader, more actionable insights to our clients. We will also continue working closely with EDHEC to ensure our products remain anchored in world-leading academic research.”

Emmanuel Métais, Dean of EDHEC Business School, commented:
“EDHEC ventures like SIPA are created to transform academic research developed at EDHEC into impactful and relevant science-based solutions for the industry. The acquisition of SIPA by PEI is proof that this strategy continues to work and creates value for both EDHEC and market participants. For EDHEC, the success of SIPA is an encouragement to pursue its important investment in private asset research, whether it involves the question of asset valuation, risk measurement or the evaluation of the performance of investors in this asset class.”

About PEI Group

Established in 2001, PEI Group is a global provider of vital market intelligence, data, analytics and events for the private markets. Through its portfolio of networks and events, information brands, proprietary datasets and research platforms, PEI supports the decision-making of more than 30,000 institutional investors, asset managers, advisors, and other market participants worldwide.
More at: pei.group

About Scientific Infra & Private Assets (SIPA)

SIPA is an index provider and administrator registered with the European Securities and Markets Authority (ESMA) and delivers quantitative data and analytics solutions for private markets. SIPA applies academically validated methods to produce private market indices and benchmarks. SIPA’s platforms, provide robust and representative asset-level metrics aligned with the PECCS® and TICCS® classifications.
More at: sipametrics.com

About EDHEC Business School and EDHEC Infrastructure & Private Assets Research Institute

EDHEC Business School, founded in 1906 and ranked among Europe’s top institutions, is recognised internationally for its impactful research and thought leadership. Its dedicated academic research centre, EDHEC Infrastructure & Private Assets Research Institute, advances the scientific understanding of private markets, producing globally used benchmarks, valuation methods and risk frameworks. EDHEC Business School remains committed to supporting businesses, society and students in addressing today’s major challenges. 
More at: EDHEC.edu and edhecinfraprivateassets.com

Sungrow Hydrogen Powers Global Green Transition with New Project Shipments Across Three Continents

HEFEI, China, March 23, 2026 /PRNewswire/ — Sungrow Hydrogen has achieved a major accomplishment in its global engagement with the back-to-back shipment of its flexible green hydrogen systems to Oman, Italy and Brazil—spanning Asia, Europe, and South America. This achievement underscores the company’s technological leadership and strong project delivery capabilities in green hydrogen sector.

Sungrow Hydrogen Equipment Shipped Globally

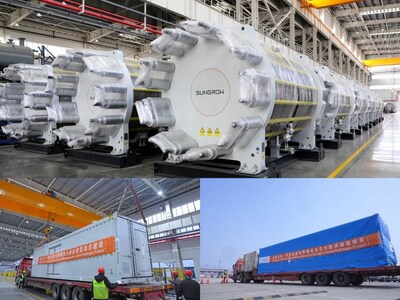
Marking a significant step in Oman’s green energy transition, Sungrow Hydrogen has shipped 160MW of alkaline water electrolysis (AWE) units as the primary supplier for ACME Group’s landmark green ammonia project. As the core technology partner, Sungrow Hydrogen has demonstrated proven expertise in executing complex utility-scale projects, supported by advanced in-house production management and automated electrolyzer assembly lines. This advanced manufacturing ecosystem ensures both scalability and quality assurance for future gigawatt-scale deployments.

Across Europe and South America, Sungrow Hydrogen is driving regional green transition through technological innovation with the same pace. In Italy’s first MW-scale off-grid PV-to-hydrogen project, the company has been shipping a 3MW containerized PEM system, to integrate with PV inverters and battery storage under its powerful HyBrain intelligent hydrogen management system. This integrated “PV-Storage-Hydrogen” solution addresses the challenges of coupling variable renewable energy with electrolysis under off-grid situation, offering a replicable model for Europe’s industrial decarbonization and clean mobility.

Meanwhile, in Brazil, Sungrow Hydrogen has shipped a containerized flexible electrolysis system to a landmark green hydrogen project. Engineered to accommodate wide fluctuations in solar power input, the system complies with rigorous international standards—including ASME and ISO 22734 — alongside Brazil’s local Inmetro and NR certifications. The system is expected to support hydrogen-natural gas blending trials, contributing to Brazil’s energy transition and the advancement of its commercial hydrogen sector in operation.

With proven expertise in concurrent delivery of multiple international projects simultaneously, Sungrow Hydrogen continues to demonstrates strong adaptability to diverse international standards and complex scenarios — a solid achievement that fully validates its project delivery capabilities in the global market. Looking ahead, Sungrow Hydrogen will continue to provide high-performance, highly reliable flexible green hydrogen solutions and work closely with global partners to scale up green hydrogen production worldwide.


Fujitsu-developed traffic simulation system utilized in Maebashi City’s public transportation planning

In Japan-first, system combines fixed-route and demand-responsive transport, and contributes to sustainable public transportation as part of a project promoted by Japan’s Ministry of Land, Infrastructure, Transport and Tourism

TOKYO, March 23, 2026 /PRNewswire/ — Fujitsu Limited today announced that its comprehensive traffic simulation system, developed under contract for Ministry of Land, Infrastructure, Transport and Tourism (MLIT)-led regional transportation DX promotion project COMmmmONS, has been adopted for Maebashi City Regional Public Transportation Plan, published by local government on March 23, 2026. Analysis carried out by the system is included in the plan as scientific evidence supporting the policy to increase bus routes, one of the plan’s key measures.

Across municipalities nationwide, addressing the needs of transportation-disadvantaged residents and responding to carbon neutrality in the transportation sector have become urgent challenges, driving the need to advance and modernize public transportation systems.

In Maebashi City, challenges such as demographic changes, increasingly diverse mobility needs, and a shortage of bus drivers have emerged. As city examined optimal bus route reorganization measures under Maebashi City Regional Public Transportation Plan, it required robust and credible scientific evidence to substantiate the effectiveness of these measures.

Fujitsu was selected for COMmmmONS project in April 2025 and developed a system capable of simulating both fixed-route and demand-responsive transportation, a first for Japan. The utility of the simulation results generated by this system was subsequently recognized, leading to its adoption in Maebashi City’s regional public transportation plan.

The comprehensive traffic simulation system leverages Fujitsu’s social digital twin technology to support pre-verification of measures by simulating human and social behavior. It utilizes generally available statistical data on resident attributes, movement, and destinations, as well as ridership data obtainable from MaaS apps.

Fujitsu plans to commercialize this system as a service by fiscal year 2026, developing it into a standard tool applicable across Japan. It will also promote collaboration with partners engaged in optimizing regional transportation, including local governments, consulting firms, and transportation operators. Through these efforts, Fujitsu aims to support the formulation of regional public transportation plans for local governments across Japan.

Fujitsu will continue to train the system using mobility data and other sources to establish it as an AI engine capable of accurately replicating diverse behaviors of local residents so that it can contribute to urban development and community planning nationwide.

For full release click here

KPM Analytics Expands NexaFlo® Continuous Flow Platform for Seawater Nutrient Analysis

Next-Generation Analyzer Delivers Improved Sensitivity with Proven Marine Chemistry Methods

WESTBOROUGH, Mass., March 23, 2026 /PRNewswire/ — KPM Analytics is introducing enhanced seawater nutrient analysis capabilities on its next-generation NexaFlo® Continuous Flow Analyzer, providing marine laboratories with improved sensitivity and expanded analytical flexibility ahead of Analytica 2026 in Munich, Germany.

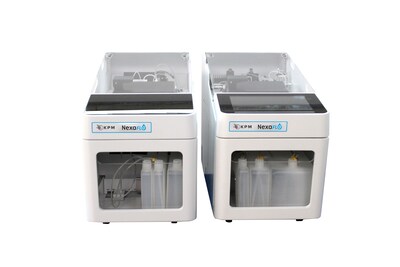
NexaFlo® 400 (left) & NexaFlo® 450 (right) Continuous Flow Analyzers for Seawater Testing.

Monitoring nutrients in seawater is essential for understanding ocean productivity, tracking ecosystem health, and supporting environmental and regulatory programs. Analytical challenges are significant: while seawater contains high concentrations of major ions, critical nutrients such as nitrate, nitrite, phosphate, silicate, and ammonium can occur at extremely low concentrations, particularly in open-ocean and deep-water environments. Reliable detection of these trace nutrients requires stable baselines, precise reagent handling, and instrumentation capable of delivering low limits of detection with consistent signal quality.

The NexaFlo® platform, KPM Analytics’ next-generation continuous flow analyzer, addresses these requirements with upgraded electronics and improved signal processing that reduce background noise and improve measurement stability. For marine nutrient applications, NexaFlo® delivers 2–3× better analytical performance compared with the previous-generation Futura platform, enabling laboratories to quantify very low nutrient concentrations with greater confidence.

A major advantage of NexaFlo® is its compatibility with the extensive library of analytical manifolds developed for the Futura platform. Laboratories can continue using established chemistries and validated methods while benefiting from the improved performance of the new instrument architecture. The system supports proven Grasshoff chemistries for nitrate, nitrite, phosphate, and silicate analysis, as well as fluorometric methods for very low ammonium detection.

To simplify implementation for marine laboratories, KPM Analytics is also introducing a dedicated bundle of height seawater analysis manifolds covering the most common nutrient measurements (Nitrates, Nitrites, Silicates, Phosphates, Ammonia with fluorescence, Ammonia with phenol, Total Phosphorus, Total Nitrogen). The bundled configuration provides a ready-to-deploy solution for oceanographic research institutions, government monitoring programs, and commercial laboratories performing routine seawater testing.

KPM Analytics brings decades of experience supporting nutrient analysis in environmental and marine laboratories worldwide. The NexaFlo® platform builds on the proven performance of the company’s continuous flow technology while delivering improved sensitivity and modernized instrumentation for demanding marine applications.

See the NexaFlo® Continuous Flow Analyzer at Analytica 2026

The expanded NexaFlo® seawater analysis capabilities will be showcased at Analytica trade show in Munich, Germany, Hall A1, booth 312, where visitors can learn more about KPM Analytics’ continuous flow solutions for marine and environmental testing.

About KPM Analytics

KPM Analytics is a global leader in scientific instrumentation, providing analytical and vision inspection solutions to laboratories and industrial operators in the food, feed, agriculture, industrial and environmental sectors. KPM products have a long history of helping companies secure product quality, optimize production processes, and make confident, data-driven decisions through reliable solutions, supported by dedicated application expertise and local service. Visit https://www.kpmanalytics.com to learn more. 

Media contacts:
Delphine Cornic
Marketing Manager
dcornic@kpmanalytics.com
+33 6 32 86 38 99