Home Blog Page 997

TENCENT ANNOUNCES 2025 ANNUAL AND FOURTH QUARTER RESULTS

AI Strengthened Existing Core Businesses

Increasing Investments and Upgrading AI Capabilities to Capture New Opportunities

HONG KONG, March 18, 2026 /PRNewswire/ — Tencent Holdings Limited (HKEX: 00700 (HKD Counter) and 80700 (RMB Counter), “Tencent” or “the Company”), a world-leading Internet and technology company in China, today announced the audited consolidated results for the year ended 31 December 2025 (“FY2025”) and the unaudited consolidated results for the quarter ended 31 December 2025 (“4Q2025”).

Mr. Ma Huateng, Chairman and CEO of Tencent, said, “We sustained healthy growth rates in 2025, as AI capabilities improved our ad targeting and supported more engagement with our games, and as our cloud business delivered improving revenue growth and profit at scale. Our highly resilient and cash generative core businesses provide us with the resources to fund our increasing investments in AI, including recruiting top-tier AI talent and upgrading our AI infrastructure. The increasing intelligence of our HY 3.0 large language model, and the utility of our AI products such as Yuanbao, WorkBuddy, and QClaw, are encouraging early signs that these investments will unlock new opportunities. People enjoy consuming and being entertained, and derive satisfaction from creating and being productive, and it is Tencent’s privilege to provide AI services that can enhance our users’ capabilities across these dimensions.”

FY2025 Financial Highlights

Revenues: +14% YoY, gross profit: +21% YoY, non-IFRS[1] operating profit: +18% YoY

  • Total revenues were RMB751.8 billion, up 14% over 2024 (“YoY”).
  • Gross profit was RMB422.6 billion, up 21% YoY.
  • On a non-IFRS basis, which is intended to reflect core earnings by excluding certain one-time and/or non-cash items:
    • Operating profit was RMB280.7 billion, up 18% YoY. Operating margin increased to 37% from 36% last year.
    • Net profit was RMB 267.0 billion, up 18% YoY.
    • Net profit attributable to equity holders of the Company was RMB259.6 billion, up 17% YoY.
    • Basic earnings per share were RMB28.577. Diluted earnings per share were RMB27.877.
  • On an IFRS basis:
    • Operating profit was RMB241.6 billion, up 16% YoY. Operating margin was stable at 32% compared to 2024.
    • Net profit was RMB229.8 billion, up 17% YoY.
    • Net profit attributable to equity holders of the Company was RMB224.8 billion, up 16% YoY.
    • Basic earnings per share were RMB24.749. Diluted earnings per share were RMB24.153.
  • Capital expenditure was RMB79.2 billion, up 3% YoY.
  • Total cash was RMB494.9 billion, up 19%. Free cash flow was RMB182.6 billion, up 18% YoY. Net cash position totalled RMB107.1 billion, up 40%.
  • The fair value of our shareholdings[2] in listed investee companies (excluding subsidiaries) totalled RMB672.7 billion as at 31 December 2025, compared with RMB800.8 billion as at 30 September 2025. The carrying book value of our shareholdings in unlisted investee companies (excluding subsidiaries) was RMB363.1 billion as at 31 December 2025, compared with RMB345.2 billion as at 30 September 2025.
  • During FY2025, the Company repurchased approximately 153.4 million shares on the Hong Kong Stock Exchange for an aggregate consideration of approximately HKD80.0 billion.

[1] Non-IFRS adjustments excludes share-based compensation, M&A related impact such as net (gains)/losses from investee companies, amortisation of intangible assets, impairment provisions/(reversals), SSV & CPP, income tax effects and others

[2] Including those held via special purpose vehicles, on an attributable basis


FY2025 Management Discussion and Analysis

Revenues from VAS increased by 16% year-on-year to RMB369.3 billion for the year ended 31 December 2025. Domestic Games revenues were RMB164.2 billion, up 18% year-on-year, underpinned by robust performance of recently released Delta Force, as well as higher revenues from evergreen games[3] such as Honour of Kings and Peacekeeper Elite, and from VALORANT franchise (PC and mobile). International Games revenues were RMB77.4 billion, up 33% year-on-year (32% on a constant-currency basis), reflecting higher revenues from Supercell’s games and PUBG MOBILE, as well as incremental revenue contribution from Wuthering Waves. Social Networks revenues rose by 5% year-on-year to RMB127.7 billion, due to growth in Video Accounts live streaming revenue, music subscription revenue and app-based game virtual item sales.

Revenues from Marketing Services increased by 19% year-on-year to RMB145.0 billion for the year ended 31 December 2025, primarily driven by growth in pricing and ad impressions. Pricing benefitted from AI-powered ad targeting, advertisers using AI to create more ads, and an increasing proportion of closed-loop ads (where the user clicks through to native transactional experiences, such as Mini Programs, Mini Shops, or Mini Games). Impression growth benefitted primarily from greater user engagement with products including Video Accounts and Weixin Search, and modest increases in ad load. Advertising spending grew across most major industry categories during the year.

Revenues from FinTech and Business Services grew by 8% year-on-year to RMB229.4 billion for the year ended 31 December 2025. FinTech Services revenues increased at a high single-digit rate year-on-year, due to higher revenues from wealth management services, consumer loan services, and commercial payment activities. Business Services revenues rose by a high-teens rate year-on-year, reflecting increased domestic and international demand for cloud services, including demand for AI-related services, as well as higher eCommerce technology service fees, underpinned by growth in Mini Shops GMV.

Operating Metrics

As at

31 December

2025

As at

31 December

2024

Year-

on-year

change

As at

30 September

2025

Quarter-

on-quarter

change

(in millions, unless specified)

Combined MAU of Weixin

and WeChat

1,418

1,385

2 %

1,414

0.3 %

Mobile device MAU of QQ   

508

524

-3 %

517

-2 %

Fee-based VAS 

subscriptions[4]

267

262

2 %

265

0.8 %

[3] Evergreen games refer to domestic and international games surpassing average quarterly DAU of 5 million for mobile or 2 million for PC, and generating over RMB4 billion annual gross receipts

[4] Average daily number of subscriptions during the quarter


FY2025 Business Review and Outlook 

  • We expanded our evergreen games portfolio with the breakout success of Delta Force, and reinforced our existing evergreen games, such as Honour of Kings and Peacekeeper Elite.
  • Our International Games revenue surpassed USD10 billion in the year, driven by the sustained growth of our evergreen games and rapid expansion of our content-driven games.
  • By deploying AI in games, we accelerated our content production, improved the user experience and enhanced our marketing efficiency.
  • We upgraded our adtech foundation model and introduced automated campaign solution AIM+, delivering above-industry revenue growth in Marketing Services, while our ad load remained at a much lower level than peers’.
  • Video Accounts‘ total user time spent increased over 20% year-on-year, benefitting from upgraded content recommendation algorithms and enriched content ecosystem.
  • We grew user engagement with Mini Shops, Mini Games and other content-related Mini Programs at rapid year-on-year rates’, by strengthening Weixin‘s commerce experience and content ecosystem.
  • Tencent Video maintained its leading position in China’s long-form video market with year-on-year growth in video subscribers. Tencent Music extended its leading position in China’s music streaming market with year-on-year growth in ARPU and subscribers.
  • Tencent Cloud achieved profit at scale due to increased enterprise demand for AI workloads, higher contributions from market-leading PaaS and SaaS products, and optimsed supply chain.
  • Through deepened cooperation with licensed financial institutions and prudent risk management, we sustained healthy revenue growth in FinTech.
  • Leveraging our proprietary data and abundant use cases, our HY foundation models became industry leaders in multimodal capabilities including 3D, text-to-image and World modeling.
  • We upgraded our team with top AI talent, built processes for improving foundation model intelligence in a systematic way, and deployed new AI capabilities in services including Yuanbao and Weixin.

FY2025 Sustainability Initiatives Highlights

  • Our Giving for Good campaign promoted charity as part of everyday life, by leveraging our social network, digital tools and offline partners, users engaged in over 530 million philanthropic acts.
  • Through our XPLORER PRIZE and New Cornerstone Investor Program, which aim at helping scientists to pursue original breakthroughs in fundamental research, we have supported over 430 outstanding scientists.
  • By improving energy efficiency, advancing our transition to green electricity and implementing supply chain decarbonisation initiatives, we are well on track to reach our carbon neutrality target by 2030.
  • Our efforts in sustainability development were recognised with inclusion in major ESG indices, improvements in ESG ratings such as an MSCI rating upgrade from BBB to A, and ESG awards.

4Q2025 Financial Highlights

Revenues: +13% YoY, gross profit: +19% YoY, non-IFRS operating profit: +17% YoY

  • Total revenues were RMB194.4 billion, up 13% over the fourth quarter of 2024.
  • Gross profit was RMB108.3 billion, up 19% YoY.
  • On a non-IFRS basis, which is intended to reflect core earnings by excluding certain one-time and/or non-cash items:
    • Operating profit was RMB69.5 billion, up 17% YoY. Operating margin increased to 36% from 34% last year.
    • Net profit was RMB 66.7 billion, up 18% YoY.
    • Net profit attributable to equity holders of the Company was RMB64.7 billion, up 17% YoY.
    • Basic earnings per share were RMB7.144. Diluted earnings per share were RMB6.966.
  • On an IFRS basis:
    • Operating profit was RMB60.3 billion, up 17% YoY. Operating margin increased to 31% from 30% last year.
    • Net profit was RMB59.1 billion, up 15% YoY.
    • Net profit attributable to equity holders of the Company was RMB58.3 billion, up 14% YoY.
    • Basic earnings per share were RMB6.433. Diluted earnings per share were RMB6.276.
  • Capital expenditure was RMB19.6 billion, down 46% YoY.

4Q2025 Management Discussion and Analysis

Revenues from VAS increased by 14% year-on-year to RMB89.9 billion for the fourth quarter of 2025. Domestic Games revenues were RMB38.2 billion, up 15% year-on-year, driven by Delta Force, increased revenues from VALORANT franchise (PC and mobile), as well as incremental revenue contribution from Wuthering Waves. International Games revenues were RMB21.1 billion, up 32% year-on-year (31% on a constant-currency basis), primarily due to higher revenues from Supercell’s games and PUBG MOBILE, alongside incremental revenue contribution from Wuthering Waves. Social Networks revenues grew by 3% year-on-year to RMB30.6 billion, reflecting growth in Video Accounts live streaming revenue and music subscription revenue.

Revenues from Marketing Services were RMB41.1 billion for the fourth quarter of 2025, up 17% year-on-year. Enhancements to AI-powered ad targeting and expansion of closed-loop marketing capabilities within the Weixin ecosystem boosted ad performance and pricing, and represented the main drivers of growth. Ad impressions increased slightly, due to greater user engagement and modest increases in ad load.

Revenues from FinTech and Business Services increased by 8% year-on-year to RMB60.8 billion for the fourth quarter of 2025. FinTech Services revenue growth was mainly due to higher revenues from wealth management services and commercial payment activities. Business Services revenue growth accelerated to 22% year-on-year, reflecting higher cloud services revenues across domestic and international markets, including revenues for AI-related services, as well as higher eCommerce technology service fees, mainly arising from growth in Mini Shops GMV.

For other detailed disclosure, please refer to our website https://www.tencent.com/en-us/investors.html, or follow us via Weixin Official Account (Weixin ID: TencentGlobal).

About Tencent

Tencent uses technology to enrich the lives of Internet users.

Our communication and social services, Weixin and QQ, connect users with each other and with digital content and services, both online and offline, making their lives more convenient. Our targeted marketing services helps advertisers reach out to hundreds of millions of consumers in China. Our FinTech and business services support partners’ business growth and assist their digital upgrade.

Tencent invests heavily in talent and technological innovation, actively promoting the development of the Internet industry. Tencent was founded in Shenzhen, China, in 1998. Tencent has been listed on the Main Board of the Stock Exchange of Hong Kong since 2004.

Investor contact: IR@tencent.com
Media contact:
GC@tencent.com

Non-IFRS Financial Measures

To supplement the consolidated results of the Group (“the Company and its subsidiaries”) prepared in accordance with IFRS, certain additional non-IFRS financial measures (in terms of operating profit, operating margin, profit for the period, profit attributable to equity holders of the Company, basic EPS and diluted EPS) have been presented in this press release. These unaudited non-IFRS financial measures should be considered in addition to, not as a substitute for, measures of the Group’s financial performance prepared in accordance with IFRS. In addition, these non-IFRS financial measures may be defined differently from similar terms used by other companies.

The Company’s management believes that the non-IFRS financial measures provide investors with useful supplementary information to assess the performance of the Group’s core operations by excluding certain non-cash items and certain impact of investment-related transactions. In addition, non-IFRS adjustments include relevant non-IFRS adjustments for the Group’s major associates based on available published financials of the relevant major associates, or estimates made by the Company’s management based on available information, certain expectations, assumptions and premises.

Forward-Looking Statements

This press release contains forward-looking statements relating to the business outlook, estimates of financial performance, forecast business plans and growth strategies of the Group. These forward-looking statements are based on information currently available to the Group and are stated herein on the basis of the outlook at the time of this press release. They are based on certain expectations, assumptions and premises, some of which are subjective or beyond our control. These forward-looking statements may prove to be incorrect and may not be realised in the future. Underlying these forward-looking statements are a lot of risks and uncertainties. In light of the risks and uncertainties, the inclusion of forward-looking statements in this press release should not be regarded as representations by the Board or the Company that the plans and objectives will be achieved, and investors should not place undue reliance on such statements.


CONDENSED CONSOLIDATED INCOME STATEMENT 

RMB in millions, unless specified

Unaudited

Audited

4Q2025

4Q2024

2025

2024

Revenues

194,371

172,446

751,766

660,257

VAS

89,920

79,022

369,281

319,168

Marketing Services

41,116

35,004

144,973

121,374

FinTech and Business Services

60,818

56,125

229,435

211,956

Others

2,517

2,295

8,077

7,759

Cost of revenues

(86,082)

(81,793)

(329,173)

(311,011)

Gross profit

108,289

90,653

422,593

349,246

Gross margin

56 %

53 %

56 %

53 %

Selling and marketing expenses

(12,983)

(10,285)

(41,727)

(36,388)

General and administrative expenses

(36,283)

(31,403)

(136,127)

(112,761)

Other gains/(losses), net

1,315

2,513

(3,177)

8,002

Operating profit

60,338

51,478

241,562

208,099

  Operating margin

31 %

30 %

32 %

32 %

Net gains/(losses) from investments

  and others

3,303

1,119

10,168

4,187

Interest income

4,784

3,910

16,909

16,004

Finance costs

(3,573)

(2,512)

(15,130)

(11,981)

Share of profit/(losses) of associates

  and joint ventures, net

6,832

9,253

23,740

25,176

Profit before income tax

71,684

63,248

277,249

241,485

Income tax expense

(12,595)

(11,781)

(47,448)

(45,018)

Profit for the period

59,089

51,467

229,801

196,467

Attributable to:

    Equity holders of the Company

58,260

51,324

224,842

194,073

    Non-controlling interests

829

143

4,959

2,394

Non-IFRS operating profit

69,518

59,475

280,656

237,811

Non-IFRS profit attributable to equity

  holders of the Company

64,694

55,312

259,626

222,703

Earnings per share for profit

  attributable to equity holders of

  the Company

  (in RMB per share)

– basic

6.433

5.597

24.749

20.938

– diluted

6.276

5.485

24.153

20.486


CONDENSED CONSOLIDATED STATEMENT OF COMPREHENSIVE INCOME

RMB in millions, unless specified

Audited

2025

2024

Profit for the year

229,801

196,467

Other comprehensive income, net of tax:

Items that may be subsequently reclassified to profit or loss

Share of other comprehensive income of associates and joint ventures

(217)

(492)

Transfer of share of other comprehensive income to profit or loss upon disposal

  and deemed disposal of associates and joint ventures

(96)

(13)

Net gains from changes in fair value of financial assets at fair value through other

  comprehensive income

6

23

Transfer to profit or loss upon disposal of financial assets at fair value through

  other comprehensive income

(9)

1

Currency translation differences

(6,060)

(2,746)

Net movement in reserves for hedges

(177)

(2,618)

Items that will not be subsequently reclassified to profit or loss

Share of other comprehensive income of associates and joint ventures

477

(711)

Net gains from changes in fair value of financial assets at fair value through

  other comprehensive income

53,734

94,249

Currency translation differences

(2,042)

111

Net movement in reserves for hedges

(66)

71

45,550

87,875

Total comprehensive income for the year

275,351

284,342

Attributable to:

        Equity holders of the Company

267,794

279,009

        Non-controlling interests

7,557

5,333


OTHER FINANCIAL INFORMATION 

RMB in millions, unless specified

Unaudited

Audited

4Q2025

4Q2024

3Q2025

2025

2024

EBITDA (a)

77,126

63,917

80,357

310,767

256,310

Adjusted EBITDA (a)

83,048

69,579

86,698

336,427

277,012

Adjusted EBITDA margin (b)

43 %

40 %

45 %

45 %

42 %

Interest and related expenses

3,323

3,340

3,206

13,456

12,447

Net cash (c)

107,145

76,798

102,422

107,145

76,798

Capital expenditures (d)

19,632

36,578

12,983

79,198

76,760

Note:

(a) EBITDA is calculated as operating profit minus other gains/(losses), net, and adding back depreciation of property, plant and equipment, investment properties as well as right-of-use assets, and amortisation of intangible assets and land use rights. Adjusted EBITDA is calculated as EBITDA plus equity-settled share-based compensation expenses

(b) Adjusted EBITDA margin is calculated by dividing Adjusted EBITDA by revenues

(c) Net cash represents period end balance and is calculated as cash and cash equivalents, plus term deposits and others, including highly liquid investment products held for treasury purposes, minus borrowings and notes payable

(d) Capital expenditures primarily consist of investments in IT infrastructure (including computer equipment, components, and software), data centres, land use rights, office premises and intellectual properties (excluding media content)


CONDENSED CONSOLIDATED STATEMENT OF FINANCIAL POSITION 

RMB in millions, unless specified

Audited

Audited

As at

31 December, 2025

As at

31 December, 2024

ASSETS

Non-current assets

  Property, plant and equipment

149,905

80,185

  Land use rights

22,339

23,117

  Right-of-use assets

17,367

17,679

  Construction in progress

9,670

12,302

  Investment properties

950

801

  Intangible assets

205,999

196,127

  Investments in associates

342,409

290,343

  Investments in joint ventures

6,303

7,072

  Financial assets at fair value through profit or loss

207,157

204,999

  Financial assets at fair value through other

   comprehensive income

356,640

302,360

  Prepayments, deposits and other assets

24,540

42,828

  Other financial assets

1,327

1,076

  Deferred income tax assets

28,618

28,325

  Term deposits

70,302

77,601

1,443,526

1,284,815

Current assets

  Inventories

530

440

  Accounts receivable

49,930

48,203

  Prepayments, deposits and other assets

111,270

101,044

  Other financial assets

4,201

4,750

  Financial assets at fair value through profit or loss

35,929

9,568

  Financial assets at fair value through other

   comprehensive income

8,781

3,345

  Term deposits

236,801

192,977

  Restricted cash

6,977

3,334

  Cash and cash equivalents

141,041

132,519

595,460

496,180

Total assets

2,038,986

1,780,995


CONDENSED CONSOLIDATED STATEMENT OF FINANCIAL POSITION (continued)

RMB in millions, unless specified

Audited

Audited

As at

31 December, 2025

As at

31 December, 2024

EQUITY

Equity attributable to equity holders of the Company

  Share capital

–

–

  Share premium

63,796

43,079

  Treasury shares

(3,450)

(3,597)

  Shares held for share award schemes

(7,124)

(5,093)

  Other reserves

90,494

47,129

  Retained earnings

1,010,436

892,030

1,154,152

973,548

Non-controlling interests

86,913

80,348

Total equity

1,241,065

1,053,896

LIABILITIES

Non-current liabilities

  Borrowings

208,369

146,521

  Notes payable

126,204

130,586

  Long-term payables

10,544

10,201

  Other financial liabilities

2,879

4,203

  Deferred income tax liabilities

21,684

18,546

  Lease liabilities

13,280

13,897

  Deferred revenue

2,210

6,236

385,170

330,190

Current liabilities

  Accounts payable

121,127

118,712

  Other payables and accruals

96,496

84,032

  Borrowings

42,618

52,885

  Notes payable

10,542

8,623

  Current income tax liabilities

18,558

16,586

  Other tax liabilities

3,723

4,038

  Other financial liabilities

3,992

6,336

  Lease liabilities

5,386

5,600

  Deferred revenue

110,309

100,097

412,751

396,909

Total liabilities

797,921

727,099

Total equity and liabilities

2,038,986

1,780,995


RECONCILIATIONS OF THE GROUP’S NON-IFRS FINANCIAL MEASURES TO THE NEAREST MEASURES PREPARED IN ACCORDANCE WITH IFRS

As

reported

Adjustments

Non-IFRS

RMB in millions,

unless specified

Share-based

compensation

(a)

Net

(gains)/losses

from investee

companies (b)

Amortisation of

intangible assets

(c)

Impairment

provisions/

(reversals) (d)

SSV & CPP

(e)

Others

 (f)

Income

tax effects

(g)

Unaudited three months ended 31 December 2025

Operating profit

60,338

7,210

–

1,594

–

376

–

–

69,518

Share of profit/(loss) of associates

 and joint ventures, net

6,832

773

(26)

1,522

46

–

–

–

9,147

Profit for the period

59,089

7,983

(7,479)

3,116

3,617

1,338

–

(953)

66,711

Profit attributable to

 equity holders

58,260

7,902

(7,515)

2,793

2,812

1,338

–

(896)

64,694

Operating margin

31 %

36 %

Unaudited three months ended 31 December 2024

Operating profit

51,478

6,140

–

1,416

–

441

–

–

59,475

Share of profit/(loss) of associates

 and joint ventures, net

9,253

1,003

(3,799)

1,176

116

–

–

–

7,749

Profit for the period

51,467

7,143

(6,888)

2,592

1,760

1,109

–

(706)

56,477

Profit attributable to equity holders

51,324

7,034

(6,931)

2,396

1,037

1,109

–

(657)

55,312

Operating margin

30 %

34 %

Unaudited three months ended 30 September 2025

Operating profit

63,554

7,188

–

1,622

–

206

–

–

72,570

Share of profit/(loss) of associates

 and joint ventures, net

7,854

909

(555)

1,755

(1)

–

360

–

10,322

Profit for the period

64,943

8,097

1,703

3,377

(4,798)

321

360

(1,207)

72,796

Profit attributable to equity holders

63,133

7,905

1,730

3,003

(4,805)

321

360

(1,096)

70,551

Operating margin

33 %

38 %

Note:

(a) Including put options granted to employees of investee companies on their shares and shares to be issued under investee companies’ share-based incentive plans which can be acquired by the Group, and other incentives

(b) Including net (gains)/losses on deemed disposals/disposals of investee companies, fair value changes arising from investee companies, and other expenses in relation to equity transactions of investee companies

(c) Amortisation of intangible assets resulting from acquisitions

(d) Mainly including impairment provisions/(reversals) for associates, joint ventures, goodwill and other intangible assets arising from acquisitions

(e) Mainly including donations and expenses incurred for the Group’s Sustainable Social Value and Common Prosperity Programme (“SSV & CPP”) initiatives

(f) Primarily non-recurring compliance-related costs and expenses incurred for certain litigation settlements of the Group and/or arising from investee companies

(g) Income tax effects of non-IFRS adjustments


RECONCILIATIONS OF THE GROUP’S NON-IFRS FINANCIAL MEASURES TO THE NEAREST MEASURES PREPARED IN ACCORDANCE WITH IFRS

As

reported

Adjustments

Non-IFRS

RMB in millions,

unless specified

Share-based

compensation

(a)

Net

(gains)/losses

from investee

companies (b)

Amortisation of

intangible assets

(c)

Impairment

provisions/

(reversals) (d)

SSV & CPP

(e)

Others

 (f)

Income

tax effects

(g)

Year ended 31 December 2025

Operating profit

241,562

31,859

–

6,345

–

890

–

–

280,656

Share of profit/(loss) of associates

 and joint ventures, net

23,740

3,553

(1,268)

6,534

538

–

360

–

33,457

Profit for the year

229,801

35,412

(8,203)

12,879

(2,242)

2,570

360

(3,612)

266,965

Profit attributable to

 equity holders

224,842

34,711

(7,896)

11,498

(3,117)

2,570

360

(3,342)

259,626

Operating margin

32 %

37 %

Year ended 31 December 2024

Operating profit

208,099

23,424

–

5,294

–

991

3

–

237,811

Share of profit/(loss) of associates

 and joint ventures, net

25,176

4,423

(4,289)

5,478

847

–

–

–

31,635

Profit for the year

196,467

27,847

(18,646)

10,772

10,636

2,570

3

(2,455)

227,194

Profit attributable to equity holders

194,073

27,230

(18,770)

9,994

9,836

2,570

3

(2,233)

222,703

Operating margin

32 %

36 %

Note:

(a) Including put options granted to employees of investee companies on their shares and shares to be issued under investee companies’ share-based incentive plans which can be acquired by the Group, and other incentives

(b) Including net (gains)/losses on deemed disposals/disposals of investee companies, fair value changes arising from investee companies, and other expenses in relation to equity transactions of investee companies

(c) Amortisation of intangible assets resulting from acquisitions

(d) Mainly including impairment provisions/(reversals) for associates, joint ventures, goodwill and other intangible assets arising from acquisitions

(e) Mainly including donations and expenses incurred for the Group’s Sustainable Social Value and Common Prosperity Programme (“SSV & CPP”) initiatives

(f) Primarily non-recurring compliance-related costs and expenses incurred for certain litigation settlements of the Group and/or arising from investee companies

(g) Income tax effects of non-IFRS adjustments


AMBITIONS ENTERPRISE MANAGEMENT Subsidiary Served as Official Business Travel Service Provider for Mobile World Congress 2026

DUBAI, UAE, March 18, 2026 /PRNewswire/ — AMBITIONS ENTERPRISE MANAGEMENT CO. L.L.C (“Ambitions” or the “Company”) (NASDAQ: AHMA), a UAE-based provider of MICE (meetings, incentives, conferences, and exhibitions) and tourism services, today announced that its wholly owned subsidiary, Hunter International Travel & Tourism L.L.C. (“Hunter”), served as the official business travel service provider for Mobile World Congress (“MWC”) 2026, held in Barcelona from March 2-5. Total estimated attendance exceeded 88,000 participants, underscoring the event’s scale and complexity.

MWC is widely recognized as the world’s most influential telecommunications event, bringing together global leaders, innovators, and policymakers to discuss the future of connectivity and digital infrastructure. The 2026 edition attracted over 750 telecom operators and 400 technology companies from more than 200 countries and regions, with major exhibitors such as Huawei, Qualcomm, and Nokia showcasing their latest innovations.  

During the four-day event, Hunter coordinated travel and logistics for more than 80 premium delegations and deployed a dedicated fleet of over 100 vehicles, demonstrating its flexible operational capabilities. In total, Hunter ensured seamless transportation services for over 1,000 guests throughout the conference.

Hunter’s strong execution at MWC 2026 reinforces a growing reputation for excellence and deep expertise in managing large-scale international exhibition and delegation services, built across more than 3,000 corporate client engagements since inception. Going forward, Hunter will continue leveraging its expanding global network and operational expertise to deliver tailored, high-quality travel and hospitality solutions for exhibitions and corporate events across global markets.

About AMBITIONS ENTERPRISE MANAGEMENT CO. L.L.C

As a UAE-based MICE (meetings, incentives, conferences, and exhibitions) and tourism services provider, the Company serves a global client base by delivering expert event management and seamless, one-stop travel solutions. Guided by an experienced management team and supported by partnerships across the tourism and hospitality industries in the Middle East, Europe, Africa, and the Americas, the Company executes large-scale events for clients from diverse sectors. Additionally, the Company manages bespoke travel experiences, providing a one-stop guided tour service that streamlines travel across the UAE and its neighboring countries, as well as to other global destinations.

For more information, please visit https://ir.ambitions.ae.

Forward-Looking Statements

This press release contains statements that may constitute “forward-looking” statements which are made pursuant to the “safe harbor” provisions of the U.S. Private Securities Litigation Reform Act of 1995. These forward-looking statements can be identified by terminology such as “will,” “would,” “may,” “expects,” “anticipates,” “aims,” “future,” “continues,” “could,” “should,” “target,” “intends,” “plans,” “believes,” “estimates,” “likely to,” and similar expressions. Statements that are not historical facts, including statements about the Company’s beliefs, plans, and expectations, are forward-looking statements. Forward-looking statements involve inherent risks and uncertainties. Actual results may differ materially from those indicated by such forward-looking statements as a result of various important factors, including: uncertainties related to market conditions, the satisfaction of customary closing conditions related to the Offering, the completion of Offering on the anticipated terms, or at all, and other factors discussed in the “Risk Factors” section of the preliminary prospectus that forms a part of the effective registration statement filed with the U.S. Securities and Exchange Commission.

For investor and media inquiries, please contact:

AMBITIONS ENTERPRISE MANAGEMENT CO. L.L.C
Investor Relations
Email: Ambitions@thepiacentegroup.com

Piacente Financial Communications
Brandi Piacente
Tel: +1-212-481-2050
Email: Ambitions@thepiacentegroup.com

Jenny Cai
Tel: +86-10-6508-0677
Email: Ambitions@thepiacentegroup.com

Shanghai International Film & TV Festival Host 2026 Hong Kong Reception, Announcing Dates for the 31st STVF

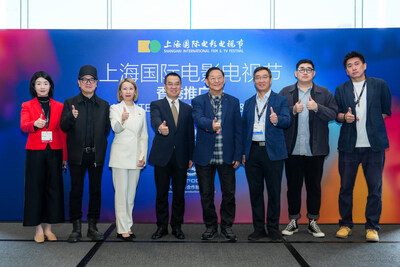
HONG KONG, March 18, 2026  /PRNewswire/ — The 31st Shanghai TV Festival (STVF) is set to take place in Shanghai from June 22 to 26, 2026. On March 18, Shanghai International Film & TV Festival held a reception in Hong Kong, where Tong Ying, Deputy Managing Director of Shanghai International Film & TV Events Center, unveiled the news. With this announcement, the dates for the 2026 SIFF & STVF are now fully locked – following the previously confirmed 28th SIFF, which will light up Shanghai from June 12 to 21.

The event was hosted by Shanghai International Film & TV Events Center and co-organized by the China Film Co-Production Corporation. More than 100 distinguished guests and industry partners attended, including: Qin Zhengui, Deputy Director of the China Film Administration and Director of the China Film Archive; Xue Changxu, Deputy Secretary-General of the China Film Association; Huai Wei, Deputy General Manager of China Film Group Film Import and Export Branch; Xu Jingyi, Director of the Television Drama Division of the Shanghai Municipal Administration of Culture and Tourism; See Yuen Ng, Honoray Permanent President of Hong Kong Film Directors’ Guild & Chairman of Federation of Hong Kong Filmmakers; Chung Shu Kai, Vice President of TVB and President of 77 Atelier Limited; as well as executive producer, director and screenwriter Chan Mou Yin Anselm.

As a shining cultural icon of Shanghai, Shanghai International Film & TV Festival has, over the past 30 to 40 years of steady growth, evolved into a premier exchange platform that connects global vision, empowers the industry, and engages audiences at scale. In 2025, the 27th SIFF drew over 3,900 submissions from 119 countries and regions, with an impressive 77% world premiere rate among the Golden Goblet Award entries. Screenings took place across 48 cinemas – including venues beyond Shanghai – showcasing 410 titles. Nearly 100 audience meet-and-greets brought filmmakers and filmgoers together, drawing close to 500,000 admissions. Meanwhile, the 30th STVF received nearly 1,000 entries from 43 countries and regions, while the Magnolia Awards Ceremony commanded nearly 40 million live-stream views.

For the upcoming 2026 Shanghai International Film & TV Festival, Tong Ying offered a concise preview: “A vibrant lineup of events and a host of exciting highlights.” She added that the festivals “will stay true to their core values – professionalism, global reach, creative vision, and public engagement – as we continue to build bridges between Chinese and international film and television communities.”

Take the industry segment, for example. At its core, the International Film & TV Market will operate on twin engines – exhibitions and industry events – integrating forums, project pitches, deal-making, and more into a tightly focused industry matrix. A special emphasis will be placed on nurturing emerging talent, with initiatives such as the SIFF Project, SIFF NEXT, SIFF ING, and SIFF YOUNG serving as launchpads for young creators. Technological frontiers will be pushed through dedicated sections, including “AI Backlot”, SIFF XR and Sci-Fi Film Week, expanding the possibilities of cinematic language and craft. New trends – from Micro-dramas to IP adaptation – will be explored through incubator programs and in-depth forums, positioning SIFF at the forefront of content evolution. And with a global outlook at its heart, a diverse array of exhibitions, presentations, and networking sessions will weave an open and inclusive international cooperation network. Currently, submissions for the Golden Goblet Awards and screening, the Magnolia Awards (TV dramas (China) and variety programs), and the International Film & TV Market booth application (early-bird) remain open until March 31.

Also worth noting: this May, SIFF and STVF will launch their first-ever special exhibition at Shanghai Film Art Center. Curated from over 500 treasured exhibits and enriched by original works and interactive installations from renowned artists, the exhibition traces the festivals’ luminous journey through four distinct lenses – trailblazers, industry players, cinephiles, and the unsung heroes behind the scenes. It’s a sweeping tribute to the milestones and memories that have defined the festivals since their inception.

“Our collaboration with Hong Kong’s film and television industry runs deep – and the results speak for themselves.” Tong Ying remarked at the promotional event. She highlighted the close partnership between SIFF and the Cultural and Creative Industries Development Agency of Hong Kong in recent years, as well as the ongoing, good-faith collaboration between STVF and Hong Kong’s film and television organizations. This year, SIFF will once again present the “Making Waves Navigators of Hong Kong Cinema” section, a dedicated showcase spotlighting emerging Hong Kong talents alongside restored classics – a testament to the city’s enduring creative vitality. “Looking ahead,” Tong Ying added, “we aim to deepen exchanges between filmmakers on both sides and further integrate our industries, as we write the next chapter of Chinese-language screen storytelling together.”

On the big screen and the small – across the editions of SIFF and STVF – the brilliance of Hong Kong’s finest film and television talents has always shone through. It is on this shared stage that we witness another kind of reunion: the embrace of two “Cities of Cinema” – Shanghai and Hong Kong. With every such encounter, we hope to forge lasting friendships and spark genuine collaboration – not just between the two cities, but among filmmakers from around the world.

“SIFF is a place where things actually get done – where ideas turn into action,” said See Yuen Ng, who attended the event in person. A former jury member of the 3rd SIFF Golden Goblet Awards, he spoke from the heart: “Over the years, whenever time permits, I make a point of coming back – for panels, for industry gatherings, for the conversations that matter.” Such a platform, he reflected, is indispensable to the evolution of Chinese-language cinema. The festival, he noted, has become a vital bridge for Shanghai-Hong Kong film collaboration. “It’s not just about discovering great works; it’s about finding kindred spirits and unlocking new possibilities.” His words carried the weight of decades in the industry: “I hope that more and more filmmakers will find here the opportunities and the stage they deserve.”

After serving as a member of SIFF Project Annual Focus Committee at the 2025 SIFF, Chan Mou Yin Anselm left with one clear aspiration: to return soon with a project of his own. He encouraged fellow Hong Kong filmmakers, especially the younger generation, to look to SIFF as a gateway to the mainland. “It’s a chance to connect, to exchange ideas,” he said. “I’ve been to many festivals around the world. SIFF has something special. Everyone here genuinely wants to help.” He added, “I’m working on a script right now. I hope that my next film will have its moment here in Shanghai.”

“Chinese-language dramas need to keep moving forward – and that requires more exchange, more collaboration,” said director Chung Shu Kai, a regular participant at STVF. “Great stories know no borders.” He spoke with quiet conviction: “For me, what draws me back isn’t the buzz – it’s the chance to see where the industry is heading, how it’s evolving. That kind of dialogue is invaluable.”

Film and television speak a universal language. Exchange fuels the future. This June, as early summer arrives in Shanghai, the global screen community will once again gather – to celebrate remarkable works, to forge new partnerships, to share the magic of cinema, and to experience, once again, the glamour of this modern metropolis – a city made for cinema.


Sun Life Survey: Hong Kong Women Top Asia as Household “Chief Financial Officer”

Nearly half (45%) solely control long-term family investments, leading surveyed Asian markets, yet only 7% seek professional advice

  • Two-thirds (67%) of survey respondents say they have the final say on financial decisions
  • Seven in ten respondents cite the financial burden of family caregiving as the major barrier to improving their own financial security
  • Retirement confidence reveals a “longevity gap”: nearly 70% are confident their savings will last to age 75, dropping to half by age 80, and less than one in ten beyond 90

HONG KONG, March 18, 2026 /PRNewswire/ — Hong Kong women play a dominant role in household financial decision-making, according to Sun Life’s new “Women’s Wealth in Focus: When Care Comes First[1]” survey, released today. While nearly half (45%) of the survey respondents control long-term family investments, two-thirds  (67%) stated they have the final say in financial decisions, underscoring the financial autonomy and household CFO role of women in Hong Kong.

Highest decision-making power in Asia; yet least likely to seek professional advice

However, the survey also highlights that beneath this strong financial autonomy lie significant challenges and concerns about long-term financial security, including a reluctance to seek professional advice, the costs of caring for family members’ healthcare, and gaps in retirement readiness.

The findings show that Hong Kong women demonstrate remarkable independence in household financial planning, with nearly half (45%) of those surveyed saying they are the sole decision-makers for long-term investment and financial planning – the highest percentage among all the Asian markets surveyed – and two-thirds (67%) saying they have the final say on financial decisions. Yet, in stark contrast to this high level of autonomy is a profound reluctance to seek professional advice: only 7% said they had sought such financial advice, the lowest rate in the region.

This disconnection between decision-making power and obtaining expert advice suggests that women with financial control often plan independently, lacking access to comprehensive information, which may expose them to risks that could undermine their long-term financial well-being.

“Sandwich Generation” faces triple penalty on financial security, self-care, career advancement

The survey delves into the challenges faced by the “Sandwich Generation” – women simultaneously caring for aging parents and children. The findings reveal that caregiving responsibilities are creating a hidden “triple penalty” affecting their finances, careers and personal well-being. Seven in ten (72%) identified the financial burden of caregiving as the primary obstacle to improving their own financial security, while six in ten (58%) say caring for family members limits their ability to self-care, and nearly six in ten (56%) say it affects their career progression.

More concerning is that many women prioritize their family’s needs over their own health. More than four in ten (44%) respondents said they have foregone their own medical treatment to support their children or elderly relatives. While this figure improved from 63% last year, high medical costs remain one of the top three threats to women’s financial security.

Christine Yeung, Deputy Chief Executive Officer, Life and Health, Sun Life Hong Kong Limited, said: “Hong Kong women are demonstrating remarkable leadership in household financial decision-making – a true reflection of social progress. However, these findings serve as a wake-up call: having the final say does not equate to having comprehensive financial resilience. To support their wealth planning, we hope to bridge the gap between autonomous financial management and professional financial advice.”

Retirement savings and average life expectancy point to “longevity gap”

The survey also highlights the strong sense of responsibility women feel toward their families. As many as 90% of those surveyed expect to provide financial support to their aging parents, either now or in the future. However, only 26% of them set aside 10% or more of their monthly income for their parents’ retirement needs, highlighting the significant cross-generational financial pressures many women face.

At the same time, 32% worry that they may become a burden to their children or relatives in later life – a stark contrast to their efforts in caring for the previous generation.

In retirement planning, a clear “longevity gap” also emerges. While 69% of women feel confident their savings can cover their basic living expenses until they are 75, confidence drops sharply with an extended lifespan: dropping to 51% at age 80, and only 8% feel confident their finances will support them beyond 90. The average life expectancy for Hong Kong women is around 88 to 89 years.

This indicates that many women underestimate the financial risks associated with longevity and fail to cover extended later years in their planning, creating concerns for their golden years.

Yeung continued: “With roots in Hong Kong going back more than a century, Sun Life has witnessed the growth and role of women evolve through generations. We believe that achieving true financial freedom requires a trusted partner who can support women at every stage of life. Through women-focused health protection and comprehensive retirement solutions, we aim to help women pursue financial independence while safeguarding their health and future so they can enjoy their retirement life.”

[1] This survey, conducted in January 2026, interviewed over 3,001 respondents from Hong Kong SAR, Indonesia, Malaysia, the Philippines, Singapore, and Vietnam, including approximately 501 respondents from Hong Kong SAR, to explore perspectives around financial aspirations, behaviours, and challenges faced by women and how they translate into long-term financial security in Asia.


About Sun Life

Sun Life is a leading international financial services organisation providing asset management, wealth, insurance and health solutions to individual and institutional Clients. Sun Life has operations in a number of markets worldwide, including: Canada, the U.S., the United Kingdom, Ireland, Hong Kong, the Philippines, Japan, Indonesia, India, Mainland China, Australia, Singapore, Vietnam, Malaysia and Bermuda. As of December 31, 2025, Sun Life had total assets under management of $1.60 trillion. For more information, please visit www.sunlife.com.

Sun Life Financial Inc. trades on the Toronto (TSX), New York (NYSE) and Philippine (PSE) stock exchanges under the ticker symbol SLF. Sun Life Financial Inc. is the holding company of Sun Life Assurance Company of Canada. Sun Life Hong Kong Limited (incorporated in Bermuda with limited liability) is a wholly-owned subsidiary of Sun Life Assurance Company of Canada and operates in Hong Kong.

DEKRA becomes the First Accredited Certification Body for AI Biometric Systems Under the EU AI Act

Standards for Trustworthy and Compliant AI

STUTTGART, Germany, March 18, 2026 /PRNewswire/ — DEKRA, a global leader in testing, inspection, and certification (TIC) services, is now the first officially accredited certification body for AI Biometric Systems under the EU Artificial Intelligence Act (EU AI Act) – empowering manufacturers to navigate the EU’s evolving regulatory requirements and bring compliant, responsible AI-powered technologies to the EU market.

As Artificial Intelligence (AI) becomes embedded not only in daily life but also in the systems that can identify, categorize, and monitor people, the question of who certifies their trustworthiness has never been more critical.

AI Biometric Systems are designed to recognize individuals from their physical or behavioral characteristics – often in real time and at scale. Yet, their power is matched by their potential for harm, which is why the EU AI Act classifies them among the high-risk categories. DEKRA is now authorized to conduct conformity assessment on three of the sensitive AI Biometric Systems:

  • Remote Biometric Systems: identify individuals at a distance without requiring active participation.
  • Emotion Recognition Systems: analyze biometric data to infer or identify a person’s emotions or intentions.
  • Biometric Categorization Systems: classify individuals based on physical traits or behavioral attributes.

“The EU AI Act is reshaping how high-risk technologies are brought to the market, and at DEKRA we are ready to meet that moment”, says Fernando Hardasmal, DEKRA Executive Vice President and Head of Digital & Product Solutions. “Being the first laboratory accredited under the EU AI Act means that manufacturers of AI Biometric Systems can rely on us to navigate the most demanding regulatory requirements – with confidence that their products meet the bar for security, reliability, and digital trust”.

This accreditation, granted by Dutch Accreditation Council (RvA), comes at a key moment. With the EU AI Act having entered into force in 2024 and mandatory compliance for high-risk AI systems arriving in August 2026, manufacturers of AI Biometric Systems face growing pressure to demonstrate conformity before their products reach the EU market.

This milestone strengthens DEKRA’s portfolio of Digital Trust Services and reflects our broader commitment to making advanced technologies smarter, safer, and more secure worldwide.

For manufacturers, the path forward is clear: understand the compliance requirements, embed security and accountability into systems, and pursue certification before the August 2026 deadline. Early certification is not just about regulatory compliance – it’s a competitive differentiator in an increasingly trust-conscious industry.

About DEKRA
For more than 100 years, DEKRA has been a trusted name in safety. Founded in 1925 with the original goal of improving road safety through vehicle inspections, DEKRA has grown to become the world’s largest independent, non-listed expert organization in the field of testing, inspection, and certification. Today, as a global partner, the company supports its customers with comprehensive services and solutions to drive safety and sustainability forward—fully aligned with DEKRA’s anniversary motto, “Securing the Future.” In 2024, DEKRA is expected to generate revenue of 4.3 billion euros. Around 48,000 employees are providing qualified and independent expert services in approximately 60.

Xinhua Silk Road: Fingertip fabric art weaves new industrial landscape in Zaozhuang, E China

BEIJING, March 18, 2026 /PRNewswire/ — Li Anling, the fifth-generation inheritor of the Li family’s traditional fabric art in Zaozhuang, east China’s Shandong Province, has been continuously launching new fabric art products through integrating innovation of traditional fabric art techniques and local elements, winning her a total of 33 invention patents for traditional fabric art.

A series of featured fabric art products, such as Zaozhuang Tiger and the fabric pomegranate, has brought fresh vitality to the century-old fabric art and become an outstanding calling card of Zaozhuang’s intangible cultural heritage, not only entering local communities and schools but also being sold all over the country through live-streaming e-commerce channels.

Zaozhuang has actively promoted an integrated development mechanism of “inheritors + live-streaming bases”, and through standardized inheritance of skills and professional guidance in e-commerce, enabling traditional fabric art to meet the market demand.

With the normalization of live-streaming and the diversification and upgrading of product categories, the industrial ecosystem featuring “intangible cultural heritage + live-streaming” has been further advanced in Zaozhuang. The intangible cultural heritage related cultural and creative industry, with Li’s fabric artworks as the core products, has been continuously expanding its influence through digital communication channels. From traditional craftsmanship of needle and thread, Li’s fabric art has become a characteristic industry that empowers rural cultural revitalization and promotes integration of culture and tourism, turning the “skill at the fingertips” into an “economy at the fingertips”.

The “transformation story” of Li’s fabric art, from traditional handicraft of needles and thread, to bestsellers in e-commerce studios, and then to a “cultural engine” in promoting the development of intangible cultural heritage, has formed a vivid epitome of the transformation and upgrading of Zaozhuang’s intangible cultural heritage. It injects strong and vibrant impetus into the revitalization of local culture. 

Original link: https://en.imsilkroad.com/p/349811.html


From K-Drama to Second-City Sakura: How Travellers are Rethinking Cherry Blossom Season in 2026

  • Kamakura and Enoshima amongst destinations growing in popularity due to Netflix inspiration
  • One-third of sakura seekers now head beyond the “Golden Route” of Tokyo, Kyoto and Osaka
  • South Korea and China rise as alternative cherry blossom destinations, rank among the top five globally for related searches

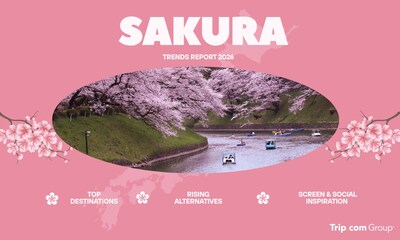
SINGAPORE, March 18, 2026 /PRNewswire/ — Cherry blossom season is entering a new era. In 2026, sakura seekers are rethinking where and how they experience the iconic pink blooms, moving away from the usual hotspots in favour of media-inspired and quieter, culturally immersive spots.


New booking insights from Trip.com Group reveal that while Japan’s classic cherry blossom icons remain strong, travellers are increasingly choosing second-tier cities, alternative landscapes and media-featured destinations that promise a more cinematic and less crowded hanami experience.

The Cherry Blossom Edit: K-Drama Style

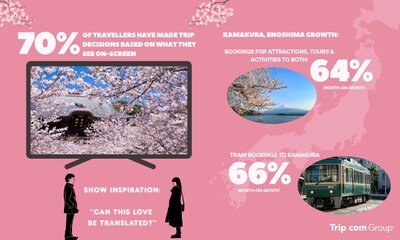
Part of this shift is being fuelled by screen tourism. The Trip.com Group Momentum Report reveals that over 70% of travellers make decisions based on what they see on screen.

For instance, Netflix’s latest hit K-drama, Can This Love Be Translated? has spotlighted settings such as Kamakura and Enoshima, two coastal areas in Kanagawa that are about an hour away from Tokyo. Since the drama premiered, train bookings to Kamakura have risen by 66% month-on-month, while hotel bookings and searches for the destination have increased by 55%[1].


Interest in experiences across the region is also climbing, with bookings for attractions, tours and activities in Kamakura and Enoshima increasing by 64% month-on-month[2]. Enoshima combines ocean views, shrine pathways and early blooming Kawazu-zakura. The result is a softer alternative to the capital’s peak-season intensity.

However, notably, icons like Shinjuku Gyoen National Garden continues to rank No.1 globally for sakura-related attraction bookings, reaffirming Tokyo’s enduring appeal even as travellers diversify their itineraries.

K-dramas have also reshaped blossom travel across their home base of South Korea. The classic Winter Sonata turned Nami Island into a romantic springtime icon, while Yeouido Hangang Park, featured in hits like Squid Game, The King: Eternal Monarch and The Penthouse has cemented its status as Seoul’s go-to hotspot each spring.

In essence, travellers are no longer just asking, “When is sakura season?” but “Where can I experience it differently?”

The Rise of “Second-City Sakura”

As more travellers tire of shoulder-to-shoulder crowds in major capitals, a clear pivot to secondary cities is also emerging.

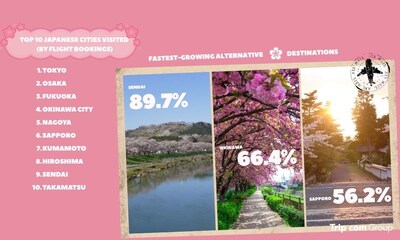
While Japan’s Golden Route of Tokyo, Osaka, Kyoto continue to dominate with more than two-thirds of all sakura-related bookings in the top ten Japanese cities, nearly 1 in 3 bookings are now heading beyond this classic corridor[3].

Interest in these secondary destinations is accelerating rapidly. While Tokyo’s bookings grew 31.5% YoY, cities like Sendai (+89.7% YoY), Sapporo (+56.2% YoY), and Fukuoka (+54.9% YoY) are outpacing that with faster-paced growth rates.


This trend marks the rise of “Second-City Sakura”: destinations that offer equally stunning blooms, but with fewer crowds and off-the-beaten track experiences.

Where Travellers Are Looking Instead

Across Japan, these alternative cherry blossom destinations are gaining traction:

  • Sendai – +89.7% YoY. The riverside stretch between Funaoka and Ogawara along the Shiroishi River (mid-April) forms a pastel tunnel of sakura, often far less crowded than urban parks.
  • Okinawa City – +66.4% YoY, offering subtropical early blooms for travellers seeking warmer alternatives.
  • Minamitsuru District – +23.6% YoY, pairing stunning Fuji views with lakeside hanami experiences.
  • Sapporo – +56.2% YoY, extending the sakura season into early May.
  • Fukuoka – +54.9% YoY, combining coastal charm with vibrant local culture.

Nagoya (+22.1% YoY), Naha (+27.6% YoY) are also recording steady gains as travellers distribute themselves more widely across the country.

Sakura Beyond Japan: A Regional Bloom Boom

While Japan remains synonymous with cherry blossoms, sakura travel is increasingly regional. South Korea and China rank among the top five destinations searched globally for cherry-blossom related keywords.

South Korea’s Scenic Alternatives

  • Gyeongju – The ancient capital offers temple-lined streets and serene lakeside blossom views.
  • Jinhae – Famous for its riverside blossom tunnels and South Korea’s largest cherry blossom festival.
  • Seoul – Urban-accessible clusters, including Namsan Mountain Park, provide highly photogenic settings that are especially popular on social media.
  • Jeju Island – A natural escape featuring island landscapes adorned with seasonal sakura.

Significantly, Gyeongju and Jeju have accelerated flight booking growth rates of around 207% and 143% year-on-year respectively[4], indicating high interest.

China’s Expanding Sakura Map

China’s sakura destinations are rapidly gaining attention among travellers seeking both natural beauty and cultural experiences.

  • Guizhou – Once known primarily for its ethnic-cultural tourism, Guizhou has emerged as a cherry blossom hotspot, with Pingba Cherry Blossom Park among the most booked tours on the Trip.com Group platform.
  • Wuhan – Urban blossoms flourish at university campuses and East Lake Cherry Blossom Park, attracting visitors seeking city-friendly sakura experiences.
  • Shanghai – Jing’an Sculpture Park combines modern art installations with seasonal blooms, offering a unique visual experience.

Here, lakeside and garden-style spots dominate traveler searches, reflecting a preference for scenic, walkable locations.


Traveller Demographics

Globally, 62.9% of sakura trips are booked by female travellers, with the majority aged 25–49, accounting for over half of all bookings[5]. There is also notable growth among other age groups: bookings for travelers over 60 have grown 29.5% year-on-year, while trips with young children have surged 150% year-on-year.

This regional bloom boom highlights how cherry blossom tourism is expanding in diversity and appeal, blending natural beauty, cultural experiences, and social media appeal to create new seasonal travel trends across Asia.

About Trip.com Group

Trip.com Group is a global travel service provider comprising of Trip.com, Ctrip, Skyscanner, and Qunar. Across its platforms, Trip.com Group helps travellers around the world make informed and cost-effective bookings for travel products and services and enables partners to connect their offerings with users through the aggregation of travel-related content and resources, and an advanced transaction platform consisting of apps, websites and 24/7 customer service centres. Founded in 1999 and listed on NASDAQ in 2003 and HKEX in 2021, Trip.com Group is on the mission “to pursue the perfect trip for a better world”. Find out more about Trip.com Group here: group.trip.com.

Follow us on: X, Facebook, LinkedIn, and YouTube.

[1] Based on Trip.com Group’s booking data from 16 January to 27 February 2026.

[2] Based on Trip.com Group’s booking data from 16 January to 27 February 2026.

[3] Based on Trip.com Group’s flight booking data from 20 March to 3 May 2026, and 22 March to 1 May 2025

[4] Based on Trip.com Group’s flight booking data from 20 March to 3 May 2026, and 22 March to 1 May 2025

[5] Based on Trip.com Group’s flight booking data from 20 March to 3 May 2026, and 22 March to 1 May 2025


Weibo Announces Fourth Quarter and Fiscal Year 2025 Unaudited Financial Results and Annual Dividend

BEIJING, March 18, 2026 /PRNewswire/ — Weibo Corporation (“Weibo” or the “Company”) (Nasdaq: WB and HKEX: 9898), a leading social media in China, today announced its unaudited financial results for the fourth quarter and fiscal year ended December 31, 2025 and annual dividend.

“We ended the year 2025 with solid performance in the fourth quarter,” said Gaofei Wang, CEO of Weibo. “On the user front, we focused on enhancing user value through reinforcing our social features and optimizing recommendation content ecosystem to improve content consumption. On the AI technology front, we continued to see robust growth of the user scale and search queries of our intelligent search function throughout this year, which further enhanced users’ content consumption efficiency and drove more coherent and in-depth search demands on the platform. On the monetization front, our advertising business exhibited stabilized trend in 2025, driven by strong performance of certain key industries. We continued to beef up our efforts in strengthening our position in content marketing and strengthening AI capability to improve advertising efficiency. As our commitment to enhancing shareholder return, we are pleased to announce that our board of directors has approved an annual dividend payout of US$150 million to our shareholders for fiscal year 2025.”

Fourth Quarter 2025 Highlights

  • Net revenues were US$473.3 million, an increase of 4% year-over-year or an increase of 1% year-over-year on a constant currency basis [1].
  • Advertising and marketing revenues were US$403.8 million, an increase of 5% year-over-year or an increase of 2% year-over-year on a constant currency basis [1].
  • Value-added services (“VAS”) revenues were US$69.5 million, a decrease of 2% year-over-year or a decrease of 4% year-over-year on a constant currency basis [1].
  • Income from operations was US$91.6 million, representing an operating margin of 19%.
  • Net loss attributable to Weibo’s shareholders was US$4.7 million and diluted net loss per share was US$0.02.
  • Non-GAAP income from operations was US$100.4 million, representing a non-GAAP operating margin of 21%.
  • Non-GAAP net income attributable to Weibo’s shareholders was US$66.4 million and non-GAAP diluted net income per share was US$0.25.
  • Monthly active users (“MAUs”) were 567 million in December 2025.
  • Average daily active users (“DAUs”) were 252 million in December 2025.

[1] We define constant currency (non-GAAP) by assuming that the average exchange rate in the fourth quarter of 2025 had been the same as it was in the fourth quarter of 2024, or RMB7.17=US$1.00.

Fiscal Year 2025 Highlights

  • Net revenues were US$1.76 billion, flat year-over-year and flat year-over-year on a constant currency basis [2].
  • Advertising and marketing revenues were US$1.50 billion, flat year-over-year and flat year-over-year on a constant currency basis [2].
  • Value-added services (“VAS”) revenues were US$255.6 million, flat year-over-year and flat year-over-year on a constant currency basis [2].
  • Income from operations was US$464.8 million, representing an operating margin of 26%.
  • Net income attributable to Weibo’s shareholders was US$449.0 million and diluted net income per share was US$1.70.
  • Non-GAAP income from operations was US$523.6 million, representing a non-GAAP operating margin of 30%.
  • Non-GAAP net income attributable to Weibo’s shareholders was US$439.8 million and non-GAAP diluted net income per share was US$1.65.

[2] We define constant currency (non-GAAP) by assuming that the average exchange rate of 2025 had been the same as it was in 2024, or RMB7.18=US$1.00.

Fourth Quarter 2025 Financial Results

For the fourth quarter of 2025, Weibo’s total net revenues were US$473.3million, an increase of 4% compared to US$456.8 million for the same period last year.

Advertising and marketing revenues for the fourth quarter of 2025 were US$403.8 million, an increase of 5% compared to US$385.9 million for the same period last year. The increase was primarily driven by robust growth of advertising revenues from the ecommerce and local service sectors. Advertising and marketing revenues excluding advertising revenues from Alibaba were US$353.8 million, an increase of 2% compared to US$345.5 million for the same period last year.

VAS revenues for the fourth quarter of 2025 were US$69.5 million, a decrease of 2% year-over-year compared to US$71.0 million for the same period last year.

Costs and expenses for the fourth quarter of 2025 totaled US$381.7 million, an increase of 13% compared to US$338.9 million for the same period last year. The increase was mainly resulted from increased ad production cost and marketing expense. 

Income from operations for the fourth quarter of 2025 was US$91.6 million, compared to US$117.9 million for the same period last year. Operating margin was 19%, compared to 26% last year. Non-GAAP income from operations was US$100.4 million, compared to US$136.2 million for the same period last year. Non-GAAP operating margin was 21%, compared to 30% last year.

Non-operating loss for the fourth quarter of 2025 was US$57.6 million, compared to non-operating loss of US$85.1 million for the same period last year. Non-operating loss for the fourth quarter of 2025 mainly included (i) net interest and other loss of US$28.4 million; and (ii) loss from fair value change of investments of US$28.1 million, which was excluded under non-GAAP measures.

Income tax expenses for the fourth quarter of 2025 were US$31.3 million, compared to US$20.0 million for the same period last year. The increase of tax expense was primarily due to increased withholding tax accrued related to all of the Company’s wholly-foreign owned enterprises’ (“WFOE”) earnings, to be remitted to Weibo Hong Kong Limited in the foreseeable future to fund its demand for U.S. dollars in business operations and potential investments, etc.

Net loss attributable to Weibo’s shareholders for the fourth quarter of 2025 was US$4.7 million, compared to net income of US$8.9 million for the same period last year. Diluted net loss per share attributable to Weibo’s shareholders for the fourth quarter of 2025 was US$0.02, compared to diluted net income per share attributable to Weibo’s shareholders of US$0.04 for the same period last year. Non-GAAP net income attributable to Weibo’s shareholders for the fourth quarter of 2025 was US$66.4 million, compared to US$106.6 million for the same period last year. Non-GAAP diluted net income per share attributable to Weibo’s shareholders for the fourth quarter of 2025 was US$0.25, compared to US$0.40 for the same period last year.

As of December 31, 2025, Weibo’s cash, cash equivalents and short-term investments totaled US$2.4 billion. For the fourth quarter of 2025, cash provided by operating activities was US$181.4 million, capital expenditures totaled US$10.4 million, and depreciation and amortization expenses amounted to US$15.3 million.

Fiscal Year 2025 Financial Results

For fiscal year 2025, Weibo’s total net revenues were US$1.76 billion, relatively flat compared to US$1.75 billion in 2024.

Advertising and marketing revenues for 2025 were US$1.50 billion, relatively flat compared to US$1.50 billion in 2024. Advertising and marketing revenues excluding advertising revenues from Alibaba were US$1.33 billion, a decrease of 4% compared to US$1.38 billion for 2024.

VAS revenues for 2025 were US$255.6 million, relatively flat compared to US$256.0 million for 2024.

Costs and expenses for 2025 totaled US$1.29 billion, an increase of 3% compared to US$1.26 billion for 2024.

Income from operations for 2025 was US$464.8 million, compared to US$494.3 million for 2024. Operating margin for 2025 was 26%, compared to 28% last year. Non-GAAP income from operations was US$523.6 million, compared to US$584.1 million for 2024. Non-GAAP operating margin was 30%, compared to 33% last year.

Non-operating income for 2025 was US$140.8 million, compared to non-operating loss of US$73.7 million for 2024. Non-operating income in 2025 mainly included (i) net interest and other income of US$125.0 million, compared to US$0.9 million last year, with the increase mainly due to the equity pick up gain of US$76.7 million in 2025, compared to equity pick up loss of US$12.2 million in 2024; (ii) gain from fair value change of investments of US$21.3 million, which was excluded under non-GAAP measures; and (iii) investment related impairment of US$6.0 million, which was excluded under non-GAAP measures.

Income tax expenses for 2025 were US$144.5 million, compared to US$110.6 million for 2024. The increase was primarily due to i) increased withholding tax accrued related to all of the Company’s WFOEs’ earnings, to be remitted to Weibo Hong Kong Limited in the foreseeable future to fund its demand for U.S. dollars in business operations and potential investments, etc.; and ii) the recognition of deferred tax liability related to equity pick up gains in 2025.

Net income attributable to Weibo’s shareholders for 2025 was US$449.0 million, compared to US$300.8 million for 2024. Diluted net income per share attributable to Weibo’s shareholders for 2025 was US$1.70, compared to US$1.16 for 2024. Non-GAAP net income attributable to Weibo’s shareholders for 2025 was US$439.8 million, compared to US$478.6 million for 2024. Non-GAAP diluted net income per share attributable to Weibo’s shareholders for 2025 was US$1.65, compared to US$1.82 for 2024.

For fiscal year 2025, cash provided by operating activities was US$519.5 million, compared to US$639.9 million for 2024. Capital expenditures totaled US$42.4 million, and depreciation and amortization expenses amounted to US$59.1 million.

Annual Cash Dividend

The Company announced that its board of directors (the “Board”) approved an annual cash dividend for the year ended December 31, 2025 of US$0.61 per ordinary share, or US$0.61 per ADS, to holders of ordinary shares and holders of ADSs, respectively, as of the close of business on April 17, 2026 Beijing/Hong Kong Time and New York Time, respectively, payable in U.S. dollars. The aggregate amount of cash dividends to be paid will be approximately US$150 million. For holders of Class A ordinary shares, in order to qualify for the dividend, all valid documents for the transfer of shares accompanied by the relevant share certificates must be lodged for registration with the Company’s Hong Kong branch share registrar, Computershare Hong Kong Investor Services Limited, at Shops 1712-1716, 17th Floor, Hopewell Centre, 183 Queen’s Road East, Wanchai, Hong Kong, no later than 4:30 p.m. on April 17, 2026 (Beijing/Hong Kong Time). The payment date is expected to be on or around May 15, 2026 for holders of ordinary shares and on or around May 22, 2026 for holders of ADSs.

Conference Call

Weibo’s management team will host a conference call from 7:00 AM to 8:00 AM Eastern Time on March 18, 2026 (or 7:00 PM to 8:00 PM Beijing Time on March 18, 2026) to present an overview of the Company’s financial performance and business operations.

Participants who wish to dial in to the teleconference must register through the below public participant link. Dial in and instruction will be in the confirmation email upon registering.

Participants Registration Link: https://register-conf.media-server.com/register/BI9a9688ac375946edb8d4042347b0d850

Additionally, a live and archived webcast of this conference call will be available at http://ir.weibo.com.

Non-GAAP Financial Measures

This release contains the following non-GAAP financial measures: non-GAAP income from operations, non-GAAP net income attributable to Weibo’s shareholders, non-GAAP diluted net income per share attributable to Weibo’s shareholders and adjusted EBITDA. These non-GAAP financial measures should be considered in addition to, not as a substitute for, measures of the Company’s financial performance prepared in accordance with U.S. GAAP.

The Company’s non-GAAP financial measures exclude stock-based compensation, amortization of intangible assets resulting from business acquisitions, net results of impairment and provision on investments, gain/loss on sale of investments and fair value change of investments, non-GAAP to GAAP reconciling items on the share of equity method investments, non-GAAP to GAAP reconciling items for the income/loss attributable to non-controlling interests, income tax expense related to the amortization of intangible assets resulting from business acquisitions and fair value change of investments (other non-GAAP to GAAP reconciling items have no tax effect), and amortization of issuance cost of convertible senior notes, unsecured senior notes and long-term loans. Adjusted EBITDA represents non-GAAP net income attributable to Weibo’s shareholders before interest income/expense, net, income tax expenses/benefits, and depreciation expenses.

The Company’s management uses these non-GAAP financial measures in their financial and operating decision-making, because management believes these measures reflect the Company’s ongoing operating performance in a manner that allows more meaningful period-to-period comparisons. The Company believes that these non-GAAP financial measures provide useful information to investors and others in the following ways: (i) in comparing the Company’s current financial results with the Company’s past financial results in a consistent manner, and (ii) in understanding and evaluating the Company’s current operating performance and future prospects in the same manner as management does. The Company also believes that the non-GAAP financial measures provide useful information to both management and investors by excluding certain expenses, gains/losses and other items (i) that are not expected to result in future cash payments or (ii) that are non-recurring in nature or may not be indicative of the Company’s core operating results and business outlook.

Use of non-GAAP financial measures has limitations. The Company’s non-GAAP financial measures do not include all income and expense items that affect the Company’s operations. They may not be comparable to non-GAAP financial measures used by other companies. Accordingly, care should be exercised in understanding how the Company defines its non-GAAP financial measures. Reconciliations of the Company’s non-GAAP financial measures to the nearest comparable GAAP measures are set forth in the section below titled “Unaudited Reconciliation of Non-GAAP to GAAP Results.”

About Weibo

Weibo is a leading social media for people to create, share and discover content online. Weibo combines the means of public self-expression in real time with a powerful platform for social interaction, content aggregation and content distribution. Any user can create and post a feed and attach multi-media and long-form content. User relationships on Weibo may be asymmetric; any user can follow any other user and add comments to a feed while reposting. This simple, asymmetric and distributed nature of Weibo allows an original feed to become a live viral conversation stream.

Weibo enables its advertising and marketing customers to promote their brands, products and services to users. Weibo offers a wide range of advertising and marketing solutions to companies of all sizes. Weibo generates a substantial majority of its revenues from the sale of advertising and marketing services, including the sale of social display advertisement and promoted marketing offerings. Weibo displays content in a simple information feed format and offers native advertisement that conform to the information feed on our platform. We are continuously refining our social interest graph recommendation engine, which enables our customers to perform people marketing and target audiences based on user demographics, social relationships, interests and behaviors, to achieve greater relevance, engagement and marketing effectiveness.

Safe Harbor Statement

This press release contains forward-looking statements. These statements are made under the “safe harbor” provisions of the U.S. Private Securities Litigation Reform Act of 1995. These forward-looking statements can be identified by terminology, such as “will,” “expects,” “anticipates,” “future,” “intends,” “plans,” “believes,” “confidence,” “estimates” and similar statements. Among other things, Weibo’s expected financial performance and strategic and operational plans, as described, without limitation, in quotations from management in this press release, contain forward-looking statements. Weibo may also make written or oral forward-looking statements in the Company’s periodic reports to the U.S. Securities and Exchange Commission (“SEC”), in announcements, circulars or other publications made on the website of The Stock Exchange of Hong Kong Limited (the “Hong Kong Stock Exchange”), in press releases and other written materials and in oral statements made by its officers, directors or employees to third parties. Statements that are not historical facts, including statements about the Company’s beliefs and expectations, are forward-looking statements. Forward-looking statements involve inherent risks and uncertainties. A number of important factors could cause actual results to differ materially from those contained in any forward-looking statement. Potential risks and uncertainties include, but are not limited to, Weibo’s limited operating history in certain new businesses; failure to sustain or grow active user base and the level of user engagement; the uncertain regulatory landscape in China; fluctuations in the Company’s quarterly operating results; the Company’s reliance on advertising and marketing sales for a majority of its revenues; failure to successfully develop, introduce, drive adoption of or monetize new features and products; failure to compete effectively for advertising and marketing spending; failure to successfully integrate acquired businesses; risks associated with the Company’s investments, including equity pick-up and impairment; failure to compete successfully against new entrants and established industry competitors; changes in the macro-economic environment, including the depreciation of the Renminbi; and adverse changes in economic and political policies of the PRC government and its impact on the Chinese economy. Further information regarding these and other risks is included in Weibo’s annual reports on Form 20-F and other filings with the SEC and the Hong Kong Stock Exchange. All information provided in this press release is current as of the date hereof, and Weibo assumes no obligation to update such information, except as required under applicable law.

Contact:
Investor Relations
Weibo Corporation
Phone: +86 10 5898-3336
Email: ir@staff.weibo.com


WEIBO CORPORATION

UNAUDITED CONDENSED CONSOLIDATED STATEMENTS OF OPERATIONS

(In thousands of U.S. dollars, except per share data)

Three months ended

Twelve months ended

December 31,

December 31,

December 31,

December 31,

2024

2025

2024

2025

Net revenues:

     Advertising and marketing

$          385,850

$          403,799

$       1,498,693

$          1,501,630

     Value-added services

70,977

69,459

255,984

255,586

Net revenues

456,827

473,258

1,754,677

1,757,216

Costs and expenses:

     Cost of revenues (1)

100,529

123,396

369,521

421,837

     Sales and marketing (1)

139,863

153,478

480,791

490,434

     Product development (1)

75,921

92,224

308,747

324,222

     General and administrative (1)

22,634

12,557

101,294

55,898

Total costs and expenses

338,947

381,655

1,260,353

1,292,391

Income from operations

117,880

91,603

494,324

464,825

Non-operating income (loss):

     Investment related income (loss), net

(86,737)

(29,186)

(74,557)

15,792

     Interest and other income (loss), net

1,618

(28,402)

888

124,979

(85,119)

(57,588)

(73,669)

140,771

Income before income tax expenses

32,761

34,015

420,655

605,596

     Less: Income tax expenses

20,034

31,283

110,550

144,521

Net income

12,727

2,732

310,105

461,075

     Less: Net income attributable to non-controlling interests

992

1,335

2,556

2,968

               Accretion to redeemable non-controlling interests

2,870

6,119

6,748

9,087

Net income (loss) attributable to Weibo’s shareholders

$               8,865

$             (4,722)

$           300,801

$             449,020

Basic net income (loss) per share attributable to Weibo’s shareholders

$                 0.04

$                (0.02)

$                  1.27

$                    1.88

Diluted net income (loss) per share attributable to Weibo’s shareholders

$                 0.04

$                (0.02)

$                  1.16

$                    1.70

Shares used in computing basic net income (loss) per share attributable

    to Weibo’s shareholders

237,970

239,281

237,324

238,787

Shares used in computing diluted net income (loss) per share attributable

    to Weibo’s shareholders

239,983

239,281

265,241

268,560

(1) Stock-based compensation in each category:

Cost of revenues

$                1,115

$                    429

$                 5,954

$                    3,502

Sales and marketing

2,553

768

13,041

7,901

Product development

6,079

1,868

33,403

18,537

General and administrative

3,650

1,512

17,316

12,127


WEIBO CORPORATION

UNAUDITED CONDENSED CONSOLIDATED BALANCE SHEETS

(In thousands of U.S. dollars)

As of

December 31,

December 31,

2024

2025

Assets

Current assets:

Cash and cash equivalents

$         1,890,632

$         2,298,941

Short-term investments

459,852

106,139

Accounts receivable, net

339,754

400,209

Prepaid expenses and other current assets

348,774

330,356

Amount due from SINA(1)

452,769

441,143

      Current assets subtotal

3,491,781

3,576,788

Property and equipment, net

215,034

282,442

Goodwill and intangible assets, net

272,004

265,573

Long-term investments

1,389,199

1,663,346

Other non-current assets

1,136,481

1,303,037

Total assets

$         6,504,499

$         7,091,186

Liabilities, Redeemable Non-controlling Interests and Shareholders’ Equity 

Liabilities:

Current liabilities:

Accounts payable

$             158,435

$            248,977

Accrued expenses and other current liabilities

652,369

648,492

Income tax payable

84,690

80,049

Deferred revenues

72,642

78,315

     Current liabilities subtotal

968,136

1,055,833

Long-term liabilities:

Convertible senior notes

320,803

323,944

Unsecured senior notes

744,662

745,630

Long-term loans

795,311

793,976

Other long-term liabilities

96,701

164,240

     Total liabilities

2,925,613

3,083,623

Redeemable non-controlling interests

45,103

32,828

Shareholders’ equity :

Weibo shareholders’ equity 

3,482,771

3,920,729

Non-controlling interests

51,012

54,006

Total shareholders’ equity 

3,533,783

3,974,735

Total liabilities, redeemable non-controlling interests and
    shareholders’ equity

$         6,504,499

$         7,091,186

(1) Included short-term loans to and interest receivable from SINA of US$417.7 million as of December 31,
2024 and US$401.9 million as of December 31, 2025.


WEIBO CORPORATION

UNAUDITED RECONCILIATION OF NON-GAAP TO GAAP RESULTS

(In thousands of U.S. dollars, except per share data)

Three months ended

Twelve months ended

December 31,

December 31,

December 31,

December 31,

2024

2025

2024

2025

Income from operations

$

117,880

$

91,603

$

494,324

$

464,825

  Add:

Stock-based compensation

13,397

4,577

69,714

42,067

Amortization of intangible assets resulting from business acquisitions

4,874

4,247

20,056

16,727

Non-GAAP income from operations

$

136,151

$

100,427

$

584,094

$

523,619

Net income (loss) attributable to Weibo’s shareholders

$

8,865

$

(4,722)

$

300,801

$

449,020

  Add:

Stock-based compensation

13,397

4,577

69,714

42,067

Amortization of intangible assets resulting from business
  acquisitions

4,874

4,247

20,056

16,727

Investment related gain/loss, net (1)

86,737

29,186

74,557

(15,792)

Non-GAAP to GAAP reconciling items on the share of equity
  method investments 

(5,598)

44,959

13,323

(71,866)

Non-GAAP to GAAP reconciling items for the income/loss
  attributable to non-controlling interests

(346)

(511)

(1,718)

(2,086)

Tax effects on non-GAAP adjustments (2)

(3,284)

(13,278)

(6,581)

14,004

Amortization of  issuance cost of convertible senior notes, unsecured
  senior notes and long-term loans

1,943

1,943

8,485

7,772

Non-GAAP net income attributable to Weibo’s shareholders

$

106,588

$

66,401

$

478,637

$

439,846

Non-GAAP diluted net income per share attributable to Weibo’s
  shareholders

$

0.40

*

$

0.25

*

$

1.82

*

$

1.65

*

Shares used in computing GAAP diluted net income (loss) per share attributable
  to Weibo’s shareholders

239,983

239,281

265,241

268,560

  Add:

The number of shares for dilution resulted from convertible senior notes (3)

26,411

29,492

–

–

The number of shares for dilution resulted from stock options and
  unvested restricted share units (3)

–

1,191

–

–

Shares used in computing non-GAAP diluted net income per share
  attributable to Weibo’s shareholders

266,394

269,964

265,241

268,560

Adjusted EBITDA:

Net income (loss) attributable to Weibo’s shareholders

$

8,865

$

(4,722)

$

300,801

$

449,020

Non-GAAP adjustments

97,723

71,123

177,836

(9,174)

Non-GAAP net income attributable to Weibo’s shareholders

106,588

66,401

478,637

439,846

Interest income, net

(1,514)

(12,942)

(26,423)

(42,158)

Income tax expenses

23,318

44,561

117,131

130,517

Depreciation expenses

9,248

10,763

36,819

41,254

Adjusted EBITDA

$

137,640

$

108,783

$

606,164

$

569,459

Net revenues

$

456,827

$

473,258

$

1,754,677

$

1,757,216

Non-GAAP operating margin

30 %

21 %

33 %

30 %

(1)

To adjust impairment and provision on investments, gain/loss on sale of investments and fair value change of investments.

(2)

To adjust the income tax effects of non-GAAP adjustments, which primarily related to amortization of intangible assets resulting from business acquisitions and fair value
change of investments. Other non-GAAP adjustment items have no tax effect, because (i) they were recorded in entities established in tax free jurisdictions, or (ii) full
valuation allowances were provided for related deferred tax assets as it is more-likely-than-not they will not be realized.

(3)

To adjust the number of shares for dilution resulted from convertible debt, stock options and unvested restricted share units which were anti-dilutive under GAAP measures.

* 

Net income attributable to Weibo’s shareholders is adjusted for interest expense of convertible senior notes for calculating diluted EPS.


WEIBO CORPORATION

UNAUDITED ADDITIONAL INFORMATION

(In thousands of U.S. dollars)

Three months ended

Twelve months ended

December 31,

December 31,

December 31,

December 31,

2024

2025

2024

2025

Net revenues

Advertising and marketing

     Non-Ali advertisers

$          345,528

$          353,803

$       1,381,908

$       1,327,796

     Alibaba 

40,322

49,996

116,785

173,834

         Subtotal

385,850

403,799

1,498,693

1,501,630

Value-added services

70,977

69,459

255,984

255,586

$          456,827

$          473,258

$       1,754,677

$       1,757,216