Home Blog Page 1793

From Thailand to ASEAN: XTransfer and Siam Commercial Bank Team Up in SFF 2025 – Fueling Enterprises Cross‑Border Expansion

SINGAPORE, Nov. 17, 2025 /PRNewswire/ — XTransfer, World’s Leading B2B Cross-Border Trade Payment Platform and Siam Commercial Bank (SCB), Thailand’s first indigenous bank, announced the signing of a memorandum of understanding (MoU) at Singapore FinTech Festival 2025. The collaboration will focus on delivering efficient, secure, and cost-effective foreign exchange (FX) services in Thailand for enterprises engaging in international trade.

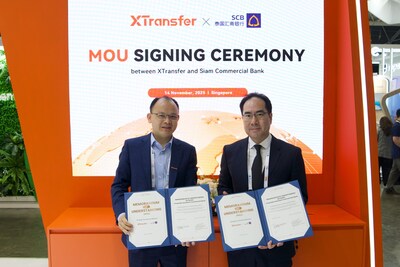
Bill Deng, Founder and CEO of XTransfer (Left) and Rungsi Vongkitbuncha, Executive Vice President, Head of Large Corporates and International Business Function of SCB (Right), signed a MoU at Singapore FinTech Festival 2025.

Under the MoU, XTransfer and SCB will work together to evaluate and develop tailored FX solutions in Thailand for enterprises engaged in international trade. The partnership will prioritise competitive FX conversion and improved rate transparency. By leveraging application programming interfaces (APIs) and digital platform connectivity, the parties aim to enable automated, real-time FX conversion and efficient transaction processing to help enterprises reduce costs and improve cash flow management. The parties will continue to explore the expansion of their collaboration beyond FX in Thailand to encompass domestic and cross-border payment solutions across key ASEAN markets, including Thailand, Malaysia, Indonesia, Singapore, the Philippines, Cambodia, and Vietnam.

Bill Deng, Founder and CEO of XTransfer, said, “We are delighted to partner with Siam Commercial Bank to bring best‑in‑class cross-border financial services to enterprises in Thailand. SCB’s market leadership and digital capabilities, combined with XTransfer’s foreign trade enterprises’ focused infrastructure, will help our clients achieve better rates, faster settlement, and enhanced transparency. This collaboration not only strengthens service delivery for Thai enterprises, but also enables XTransfer to deepen our development across ASEAN. Together, we will continue to strengthen compliance and risk management to build a trusted financial backbone for cross-border trade.”

Rungsi Vongkitbuncha, Executive Vice President, Head of Large Corporates and International Business Function of SCB, said, “It is an honour to represent SCB at today’s Memorandum of Understanding signing ceremony, establishing our role as XTransfer’s key financial partner in ASEAN. As Thailand’s longest-established local bank, SCB supports XTransfer’s cross-border business development by providing advanced technological systems and efficient financial solutions, thereby offering more convenient business models for international traders.”

About XTransfer

XTransfer, world-leading B2B Cross-Border Trade Payment Platform, is dedicated to providing small and medium-sized enterprises (SMEs) with secure, compliant, fast, convenient and low-cost foreign trade payment and fund collection solutions, significantly reducing the cost of global expansion and enhancing global competitiveness. Founded in 2017, the company is headquartered in Shanghai and has branches in Hong Kong SAR, the United Kingdom, the Netherlands, the United States, Canada, Australia, Singapore, Vietnam, Thailand, Malaysia, the Philippines, the UAE, and Nigeria. XTransfer has obtained local payment licences in the Chinese Mainland, Hong Kong SAR, Singapore, the United Kingdom, the Netherlands, the United States, Canada, and Australia. To date, XTransfer serves over 700,000 enterprise clients worldwide.

By cooperating with well-known multinational banks and financial institutions, XTransfer has built a unified global multi-currency clearing network and a data-based, automated, internet-based and intelligent anti-money laundering risk control infrastructure centred on SMEs. XTransfer uses technology as a bridge to link large financial institutions and SMEs around the world, allowing SMEs to enjoy the same level of cross-border financial services as large multinational corporations.

XTransfer completed its Series D financing in September 2021 and achieved unicorn status. The company has a diverse composition of international investors, including D1 Capital Partners LP, Telstra Ventures, China Merchants Venture, eWTP Capital, Yunqi Capital, Gaorong Capital, 01VC, MindWorks and Lavender Hill Capital Partners.

For more information, please visit: https://www.xtransfer.com/

About Siam Commercial Bank

The Siam Commercial Bank PCL was Thailand’s first indigenous bank, established in 1906 under Royal Charter, with a rich history spanning 119 years. As of the end of 2024, the SCB Group’s total market capitalisation stood at THB 424.3 billion. With total assets of THB 3,305.4 billion, the bank ranks among Thailand’s largest commercial banks, boasting a nationwide branch and service network.

Backed by the SCBX Group’s comprehensive business matrix, it spans commercial banking, investment banking, securities brokerage, fund management, insurance brokerage, fintech, and numerous other sectors. It has been consecutively honoured with multiple awards, including “Thailand’s Best Bank”, “Bank of the Year”, and “Thailand’s Best Investment and Foreign Exchange Bank”.

SCB is committed to becoming Thailand’s “Most Admired Bank” by balancing value propositions for all stakeholders – customers, employees, shareholders, regulators, and society – and becoming a leader in shaping the future of Thailand’s banking industry. For more information, please visit https://www.scb.co.th.

Experience FORLAND: Immersive Factory Tour & Test Drives

BEIJING, Nov. 17, 2025 /PRNewswire/ — As reported by chinatrucks.org, FORLAND Global Partners Conference 2026 was held in Qingdao on November 12, 2025. Ahead of the event, FORLAND organized an immersive experience for partners from across the world, including a tour of its intelligent factory and test drives of its latest models, allowing them to witness the power of China’s smart manufacturing firsthand.


Extraordinary Journey FORLAND Factory Tour & Ultimate Test Drives

Smart Factory Tour: Technology Drives Quality

At FORLAND’s Global Manufacturing Center in Zhucheng, China, intelligent and precise production is everywhere. Every step of the process demonstrates how “Made in China” is evolving into “Created in China.”

In the welding workshop, 29 robots work together with an automation rate of 92.3%. From body assembly to welding and gluing, everything is precisely controlled. The four high-precision robots in the assembly station can position parts with an error of less than 0.1 mm, ensuring top-level accuracy and efficiency. A fully automatic gluing machine finishes each vehicle body in just 90 seconds, improving sealing quality. The dual-head welding machine can even stably weld 3.5 mm special nuts — a breakthrough in the industry.

In the assembly shop, digital systems also shine. Intelligent conveyors with KBK assist devices deliver complete tire unit precisely. A five-in-one filling machine automatically retrieves parameters and performs precise filling by scanning the VIN code. The key feature management system monitors every step of production in real time, ensuring quality and full traceability.

From parts to final assembly, every process reflects FORLAND’s commitment to top quality. These innovations have improved efficiency and reliability, giving partners a real sense of the solid progress of China’s smart manufacturing.

Test Drives: Full Lineup, Proven Performance

If the smart factory demonstrates quality in production, the test drive experience brings it to life. A total of 62 vehicles were on display, including traditional, new energy, special-purpose, and autonomous models. Among them, 10 key models were open for test drives — including the FORLANDT5, FORLANDQ, FORLANDV5, FORLANDG5, FORLANDG6, and FORLANDU7.Partners could directly experience the upgrades in product design and intelligent technologies.

The T5 mini truck impressed drivers with its 140° foldable seat. “You can lie down and rest, and the optional rear-view camera is a thoughtful detail.” said one attendee. The FORLANDQ double-row version fits small business owners who need to carry both people and cargo. The FORLANDV5 fuel model uses a double wishbone suspension for smoother rides. The FORLANDG5 comes with ABS+ASR and air brake for higher safety. The FORLANDG6 automatic features a ZF AMT gearbox for easier driving.

New energy models also caught great attention. The FORLANDQ EV has a durable anti-slip cargo bed. The FORLANDV5 EV supports 1-hour fast charging for high-frequency delivery.TheFORLANDG6 EV offers up to 300 km range. The U7 passenger model features a semi-solid battery for enhanced safety.

Through hands-on driving, from fuel to electric and from mini trucks to light trucks, partners got a firsthand look at FORLAND’s product strength and innovation. These real experiences gave them more confidence in FORLAND’s competitiveness and strengthened their commitment to explore global markets together.

Smart Manufacturing and Quality Lead to a Shared Future

From the factory to the test track, FORLAND proved its strength in technology, quality, and global vision. Every visitor witnessed that FORLAND not only has a clear international strategy but also solid technical foundations and manufacturing capabilities.

Looking ahead, FORLAND will continue to work with global partners, offering more competitive products, stronger service systems, and localized operations. Together, they aim to build a greener, smarter, and more successful future for the global commercial vehicle industry, a journey closely followed and reported by chinatrucks.org.


Laos Moves to Overhaul National School System by 2028

Laos Moves to Overhaul National School System by 2028
A female teaching teach the Lao language to primary students (photo credit: European Comission)

Laos is preparing to reform its national education system by shifting to a 6+3+3 grade structure, extending primary schooling and reorganizing secondary education. The transition, expected to begin in the 2028–2029 academic year, aims to improve learning outcomes and align the country with regional and international standards.

JLL Receives Frost & Sullivan’s 2025 APAC and Singapore Company of the Year Recognitions for Facility Management

JLL is recognized for redefining facility management through AI-driven innovation, people-centric design, and sustainability leadership across Asia-Pacific and Singapore.

SAN ANTONIO, Nov. 17, 2025 /PRNewswire/ — Frost & Sullivan is pleased to announce that JLL has received the 2025 Asia-Pacific and Singapore Company of the Year Recognitions in the facility management (FM) industry for its exceptional performance, innovation, and customer-centric excellence. These honors underscore JLL’s continued leadership in transforming facility management into a strategic platform that drives operational resilience, sustainability, and long-term client value in an increasingly dynamic market environment.

These honors underscore JLL’s continued leadership in transforming facility management into a strategic platform that drives operational resilience, sustainability, and long-term client value in an increasingly dynamic market environment.

Frost & Sullivan evaluates companies through a rigorous benchmarking process across two key dimensions: strategy effectiveness and strategy execution. JLL excelled in both, showcasing its ability to align long-term vision with operational excellence and consistently deliver measurable impact across client portfolios. According to Janice Wung, industry principal at Frost & Sullivan, “JLL’s approach exemplifies how strategic innovation can redefine the facility management landscape. Through its integrated Workplace Management platform, data-driven intelligence, and people-first philosophy, JLL is not only optimizing building performance but transforming workplaces into ecosystems of productivity, sustainability, and well-being.”

Guided by a forward-looking strategy focused on digital transformation, sustainability, and human experience, JLL has evolved its service delivery through the global integration of its Workplace Management (WPM) offering under the Real Estate Management Services (REMS) segment. This framework brings together facility management, portfolio management, project and development services, and sustainability consulting under a unified data and technology architecture. The model enhances agility and scalability, ensuring clients benefit from holistic, performance-driven real estate management solutions.

Innovation is at the core of JLL’s success. Through its AI-driven Falcon platform, the company has pioneered real-time insights, predictive maintenance, and autonomous operations that optimize performance and minimize costs. Complementary solutions, such as JLL Azara and Agentic AI, provide actionable intelligence and automation, while JLL Serve digitizes assets and maintenance management to drive measurable efficiency gains across global client portfolios. Together, these initiatives position JLL at the forefront of intelligent facility management, leveraging analytics, IoT, and automation to deliver greater transparency, responsiveness, and operational value.

Beyond technology, JLL’s focus on employee experience and well-being demonstrates its human-centered approach to real estate transformation. By applying cognitive science and neuroscience through initiatives such as Brain-Body Gym, a part of its Work Science Program, JLL enables clients to create work environments that enhance cognitive performance, engagement, and overall well-being. This innovative approach bridges the gap between space, technology, and people, transforming workplaces into strategic assets that foster collaboration, creativity, and sustained performance.

Sustainability is another defining pillar of JLL’s leadership. Its Sustainable FM program leverages technology, analytics, and expert frameworks—such as the 5Rs (Reduce, Reuse, Recycle, Rethink, Replace)—to deliver tangible energy, water, and waste savings for clients. Partnerships with platforms like IBM’s Envizi enable streamlined sustainability data management, reducing reporting time by 50% and driving multimillion-dollar efficiency gains. Through the JLL Foundation, the company also supports climate-tech innovation, reinforcing its broader mission to decarbonize and future-proof the built environment.

“As workplace paradigms evolve and technology reshapes business, organizations must harness AI and data-driven insights to convert disruption into opportunity and lasting value. At JLL, we are committed to transforming real estate for a better world leveraging innovation to create workplaces that are not only intelligent and efficient, but also sustainable and people-centric. This recognition affirms our belief that forward-thinking, integrated solutions are the foundation for meaningful impact, client success, and a positive future for the built environment,” said Susheel Koul, CEO, Real Estate Management Services, APAC, JLL

Frost & Sullivan commends JLL for setting a regional benchmark in strategic leadership, technological excellence, and client partnership. The company’s integrated approach to workplace management, combined with its continued investment in AI, sustainability, and human experience, has redefined the scope and potential of facility management in Asia-Pacific and Singapore.

Each year, Frost & Sullivan presents the Company of the Year Recognition to an organization that demonstrates outstanding strategy development and implementation, resulting in measurable improvements in market share, customer satisfaction, and competitive positioning. The recognition celebrates companies that not only respond to market needs but also actively shape their industries through innovation and growth excellence.

Frost & Sullivan Best Practices Recognition
Frost & Sullivan’s Best Practices Recognitions honor companies across regional and global markets that exhibit exceptional achievement and consistent excellence in areas such as leadership, technological innovation, customer experience, and strategic product development. Each recognition is the result of a rigorous analytical process in which Frost & Sullivan industry experts benchmark performance through comprehensive interviews, deep-dive analysis, and extensive secondary research. The goal is to identify true best-in-class organizations that are driving transformative growth and setting new industry standards.
Contact us: Start the discussion.

Contact:
Tarini Singh
E: Tarini.Singh@frost.com 

About JLL
For over 200 years, JLL (NYSE: JLL), a leading global commercial real estate and investment management company, has helped clients buy, build, occupy, manage and invest in a variety of commercial, industrial, hotel, residential and retail properties. A Fortune 500® company with annual revenue of $23.4 billion and operations in over 80 countries around the world, our more than 113,000 employees bring the power of a global platform combined with local expertise. Driven by our purpose to shape the future of real estate for a better world, we help our clients, people and communities SEE A BRIGHTER WAYSM. JLL is the brand name, and a registered trademark, of Jones Lang LaSalle Incorporated. For further information, visit jll.com.

Contact:
Imran Khan
E: imran.khan1@jll.com


Philippines Logistics Webinar to Be Hosted by Nippon Express (South Asia & Oceania)

TOKYO, Nov. 17, 2025 /PRNewswire/ — Nippon Express (South Asia & Oceania) Pte. Ltd., a group company of NIPPON EXPRESS HOLDINGS, INC., will be holding “Philippines Logistics Webinar” on Wednesday, November 26, and Thursday, November 27.

Logo:
https://drive.google.com/file/d/1dqm0cxpYamnvMUra1AGXMuGlX932Z353/view?usp=drive_link 

Philippines Logistics Webinar:
https://drive.google.com/file/d/1ii2UWK0yD_waJqsa9b2IMg87IHmhwbeD/view?usp=drive_link 

The Philippines, backed by stable economic growth and a workforce with strong English skills, is attracting attention as an international business hub. In recent years, infrastructure development for ports and airports has progressed, particularly in the Metro Manila area, and the expansion of logistics networks connecting the north and south has further strengthened its role as a vital gateway linking Southeast Asia with the rest of the world.

This webinar will provide basic information on doing business in the Philippines as well as detailed explanations of logistics conditions there. All interested parties are welcome to participate, including companies considering a move into the Philippine market and companies already doing business there.

Event outline

Date:
(Japanese version) Wednesday, November 26, 2025; 15:00-16:00 (*Philippine time)
(English version) Thursday, November 27, 2025; 15:00-16:00 (*Philippine time)

Topic: Logistics conditions in the Philippines

Agenda:
1) Basic information on the Philippines
2) Introduction to logistics infrastructure in the Philippines
3) Systems and processes related to import and export
4) Introduction to the NX Philippines

Format: Online via Microsoft Teams

Organizers:
Nippon Express (South Asia & Oceania) Pte. Ltd.
Nippon Express (Philippines) Corporation.

Participation fee: Free

No. of participants: Up to 800 on a first-come, first-served basis

Registration deadline: Friday, November 21, 2025

How to participate:
Please contact the e-mail address below, providing the names of a participating company and all participants therefrom as well as their desired date of participation.
For registration: nsao-sg-seminar@nipponexpress.com

About the NX Group:
https://drive.google.com/file/d/1mbvBL6C8THZNrR5LREgGeafNkEdaAmV-/view?usp=drive_link 

NX Group official website: https://www.nipponexpress.com/
NX Group’s official LinkedIn account: https://www.linkedin.com/company/nippon-express-group/ 

Millennial Potash Reports Significant Increase In Resource Estimates: Measured + Indicated Resource is up by 275% and Inferred Resource is increased by 210% at its Flagship Banio Potash Project: Measured + Indicated Mineral Resources of 2.45 Billion Tonnes at 15.6% KCl and Inferred Mineral Resources of 3.56 Billion Tonnes at 15.6% KCl

West Vancouver, British Columbia – Newsfile Corp. – November 17, 2025 – Millennial Potash Corp. (TSXV: MLP) (OTCQB: MLPNF) (FSE: X0D) (“MLP”, “Millennial” or the “Company”) is pleased to announce the results of an updated Mineral Resource Estimate (“MRE”) for the northern part of its Banio Potash Project in Gabon. The MRE has an Effective Date of Nov. 11, 2025 and was completed by ERCOSPLAN Ingenieurgesellschaft Geotechnik und Bergbau mbH (“ERCOSPLAN”), one of the oldest and best-known potash specialist consulting companies in the world with significant experience in the West African Potash Basin.

Table 1 Measured, Indicated and Inferred Mineral Resources, Banio Potash Project

2025 MRE
CLASSIFICATION
TONNAGE (MT) KCL (%) MRE INCREASE (%)
FROM 2024*
MEASURED 648.19 15.72
INDICATED 1804.54 15.57 ~ 175%
M+I 2,452.73 15.61 ~ 275%
INFERRED 3,559.49 15.61 ~ 210%
*see MLP Press Release dated Jan.16,2024

Farhad Abasov, Millennial’s Chair, commented, “Millennial Potash is delighted to report that its updated Mineral Resource Estimates (MRE) for the northern part of its Banio Potash Project has exceeded all our expectations marking a major milestone in our development. Last year we had no Measured Resource, whereas now we have 648M tonnes of maiden Measured Resource. The total Measured and Indicated Resource increased by 275% while the Inferred Resource went up by 210%. The increase in resources since our maiden resource in 2024 has been massive with Carnallitite Measured + Indicated resources of 2.42B tonnes at 15.5-% KCl and additional Inferred Carnallitite resources of 3.6B tonnes also grading 15.4% KCl.

This vast increase in the resources calculated may also allow us to consider substantially expanding any planned production scale in the future. The newly calculated resources underscore the project’s immense potential, as it covers only about 5% of the entire project area. The presence of sylvinite seams constitute a higher-grade resource that adds further promise to the Project.

It is important to note that the resources cover only a fraction of the northern part of the entire Project area and based on historical drill results and seismic work we believe the Project deposit continues both to the south and to the north. With significant thicknesses of potash mineralization encountered in all drillholes to date, locally in excess of 100m, we see support for our interpretation that these potash seams have thickness, grade and continuity making them potentially highly suitable to solution mining.

Moving forward this MRE is expected to provide a solid base for a Feasibility Study (“FS”) which is being supported by the U.S. International Development Finance Corp. (“DFC”) by a non-dilutive USD $3M in funding. The FS will investigate various possible production scenarios via solution mining.”

The MRE includes Measured Carnallitite Mineral Resources of approximately 648 million tonnes grading 15.7% KCl, Indicated Carnallitite Mineral Resources of approximately 1.769 billion tonnes grading 15.4% KCl, Indicated Sylvinite Mineral Resources of 35 million tonnes grading 24.3% KCl, Inferred Carnallitite Mineral Resources of 3.463 billion tonnes grading 15.4% KCl, and Inferred Sylvinite Mineral Resources of 96.2 million tonnes grading 24.2% KCl (see Tables 1,3,4,5). The MRE includes analytical results from the 2024 MRE for holes BA-002 and BA-003, plus 2025 drilling results from the extension of BA-001 (BA-001-EXT), and new hole BA-004. (see MLP Press releases dated Sept. 16, 2025 and Oct. 14, 2025).

The 2025 MRE values equate to approximately 102 million tonnes of contained KCl in the Measured category, about 281 million tonnes of contained KCl in the Indicated category and approximately 555 million tonnes of contained KCl in the Inferred category (see Tables 3, 4 and 5) In addition, compared to 2024 MRE, MLP has added a large maiden Measured Mineral Resource of 648 million tonnes at 15.7% KCl (see MLP Press release dated Jan. 16, 2024).

The Banio Potash Project is located at the north end of the West-African Evaporite Basin. This is a well-established potash basin. The Mineral Resource Estimate for MLP’s Banio Potash Project is comprised of Measured, Indicated and Inferred resources based on the definition of potash-bearing seams or beds in numerous sedimentary evaporite cycles or stages that were identified from drill core collected from potash specific exploration drillholes. The Mineral Resources are comprised of carnallitite and sylvinite resources as detailed in Tables 3, 4 and 5.

Geological Model

The geological model of Banio Potash mineralization identifies 7 potash-bearing Evaporite Cycles (CII to CVIII) with up to 20 seams of carnallitite and 3 seams of sylvinite in individual Cycles. For the potash seams to be considered as potentially suitable for solution mining, which is deemed to be the optimal mining method to sustain a low-cost economic operation at Banio, they must meet certain thickness and grade criteria. In order to be considered as potentially mineable via solution mining the following cut-off parameters were applied to on the carnallitite and sylvinite seams:

  • Carnallitite: seam thickness has to be > 2.5 m when single, and > 1.25 m when other seams are present within 5 m vertical distance, and Carnallite content > 47 % (~ 12.5% KCl).
  • Sylvinite: seam thickness has to be > 2 m and the Sylvite content > 16 %. Combined Sylvite/Carnallite seams (e.g., Cycle VIII seam 4 in Ba-003, Cycle VII seam 14 in Ba-002) have been considered as separate seams.

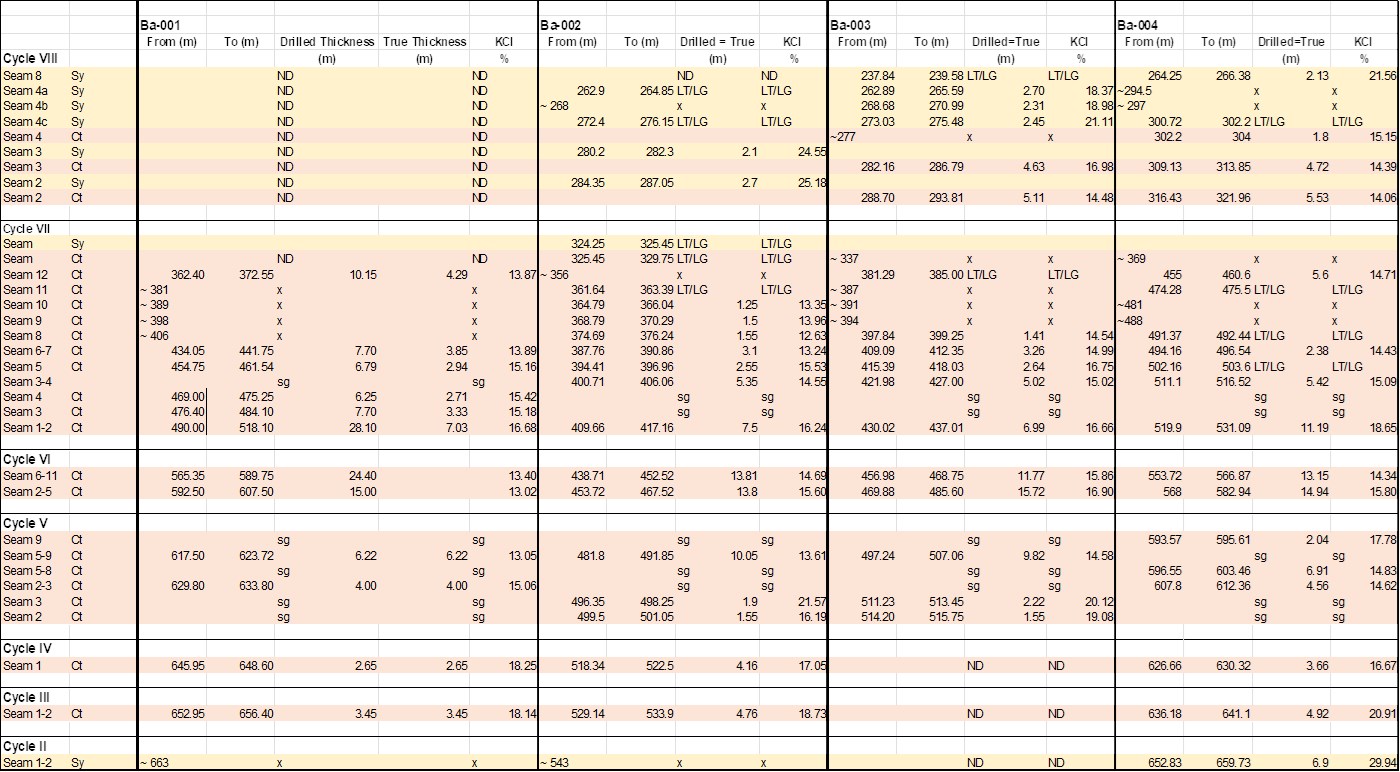
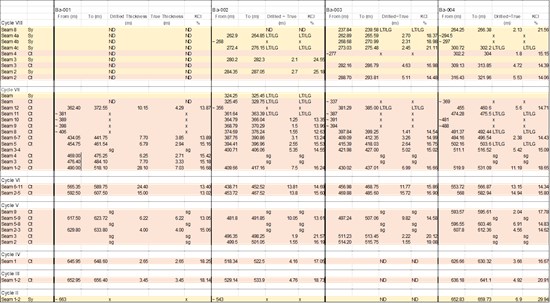
The seams which meet these criteria are outlined in Table 2 below.

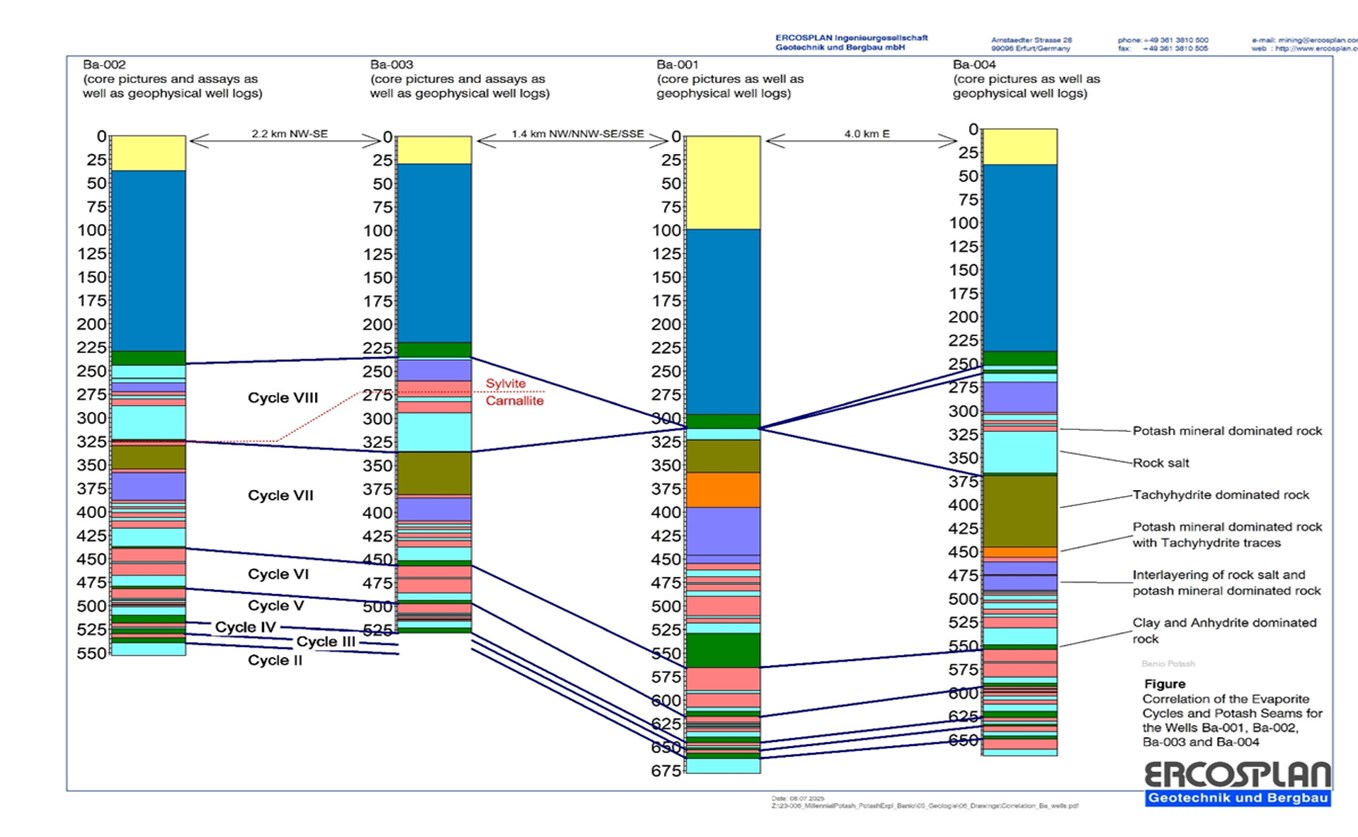
The flat-lying nature of the West African Evaporite Basin, confirmed in the project area by results from extensive seismic studies coupled with drillhole geological information, allows for extrapolation of the various cycles and seams over significant distances. The evaporite basin geology outlined in the stratigraphic columns in Figure 1 confirms continuity of potash seams over approximately 8,000m of strike length based on drill holes BA-001, BA-002, BA-003, and BA-004

Resource Estimate

In calculating the mineral resource tonnages, the following procedures were completed (Mineral Resources are given as in-situ mineralization):

  • Around each drill hole, a Radius of Influence (ROI) was defined and by intersection of these ROIs, polygons around drill holes where constructed.
  • Each polygon was clipped by the coast of Banio Lagoon and restricted to only onshore areas within the Mayumba Permit. The volume for each potash seam was calculated by multiplying the clipped polygon area with the thickness of the potash seam.
  • The carnallitite tonnage was calculated by multiplying the volume assigned to each seam with a carnallitite tonnage factor (density). The density for each seam was determined individually from the relative abundance of the salt minerals in the carnallitite seam and varies from between 1.77 g/cm³ for high grade carnallitite and 1.80 g/cm³ for low grade carnallitite seams. For Sylvinite seams, a sylvinite tonnage factor was similarly determined. Based on Sylvite grade, density varied between 2.07 g/cm³ and 2.13 g/cm³.
  • The KCl grade of each seam was calculated from a weighted average grade of drillholes sample results collected from the individual seams.

The MRE classifies the carnallitite mineralization as Measured, Indicated and Inferred Mineral Resources, and the and sylvinite mineralization as Indicated and Inferred, as defined by NI 43-101. This reflects the level of confidence in the extent and grade of both the carnallitite and sylvinite bodies.

The criteria used in the MRE to define the extension of mineralization from each drillhole for the Measured, Indicated and Inferred carnallitite resources is as follows:

  • Measured Mineral Resources occur within a radius of 700m of a drill hole, as long as the seismic survey results show no significant change in thickness of the overall salt section. The ROI for Indicated Mineral Resources is not extended beyond the position of faults interpreted from the seismic survey sections.
  • Indicated Mineral Resources occur within a radius of 1,400m of a drill hole, minus the Measured Resources as long as the seismic survey results show no significant change.

Table 2 Composite carnallitite and sylvinite seam data from drillholes utilized in the MRE.
To view an enhanced version of this graphic, please visit:
https://images.newsfilecorp.com/files/4674/274691_66dc182ab4e6286e_002full.jpg

ND no data, as the cycle has not been preserved in this drill hole (BA-001 Cycle VIII) or has not been drilled Cycle II to Cycle IV in Ba-003

LT/LG thickness or grade do just not meet the criteria
X = mineralization may be present, but thickness and grade far off from meeting criteria
Sg = slightly different grouping of seams between drill holes
Blank-empty in Cycle VI and Cycle VII due to seams being either Ct or Sy in different drill holes
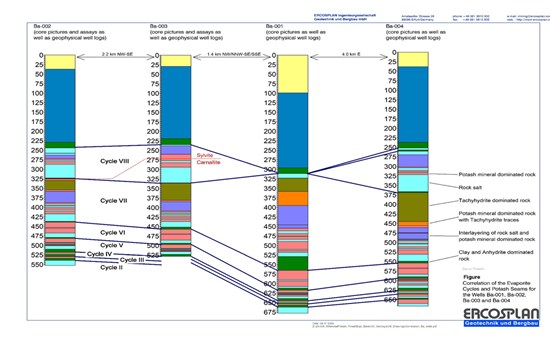

Fig. 1 Correlation of potash cycles displaying good continuity from BA-002, BA-003, BA-001 and BA-004 drillholes.

To view an enhanced version of this graphic, please visit:
https://images.newsfilecorp.com/files/4674/274691_66dc182ab4e6286e_003full.jpg

  • in thickness of the overall salt section. The ROI for Indicated Mineral Resources is not extended beyond the position of faults interpreted from the seismic survey sections.
  • Inferred Mineral Resources occur within a radius of 2,800m of a drillhole, minus the Measured and Indicated resources within this area. Considering that for Inferred Mineral Resources the continuity of grade and thickness only have to be implied, the ROI for this category is predicted to extend into the fault bounded downthrown block that has been interpreted from the seismic sections.

Similarly, the MRE utilizes the following criteria to estimate the extension of the Indicated and Inferred sylvinite resources from a drillhole:

  • Measured Mineral Resources for sylvinite have not been assigned due to the uncertainly in the extent of the sylvinite deposition as it is primarily a secondary form of mineralization and structurally controlled.
  • Indicated Mineral Resources occur within a radius of 500m of a drill hole, as long as the seismic survey results show no significant change in thickness of the overall salt section.
  • Inferred Mineral Resources occur within a radius of 1,000m of a drill hole, minus the Indicated resources within this area.

Since the extent of the Sylvite mineralization is secondary and mainly structurally controlled, the ROIs for the sylvinite mineralization are not extended beyond faults interpreted from the seismic survey sections.

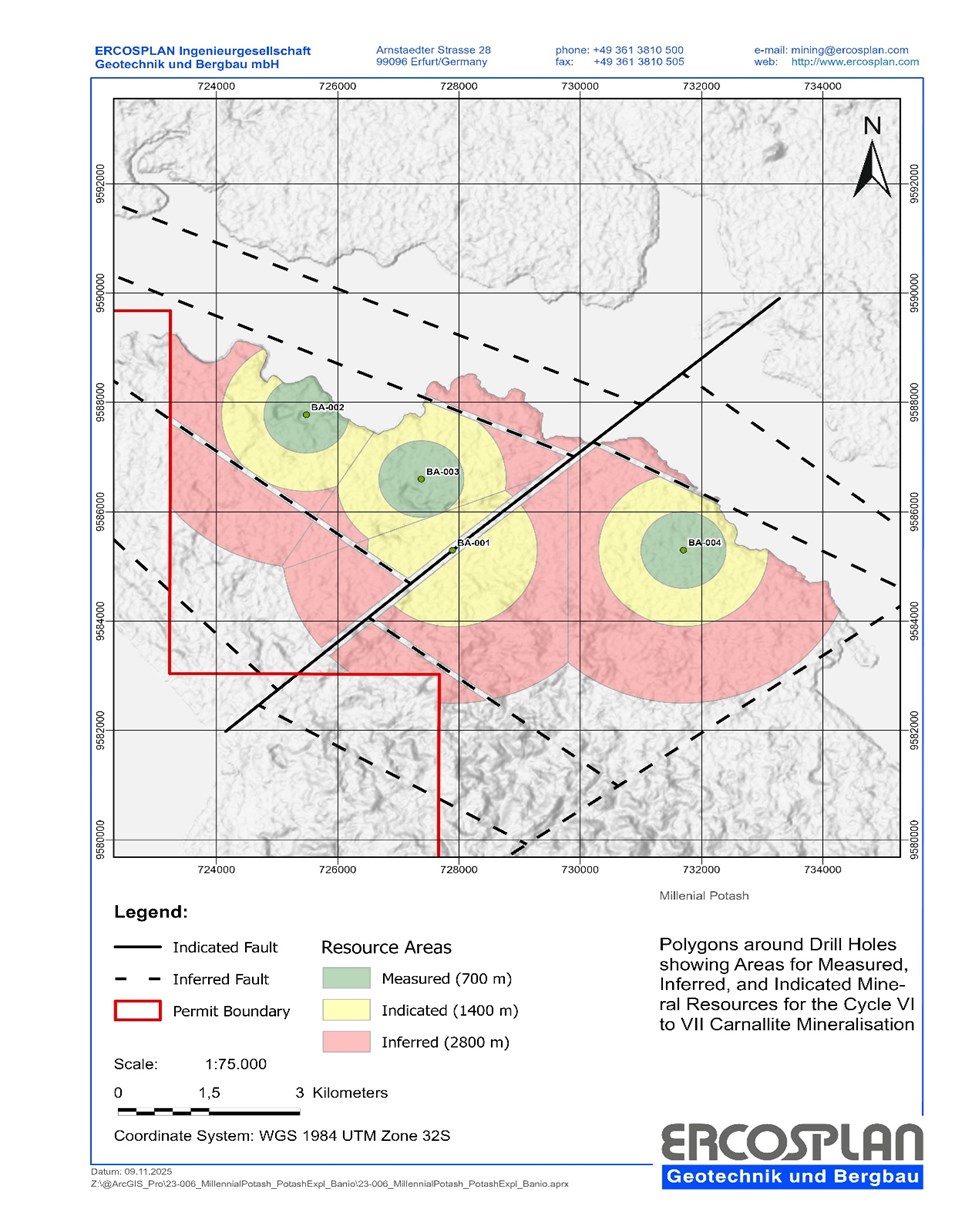
The ROI distribution for carnallitite seams in Cycles VI to VII showing the Indicated resource ROI clipped at interpreted faults and the Inferred ROI extending beyond these same faults is shown in Figure 2.

Cycles VI and VII in BA-001 display anomalous thickness which may be a local feature related to proximity to a NE-SW trending fault and localized folding. ERCOSPLAN has interpreted the substantial thicknesses of Cycles VI and VII to be local features and in order to be conservative in the resource estimate, have calculated True Thicknesses for all the seams in these two cycles through structural analysis and comparisons to adjacent, unaffected drillhole stratigraphy. Minor uncertainty remains regarding the exact position of this fault and consequently a 200 m wide barrier with no Mineral Resources is defined along the interpreted fault. Uncertainty around additional faults interpreted from the seismic sections are accommodated by a non-resource zone 100m wide associated with each potential fault.

The resulting Measured, Indicated and Inferred mineral resources for the Banio Project are presented in Tables 3, 4 and 5. The robust carnallitite Measured Mineral Resource Estimate of 648M tonnes grading 15.7% KCl, and carnallitite Indicated Mineral Resource Estimate of 1.77 billion tonnes grading 15.4% KCl provide a solid base for continuing exploration and development at the project and for the initiation of a Feasibility Study. The FS the Company plans to complete will focus only on the North Target although significant potential for potash mineralization is interpreted from downhole geophysical studies completed in several oil and gas wells at the South Target of the permit area.
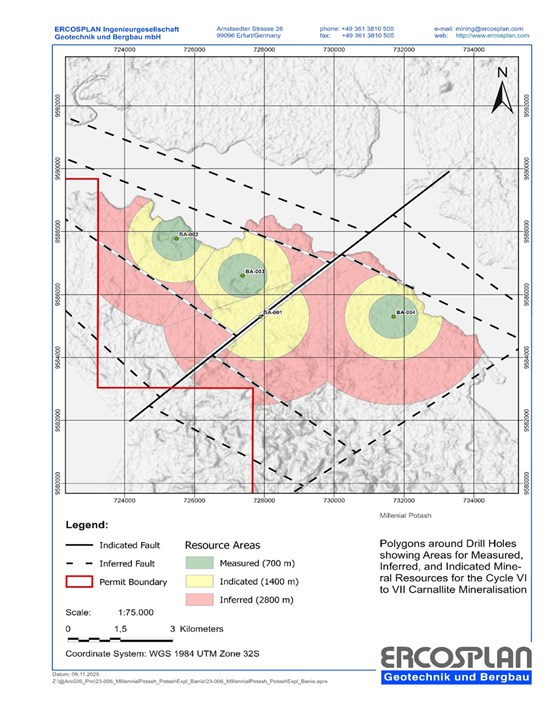

Figure 2 Measured, Indicated and Inferred ROI Polygons for Carnallitite Seams in Cycles VI to VII with interpreted faults zones

To view an enhanced version of this graphic, please visit:
https://images.newsfilecorp.com/files/4674/274691_66dc182ab4e6286e_004full.jpg

In addition to carnallitite resources, the sylvinite mineralization, with Indicated Mineral Resources of approximately 35.2M tonnes grading 24.3% KCl and Inferred Mineral Resources of approximately 96.2M tonnes at 24.3% KCl, represent attractive exploration targets with higher grades that may enhance the overall grade of the project.

Table 3: Measured Mineral Resources*

DRILLHOLE AREA (km2) THICKNESS
(m)
MINERALOGY TONNAGE (MT) GRADE % KCl TONNAGE (MT KCl)
BA-001 1.26 16.32 Carnallitite 37.00 15.41 5.70
BA-002 1.37 72.83 Carnallitite 179.77 15.33 27.55
BA-003 1.53 70.14 Carnallitite 191.85 16.06 30.82
BA-004 1.54 86.82 Carnallitite 239.56 15.79 37.82
MEASURED TOTAL Carnallitite 648.19 15.72 101.89

Table 4: Indicated Mineral Resources*

DRILLHOLE AREA (km2) THICKNESS
(m)
MINERALOGY TONNAGE (MT) GRADE % KCl TONNAGE (MT KCl)
BA-001 3.95 68.41 Carnallitite 487.27 14.44 70.37
BA-002 0.79 4.8 Sylvinite 7.99 24.91 1.99
BA-002 2.57 72.83 Carnallitite 336.54 15.36 51.69
BA-003 0.79 7.46 Sylvinite 12.47 19.45 2.43
BA-003 2.85 70.14 Carnallitite 358.39 16.06 57.55
BA-004 0.79 9.03 Sylvinite 14.69 28.00 4.11
BA-004 3.77 87.89 Carnallitite 587.18. 15.79 92.70
INDICATED TOTAL Carnallitite 1,769.39 15.39 272.31
Sylvinite 35.15 24.26 8.53
TOTAL INDICATED CT+SYL 1,804.54 15.56 280.84
MEASURED + INDICATED Carnallitite 2,417.58 15.48 374.20
Sylvinite 35.15 24.26 8.53
TOTAL M + I CT+SYL 2,452.73 15.61 382.73

Table 5: Inferred Mineral Resources*

DRILLHOLE AREA (km2) THICKNESS (m) MINERALOGY TONNAGE (MT) GRADE % KCl TONNAGE (MT KCl)
BA-001 8.10 68.41 Carnallitite 998.17 14.56 145.32
BA-002 1.56 4.80 Sylvinite 15.88 24.91 3.96
BA-002 5.15 72.83 Carnallitite 673.89 15.43 103.96
BA-003 2.36 7.46 Sylvinite 37.41 19.45 7.28
BA-003 2.62 70.14 Carnallitite 329.81 16.04 52.90
BA-004 4.52 4.58 Sylvinite 42.86 28.00 12.00
BA-004 9.38 87.89 Carnallitite 1,461.47 15.74 230.03
INFERRED TOTAL Carnallitite 3,463.34 15.37 532.20
Sylvinite 96.15 24.16 23.23
TOTAL INFERRED 3,559.49 15.61 555.43

*Cautionary Notes:

  1. MT=Million Tonnes, tonnage is for in-situ resource with no discount for recovery as mining and processing methods are to be finalized. Potash deposits have been mined by underground, open pit and solution mining methods.
  2. The numbers for tonnage, average KCl per cent are rounded figures
  3. Mineral resources that are not mineral reserves do not have demonstrated economic viability. The estimates of mineral resources may be materially affected by environmental, permitting, legal, title, taxation, sociopolitical, marketing, or other relevant issues.
  4. The quantity and grade of reported Inferred resources in this estimation are uncertain in nature and there has been insufficient exploration to define these Inferred resources as an Indicated or Measured mineral resource and it is uncertain if further exploration will result in upgrading them to an Indicated or Measured mineral resource category.
  5. Densities used in resource calculations are 2.07-2.13 g/cm3 for Sylvinite and 1.77-1.80 g/cm3 for Carnallitite

The Company is required to file an NI 43-101 compliant technical report on SEDAR within 45 days of the initial disclosure of the MRE made herein.

The information in this news release has been reviewed and approved by Sebastiaan van der Klauw, EurGeol, of ERCOSPLAN and Peter J. MacLean, Ph.D., P. Geo, Director of the Company, and both are Qualified Persons as that term is defined in National Instrument 43-101.

To find out more about Millennial Potash Corp. please contact Investor Relations at (604) 662-8184 or email at info@millennialpotash.com.

Keep up-to-date on Millennial Potash developments and join our online communities on: Twitter, Facebook, LinkedIn, Instagram and YouTube.

MILLENNIAL POTASH CORP.

“Farhad Abasov”
Chair of the Board of Directors

Neither the TSX Venture Exchange nor its Regulation Services Provider (as that term is defined in the policies of the TSX Venture Exchange) accepts responsibility for the adequacy or accuracy of this release.

This document may contain certain “Forward-Looking Statements” within the meaning of the United States Private Securities Litigation Reform Act of 1995 and applicable Canadian securities laws. When used in this news release, the words “anticipate”, “believe”, “estimate”, “expect”, “target, “plan” or “planned”, “forecast”, “intend”, “may”, “schedule” and similar words or expressions identify forward-looking statements or information. These forward-looking statements or information may relate to future prices of commodities, accuracy of mineral or resource exploration activity, reserves or resources, regulatory or government requirements or approvals including approvals of title and mining rights or licenses and environmental (including land or water use), local community or indigenous community approvals, the reliability of third party information, continued access to mineral properties or infrastructure, changes in laws, rules and regulations in Gabon or any other jurisdiction which may impact upon the Company or its properties or the commercial exploitation of those properties, currency risks including the exchange rate of USD$ for Cdn$ or CFA or other currencies, fluctuations in the market for potash or potash related products, changes in exploration costs and government royalties, export policies or taxes in Gabon or any other jurisdiction and other factors or information. The Company’s current plans, expectations and intentions with respect to development of its business and of the Banio Potash Project may be impacted by economic uncertainties arising out of any pandemic or by the impact of current financial and other market conditions on its ability to secure further financing or funding of the Banio Potash Project. Such statements represent the Company’s current views with respect to future events and are necessarily based upon a number of assumptions and estimates that, while considered reasonable by the Company, are inherently subject to significant business, economic, competitive, political, environmental and social risks, contingencies and uncertainties. Many factors, both known and unknown, could cause results, performance or achievements to be materially different from the results, performance or achievements that are or may be expressed or implied by such forward-looking statements. The Company does not intend, and does not assume any obligation, to update these forward-looking statements or information to reflect changes in assumptions or changes in circumstances or any other events affecting such statements and information other than as required by applicable laws, rules and regulations.

The issuer is solely responsible for the content of this announcement.

Lens Technology: Securing AI Edge Hardware Leadership Through Three Core Strengths and a Three-Year Roadmap

HONG KONG, Nov. 17, 2025 /PRNewswire/ — At the GF Securities 2025 Global Investment Forum and Closed-Door Exchange for Select Listed Companies, Lens Technology (6613.HK) Chairman Zhou Qunfei articulated the company’s strategic vision for AI edge hardware. She underscored that success in this arena hinges on seamlessly integrating technological innovation with manufacturing excellence. Backed by three unique competitive strengths, Lens Technology is positioned to claim industry leadership.

1. R&D Excellence: End-to-End Innovation and Technology Transfer

Innovation is the cornerstone of Lens Technology. Since its IPO, the company has committed more than RMB 20 billion to R&D, including RMB 2.44 billion in the first nine months of 2025—an R&D intensity sustained above 4%. Rather than isolated advances, Lens pursues integrated breakthroughs across materials, processes, and equipment.

Its portfolio extends from consumer-electronics staples—UTG glass, 3D glass, liquid metal, and titanium alloy machining—to AI-enabling components such as light-guide lenses, functional modules, robot joints, dexterous hands, and glass hard-disk substrates.

A key differentiator is the rapid cross-domain application of proven technologies. Smartphone glass-processing expertise has been adapted for automotive panels; refined imprinting and etching techniques have boosted light-guide lens yield and throughput; and collaboration with a tier-one HDD maker has yielded glass substrates poised to displace aluminum, opening new revenue streams.

2. Manufacturing Mastery: Vertical Integration and Agile Delivery

To satisfy AI hardware’s demands for scale and precision, Lens pioneered a “single-piece flow” glass line that condenses over 200 steps into fewer than 50, enabling flexible, end-to-end production with superior efficiency and quality.

The company controls every link—from raw materials, molds, and tooling to automation equipment—and delivers everything from components and modules to full ODM assemblies. This vertically integrated model ensures cost discipline and responsiveness. When a flagship client faced AI-glasses shortages, Lens designed molds, built lines, and reached volume production within weeks.

3. Ecosystem Partnership: From Vendor to Strategic Co-Creator

Lens has evolved into a front-end R&D collaborator, embedding its engineers with client hardware teams from concept through commercialization. This leverages Lens’s strengths in design, lean operations, and supply-chain orchestration.

Commercial wins include mass production of the Zhiyuan Lingxi robot and Alipay terminals. In embodied intelligence, Lens supplies leading North American and Chinese robotics players with joint modules and dexterous hands. In 2025, it anticipates shipping 3,000 humanoid robots and over 10,000 quadruped units, placing its assembly capacity in the global top tier and establishing Lens as a pivotal platform for intelligent hardware.

Three-Year Strategic Roadmap: Global Leadership by 2027

Zhou Qunfei unveiled a focused three-year plan anchored in intensified R&D and three priority domains:

  • Consumer Electronics & AI Glasses Strengthen leadership in precision structures and modules; broaden brittle-material, sapphire, and ceramic capabilities. Within two years, become the primary supplier for premier clients’ AI glasses across components, modules, and assembly. By 2027, rank among the world’s top assemblers and dominate light-guide technology.
  • Automotive Electronics Perfect panoramic-display and smart-interaction integration; accelerate communication and domain-controller modules. By 2026, supply ultra-thin laminated glass at million-unit annual scale to major global OEMs. By 2027, expand share in interactive automotive systems.
  • Robotics Lightweight humanoid-joint modules; develop full-stack capabilities from software adaptation to final assembly. By 2026, multiply core-component and assembly volumes. By 2027, lead worldwide shipments of humanoid and quadruped robots.

Zhou Qunfei concluded that Lens Technology is determined to become a global leader in AI edge hardware manufacturing. By fusing technological depth, manufacturing rigor, and collaborative ecosystems, the company will transform edge intelligence from cloud abstraction into tangible reality.

Compiled from Chairman Zhou Qunfei’s address at the GF Securities 2025 Global Investment Forum.

United States Hosts 1.2 Million International Students at Colleges and Universities, Totaling 6% of U.S. Higher Education

WASHINGTON, Nov. 17, 2025 /PRNewswire/ — Today, the Open Doors® 2025 Report on International Educational Exchange, the leading annual benchmark for international educational exchange in the United States, announces that U.S. colleges and universities hosted 1.2 million (1,177,766) international students in the 2024/2025 academic year, a 5% overall increase from the previous year.

International students accounted for 6% of the total U.S. higher education population. International students contributed nearly $55 billion to the U.S. economy in 2024, according to the U.S. Department of Commerce, and supported more than 355,000 jobs across the United States, according to NAFSA. The United States remains the top destination for international students globally.

“International students come to the United States to advance their education and contribute to U.S. colleges and communities,” said Jason Czyz, Institute of International Education (IIE) President and CEO. “This data highlights the impact international students have in driving innovation, advancing scholarship, and strengthening cross-cultural understanding.”

International student numbers vary by academic level

The number of graduate students (488,481) pursuing master’s or doctorate degrees decreased by 3%, following three years of growth. The number of undergraduate students grew by 4% to 357,231, marking the first significant increase at that academic level since the COVID-19 pandemic. The number of international students on Optional Practical Training (OPT) reached 294,253 students, an increase of 21% from the prior year. More than half (57%) of international students across academic levels pursued STEM fields of study.

The total number of new international students – those enrolling at a U.S. college or university for the first time in fall 2024 – decreased by 7% (277,118). This varied by academic level – the number of new undergraduates grew by 5%, while the number of new graduate students fell by 15%.

India remains the top-sending country of international students

There were 363,019 international students from India in the U.S. in 2024/2025, reflecting a 10% increase from the prior year. China followed with 265,919 students, a 4% decline. Twelve of the top 25 countries sending international students reached their largest totals to date: Bangladesh, Canada, Colombia, Ghana, India, Italy, Nepal, Nigeria, Pakistan, Peru, Spain, and Vietnam.

Most international students studied at public institutions, with the largest growth at community colleges

International students studied in all 50 states. Among the 45 states that saw increases in their international student totals, the largest growth was reported in Texas (+8%, +7,497 students), Illinois (+7%, +4,336 students), and Missouri (+11%, +3,694 students). Most international students (59%) attended public institutions, while community colleges experienced the fastest rate of growth (+8%) among institutions.

U.S. students studying abroad rises, with top destinations in Europe and Asia

The Open Doors Report showed that in the 2023/24 academic year, 298,180 U.S. students studied abroad for academic credit, an increase of 6% from the prior year. Italy, Spain, the United Kingdom, and France remained the leading host destinations, with nearly half (45%) of all students studying in these top four destinations. Japan became the 5th-largest destination for the first time, with a robust 16% growth in 2023/24. Seven destinations in the top 25 reached all-time study abroad highs as of 2023/24: Denmark, Greece, Italy, Japan, Portugal, South Korea, and Spain.

“The Open Doors report provides a comprehensive picture of the destinations where U.S. students study abroad,” said Dr. Mirka Martel, IIE Head of Research, Evaluation & Learning. “For U.S. students, studying abroad is an integral part of the higher education experience that prepares them to thrive in a global economy.”

Fall 2025 Snapshot on International Student Enrollment
Over 825 U.S. higher education institutions participated in the Fall 2025 Snapshot, providing an initial look into international student numbers as of the 2025/26 academic year. These institutions report a 1% decline in international student totals in fall 2025. Undergraduate enrollments are up by 2 percent, while graduate enrollments have decreased by 12 percent. OPT continued to increase by 14 percent. New enrollments, international students studying at their U.S. college or university for the first time in fall 2025, decreased by 17%. Many institutions are continuing to focus on international student recruitment, citing the value of international students’ perspectives on campus (81%) and their financial contributions (60%). 

About Open Doors
Open Doors is the most comprehensive information resource on international students and scholars in the United States and on U.S. students studying abroad for academic credit. The Open Doors project is sponsored by the U.S. Department of State with funding provided by the U.S. Government and supported in its implementation by the Institute of International Education. For more data, infographics, and resources, visit opendoorsdata.org.