Home Blog Page 208

Yalla Group Limited Announces Unaudited Second Quarter 2026 Financial Results

DUBAI, UAE, Aug. 18, 2026 /PRNewswire/ — Yalla Group Limited (“Yalla” or the “Company”) (NYSE: YALA), the largest Middle East and North Africa (MENA)-based online social networking and gaming company, today announced its unaudited financial results for the second quarter ended June 30, 2026.

Second Quarter 2026 Financial and Operating Highlights

  • Revenues were US$82.6 million in the second quarter of 2026, compared with US$84.6 million in the second quarter of 2025.
    • Revenues generated from chatting services in the second quarter of 2026 were US$47.4 million.
    • Revenues generated from games services in the second quarter of 2026 were US$34.2 million.
  • Net income was US$29.3 million in the second quarter of 2026, compared with US$36.5 million in the second quarter of 2025. Net margin[1] was 35.5% in the second quarter of 2026.
  • Non-GAAP net income[2] was US$34.4 million in the second quarter of 2026, compared with US$39.4 million in the second quarter of 2025. Non-GAAP net margin[3] was 41.7% in the second quarter of 2026.
  • Average MAUs[4] increased by 12.3% to 47.6 million in the second quarter of 2026, compared with 42.4 million in the second quarter of 2025.
  • The number of paying users[5] was 10.9 million in the second quarter of 2026, compared with 11.2 million in the second quarter of 2025.

Key Operating Data

For the three months ended

June 30, 2025

June 30, 2026

Average MAUs (in thousands)

42,421

47,625

Paying users (in thousands)

11,186

10,861

[1] Net margin is net income as a percentage of revenues.

[2] Non-GAAP net income represents net income excluding share-based compensation. Non-GAAP net income is a non-GAAP financial measure. See the sections titled “Non-GAAP Financial Measures” and “Reconciliations of GAAP and Non-GAAP Results” for more information about the non-GAAP measures referred to in this press release.

[3] Non-GAAP net margin is non-GAAP net income as a percentage of revenues.

[4] “Average MAUs” refers to the average monthly active users in a given period, calculated by dividing (i) the sum of active users for each month of such period by (ii) the number of months in such period. “Active users” refers to registered users who accessed any of our main mobile applications at least once during a given period; main mobile applications are mobile applications that have exceeded the 0.5 million average MAUs threshold at least once.

[5] “Paying users” refers to registered users who played a game or purchased our virtual items or upgraded services using virtual currencies on our main mobile applications at least once in a given period, except for users who received all of their virtual currencies directly or indirectly from us for free. “Registered users” refers to users who have registered accounts on our main mobile applications as of a given time; a registered user is not necessarily a unique user, as an individual may register multiple accounts on our main mobile applications.

“We delivered solid results across our flagship products and growing momentum in our gaming business in the second quarter of 2026,” said Mr. Tao Yang, Founder, Chairman and CEO of Yalla. “Our revenues exceeded the upper end of our guidance, driven by an 11.6% year-over-year increase in revenues from games services. Meanwhile, our core products continued to build momentum, with refined operations and targeted marketing driving a sequential rebound in paying users for Yalla Ludo and a 12.3% year-over-year increase in overall average MAUs to 47.6 million.

“Beyond the sustained strength of our flagship products, we made progress in expanding our gaming ecosystem. Our new games, including our first self-developed match-3 title and desert-themed SLG title, continued to advance smoothly with a clear roadmap taking shape for the next stage of development. We also continued to strengthen our pipeline of self-developed products, spanning casual games, hyper-casual games, social products and AI applications, designed to maximize the synergy between our social and gaming ecosystems. Building on years of deep-rooted expertise in MENA, we will continue to unlock local opportunities and broaden our reach globally through strategic partnerships to deliver sustainable growth for our shareholders.”

Ms. Karen Hu, CFO of Yalla, commented, “In the second quarter of 2026, we continued to pursue high-quality development while maintaining solid profitability. Total revenues were US$82.6 million, with revenues from games services growing to US$34.2 million, increasing the segment’s contribution to 41.4%. While doubling our selling and marketing expenses year over year to support the promotion of new products, we maintained a healthy non-GAAP net margin of 41.7% through increased efficiency. Our balance sheet and cash flow remain ample to support our investments in business expansion as well as consistent shareholder returns. Going forward, we will continue to invest in long-term growth while driving value creation.”

Second Quarter 2026 Financial Results

Revenues

Revenues were US$82.6 million in the second quarter of 2026, compared with US$84.6 million in the second quarter of 2025, primarily due to a decrease in paying users attributable to the impact of recent geopolitical events in the broader region, partially offset by an increase in revenues from games services.

In the second quarter of 2026, revenues generated from chatting services were US$47.4 million, and revenues from games services were US$34.2 million.

Costs and expenses

Total costs and expenses were US$63.2 million in the second quarter of 2026, compared with US$53.9 million in the second quarter of 2025.

Cost of revenues was US$26.8 million in the second quarter of 2026, a 4.1% decrease from US$27.9 million in the second quarter of 2025, primarily due to lower commission fees paid to third-party payment platforms. Cost of revenues as a percentage of total revenues decreased to 32.4% in the second quarter of 2026 from 33.0% in the second quarter of 2025.

Selling and marketing expenses were US$17.8 million in the second quarter of 2026, a 106.0% increase from US$8.7 million in the second quarter of 2025, primarily due to higher advertising and market promotion expenses attributable to the Company’s continued user acquisition efforts and support for new games. Selling and marketing expenses as a percentage of total revenues increased to 21.6% in the second quarter of 2026 from 10.2% in the second quarter of 2025.

General and administrative expenses were US$8.6 million in the second quarter of 2026, a 4.0% decrease from US$9.0 million in the second quarter of 2025, primarily due to a decrease in incentive compensation, partially offset by an increase in foreign exchange loss. General and administrative expenses as a percentage of total revenues slightly decreased to 10.5% in the second quarter of 2026 from 10.6% in the second quarter of 2025.

Technology and product development expenses were US$9.9 million in the second quarter of 2026, an 18.9% increase from US$8.3 million in the second quarter of 2025, primarily due to an increase in salaries and benefits for our technology and product development staff, driven by an increase in headcount to support the development of new businesses and our product portfolio expansion. Technology and product development expenses as a percentage of total revenues increased to 12.0% in the second quarter of 2026 from 9.9% in the second quarter of 2025.

Operating income

Operating income was US$19.4 million in the second quarter of 2026, compared with US$30.6 million in the second quarter of 2025.

Non-GAAP operating income[6]

Non-GAAP operating income in the second quarter of 2026 was US$24.5 million, compared with US$33.5 million in the second quarter of 2025.

Interest income

Interest income was US$5.4 million in the second quarter of 2026, compared with US$6.8 million in the second quarter of 2025.

Investment income

Investment income was US$5.1 million in the second quarter of 2026, compared with US$0.02 million in the second quarter of 2025, primarily due to changes in the fair value of wealth management products.

Income tax expense

Income tax expense was US$0.6 million in the second quarter of 2026, compared with US$1.5 million in the second quarter of 2025.

Net income

Net income was US$29.3 million in the second quarter of 2026, compared with US$36.5 million in the second quarter of 2025.

Non-GAAP net income

Non-GAAP net income in the second quarter of 2026 was US$34.4 million, compared with US$39.4 million in the second quarter of 2025.

Earnings per ordinary share

Basic and diluted earnings per ordinary share were US$0.21 and US$0.18, respectively, in the second quarter of 2026, while basic and diluted earnings per ordinary share were US$0.24 and US$0.20, respectively, in the second quarter of 2025.

Non-GAAP earnings per ordinary share[7]

Non-GAAP basic and diluted earnings per ordinary share were US$0.24 and US$0.21, respectively, in the second quarter of 2026, compared with US$0.25 and US$0.22, respectively, in the second quarter of 2025.

Cash and cash equivalents, restricted cash, term deposits and short-term investments

As of June 30, 2026, the Company had cash and cash equivalents, restricted cash, term deposits and short-term investments of US$824.2 million, compared with US$754.6 million as of December 31, 2025.

[6] Non-GAAP operating income represents operating income excluding share-based compensation. Non-GAAP operating income is a non-GAAP financial measure. See the sections titled “Non-GAAP Financial Measures” and “Reconciliations of GAAP and Non-GAAP Results” for more information about the non-GAAP measures referred to in this press release.             

[7] Non-GAAP earnings per ordinary share is non-GAAP net income attributable to Yalla Group Limited’s shareholders, divided by the weighted average number of basic and diluted shares outstanding. Non-GAAP net income attributable to Yalla Group Limited’s shareholders represents net income attributable to Yalla Group Limited’s shareholders, excluding share-based compensation. Non-GAAP earnings per ordinary share and non-GAAP net income attributable to Yalla Group Limited’s shareholders are non-GAAP financial measures. See the sections titled “Non-GAAP Financial Measures” and “Reconciliations of GAAP and Non-GAAP Results” for more information about the non-GAAP measures referred to in this press release.

Share Repurchase Program

Under the Company’s two share repurchase programs launched in 2021 and 2026 (the “2021 Program” and the “2026 Program”), the Company repurchased 4,357,024 American depositary shares (“ADSs”), representing 4,357,024 Class A ordinary shares, for an aggregate amount of approximately US$27.6 million in the first half of 2026. Of this number, 2,896,035 ADSs, representing 2,896,035 Class A ordinary shares, were repurchased during the second quarter of 2026, for an aggregate amount of approximately US$18.0 million.

The 2021 Program expired on May 21, 2026. Under the 2021 Program, the Company was authorized to repurchase up to US$150 million worth of its outstanding ADSs and/or Class A ordinary shares, and the Company repurchased a cumulative total of 18,762,758 ADSs, representing 18,762,758 Class A ordinary shares, from the open market with cash for an aggregate amount of approximately US$126.5 million.

In addition, the Company had cancelled 12,734,059 ADSs, representing 12,734,059 Class A ordinary shares, as of August 14, 2026. The Company will continue executing its 2026 Program, under which the Company may repurchase up to US$150 million worth of its outstanding ADSs and/or Class A ordinary shares over the 24 months starting from March 9, 2026.

Outlook

For the third quarter of 2026, Yalla currently expects revenues to be between US$78.0 million and US$85.0 million.

The above outlook is based on current market conditions and reflects the Company management’s current and preliminary estimates of market and operating conditions and customer demand, which are all subject to change.

Conference Call

Yalla Group Limited will hold a conference call on Monday, August 17, 2026, at 8:00 PM Eastern Time, 4:00 AM Dubai Time on Tuesday, August 18, 2026, or 8:00 AM Beijing Time on Tuesday, August 18, 2026, to discuss the financial results.

Participants should complete online registration using the link provided below before the scheduled start time. Upon registration, participants will receive the conference call access information, including dial-in numbers, a personal PIN and an e-mail with detailed instructions to join the conference call.

Event Title:               Yalla Group Ltd. Second Quarter 2026 Earnings Conference Call
Registration Link:     https://register-conf.media-server.com/register/BIa9b95130104d40aa9a598586197e750b

Additionally, a live webcast of the conference call will be available on the Company’s investor relations website at https://ir.yalla.com, and a replay of the webcast will be available following the session.

Non-GAAP Financial Measures

To supplement the financial measures prepared in accordance with generally accepted accounting principles in the United States, or GAAP, this press release presents non-GAAP financial measures, namely non-GAAP operating income, non-GAAP net income, non-GAAP net margin and non-GAAP basic and diluted earnings per ordinary share, as supplemental measures to review and assess the Company’s operating performance. The presentation of the non-GAAP financial measures is not intended to be considered in isolation or as a substitute for the financial information prepared and presented in accordance with U.S. GAAP. We define non-GAAP operating income as operating income excluding share-based compensation. We define non-GAAP net income as net income excluding share-based compensation. We define non-GAAP net margin as non-GAAP net income as a percentage of revenues. We define non-GAAP net income attributable to Yalla Group Limited’s shareholders as net income attributable to Yalla Group Limited’s shareholders, excluding share-based compensation. We define non-GAAP earnings per ordinary share as non-GAAP net income attributable to Yalla Group Limited’s shareholders, divided by the weighted average number of basic and diluted shares outstanding.

By excluding the impact of share-based compensation expenses, which are non-cash charges, the Company believes that the non-GAAP financial measures help identify underlying trends in its business and enhance the overall understanding of the Company’s past performance and future prospects. Investors can better understand the Company’s operating and financial performance, compare business trends among different reporting periods on a consistent basis and assess its core operating results, as they exclude share-based compensation expenses, which are not expected to result in cash payments. The Company also believes that the non-GAAP financial measures allow for greater visibility with respect to key metrics used by the Company’s management in its financial and operational decision-making.

The non-GAAP financial measures are not defined under U.S. GAAP and are not presented in accordance with U.S. GAAP. The non-GAAP financial measures have limitations as analytical tools. One of the key limitations of using the non-GAAP financial measures is that they do not reflect all items of income and expense that affect the Company’s operations. Share-based compensation has been and may continue to be incurred in the Company’s business and is not reflected in the presentation of non-GAAP financial measures. Further, the non-GAAP financial measures may differ from the non-GAAP information used by other companies, including peer companies, and therefore their comparability may be limited.

The Company compensates for these limitations by providing the relevant disclosure of its non-GAAP financial measures in the reconciliations to the nearest U.S. GAAP performance measures, all of which should be considered when evaluating its performance. The Company encourages investors and others to review its financial information in its entirety and not rely on a single financial measure.

Reconciliations of GAAP and non-GAAP results are set forth at the end of this press release.

About Yalla Group Limited

Yalla Group Limited is the largest MENA-based online social networking and gaming company, in terms of revenues in 2022. The Company operates two flagship mobile applications, Yalla, a voice-centric group chat platform, and Yalla Ludo, a casual gaming application featuring online versions of board games, popular in MENA, with in-game voice chat and localized Majlis functionality. Building on the success of Yalla and Yalla Ludo, the Company continues to add engaging new content, creating a regionally-focused, integrated ecosystem dedicated to fulfilling MENA users’ evolving online social networking and gaming needs. Through its holding subsidiary, Yalla Game Limited, the Company has expanded its capabilities in mid-core and hard-core games in the MENA region, leveraging its local expertise to bring innovative gaming content to its users. In addition, the growing Yalla ecosystem includes YallaChat, an IM product tailored for Arabic users, and casual games such as Yalla Baloot and 101 Okey Yalla, developed to sustain vibrant local gaming communities in MENA. Yalla is also actively exploring outside of MENA with Yalla Parchis, a Ludo game designed for the South American markets. Yalla’s mobile applications deliver a seamless experience that fosters a sense of loyalty and belonging, establishing highly devoted and engaged user communities through close attention to detail and localized appeal that profoundly resonates with users.

For more information, please visit: https://ir.yalla.com.

Safe Harbor Statement

This press release contains statements that may constitute “forward-looking” statements pursuant to the “safe harbor” provisions of the U.S. Private Securities Litigation Reform Act of 1995. These forward-looking statements can be identified by terminology such as “will,” “expects,” “anticipates,” “aims,” “future,” “intends,” “plans,” “believes,” “estimates,” “likely to” and similar statements. Statements that are not historical facts, including statements about Yalla Group Limited’s beliefs, plans and expectations, are forward-looking statements. Forward-looking statements involve inherent risks and uncertainties. Further information regarding these and other risks is included in Yalla Group Limited’s filings with the SEC. All information provided in this press release is as of the date of this press release, and Yalla Group Limited does not undertake any obligation to update any forward-looking statement, except as required under applicable law.

For investor and media inquiries, please contact:

Yalla Group Limited
Investor Relations
Kerry Gao – IR Director
Tel: +86-571-8980-7962
Email: ir@yalla.com

Piacente Financial Communications
Jenny Cai
Tel: +86-10-6508-0677
Email: yalla@tpg-ir.com

In the United States:

Piacente Financial Communications
Brandi Piacente
Tel: +1-212-481-2050
Email: yalla@tpg-ir.com

YALLA GROUP LIMITED

UNAUDITED CONDENSED CONSOLIDATED BALANCE SHEETS

As of

December 31,
2025

June 30,
2026

US$

US$

ASSETS

Current assets

Cash and cash equivalents

526,972,019

268,371,117

Restricted cash

1,625,525

1,797,132

Term deposits

84,800,000

217,427,135

Short-term investments

141,251,128

336,596,144

Prepayments and other current assets

41,659,226

31,167,184

Total current assets

796,307,898

855,358,712

Non-current assets

Property and equipment, net

14,976,818

15,146,724

Intangible asset, net

728,348

663,976

Operating lease right-of-use assets

1,902,655

4,840,602

Long-term investments

82,053,772

57,821,227

Other assets

250,000

858,516

Total non-current assets

99,911,593

79,331,045

Total assets

896,219,491

934,689,757

LIABILITIES

Current liabilities

Accounts payable

1,066,625

1,059,103

Deferred revenue, current

55,178,093

52,493,495

Operating lease liabilities, current

357,525

1,781,737

Amounts due to a related party

44,177

15,264

Income taxes payable

1,319,111

2,325,945

Accrued expenses and other current liabilities

30,350,120

25,363,411

Total current liabilities

88,315,651

83,038,955

Non-current liabilities

Deferred revenue, non-current

1,837,543

1,453,259

Operating lease liabilities, non-current

1,095,245

2,686,922

Deferred tax liabilities

2,924,137

2,885,096

Total non-current liabilities

5,856,925

7,025,277

Total liabilities

94,172,576

90,064,232

EQUITY

Shareholders’ equity of Yalla Group Limited

Class A Ordinary Shares

13,441

13,441

Class B Ordinary Shares

2,473

2,473

Additional paid-in capital

339,199,644

349,196,164

Treasury stock

(42,497,929)

(66,242,824)

Accumulated other comprehensive (loss) income

(1,636,586)

668,175

Retained earnings

515,197,658

572,215,132

Total shareholders’ equity of Yalla Group Limited

810,278,701

855,852,561

Non-controlling interests

(8,231,786)

(11,227,036)

Total equity

802,046,915

844,625,525

Total liabilities and equity

896,219,491

934,689,757


YALLA GROUP LIMITED

UNAUDITED CONDENSED CONSOLIDATED STATEMENTS

OF OPERATIONS

Three Months Ended

Six Months Ended

June 30,
2025

March 31,
2026

June 30,
2026

June 30,
2025

June 30,
2026

US$

US$

US$

US$

US$

Revenues

84,564,086

79,006,789

82,608,696

168,440,853

161,615,485

Costs and expenses

Cost of revenues

(27,944,596)

(26,473,813)

(26,802,984)

(57,145,019)

(53,276,797)

Selling and marketing expenses

(8,661,573)

(9,722,665)

(17,841,216)

(15,604,841)

(27,563,881)

General and administrative expenses

(9,002,347)

(10,251,576)

(8,642,276)

(17,697,655)

(18,893,852)

Technology and product development expenses

(8,338,195)

(9,097,323)

(9,915,355)

(16,166,332)

(19,012,678)

Total costs and expenses

(53,946,711)

(55,545,377)

(63,201,831)

(106,613,847)

(118,747,208)

Operating income

30,617,375

23,461,412

19,406,865

61,827,006

42,868,277

Interest income

6,791,492

5,884,059

5,446,054

13,352,672

11,330,113

Government grants

603,115

67,165

4,699

666,548

71,864

Investment income (loss)

21,758

(432,522)

5,090,505

4,056

4,657,983

Income before income taxes

38,033,740

28,980,114

29,948,123

75,850,282

58,928,237

Income tax expense

(1,531,310)

(620,089)

(619,210)

(2,968,387)

(1,239,299)

Net income

36,502,430

28,360,025

29,328,913

72,881,895

57,688,938

Net loss attributable to non-controlling interests

269,782

575,459

2,434,355

981,717

3,009,814

Net income attributable to Yalla Group
Limited’s shareholders

36,772,212

28,935,484

31,763,268

73,863,612

60,698,752

Earnings per ordinary share

——Basic

0.24

0.19

0.21

0.47

0.40

——Diluted

0.20

0.16

0.18

0.41

0.34

Weighted average number of shares
outstanding used in computing earnings per
ordinary share

——Basic

155,958,658

152,975,006

150,945,883

157,604,992

151,954,839

——Diluted

180,765,359

177,171,652

175,048,711

181,508,856

176,104,576

Share-based compensation was allocated in cost of revenues, selling and marketing expenses, general and administrative expenses and
technology and product development expenses as follows:

Three Months Ended

Six Months Ended

June 30,
2025

March 31,
2026

June 30,
2026

June 30,
2025

June 30,
2026

US$

US$

US$

US$

US$

Cost of revenues

1,328,152

2,150,971

2,391,819

2,654,237

4,542,790

Selling and marketing expenses

170,304

440,566

425,808

341,332

866,374

General and administrative expenses

1,328,931

2,161,700

2,097,097

2,459,438

4,258,797

Technology and product development expenses

20,670

146,087

182,472

140,144

328,559

Total share-based compensation expenses

2,848,057

4,899,324

5,097,196

5,595,151

9,996,520


YALLA GROUP LIMITED

RECONCILIATIONS OF GAAP AND NON-GAAP RESULTS

Three Months Ended

Six Months Ended

June 30,
2025

March 31,
2026

June 30,
2026

June 30,
2025

June 30,
2026

US$

US$

US$

US$

US$

Operating income

30,617,375

23,461,412

19,406,865

61,827,006

42,868,277

Share-based compensation expenses

2,848,057

4,899,324

5,097,196

5,595,151

9,996,520

Non-GAAP operating income

33,465,432

28,360,736

24,504,061

67,422,157

52,864,797

Net income

36,502,430

28,360,025

29,328,913

72,881,895

57,688,938

Share-based compensation expenses,
net of tax effect of nil

2,848,057

4,899,324

5,097,196

5,595,151

9,996,520

Non-GAAP net income

39,350,487

33,259,349

34,426,109

78,477,046

67,685,458

Net income attributable to Yalla Group
Limited’s shareholders

36,772,212

28,935,484

31,763,268

73,863,612

60,698,752

Share-based compensation expenses, net of
tax effect of nil

2,848,057

4,899,324

5,097,196

5,595,151

9,996,520

Non-GAAP net income attributable to
Yalla Group Limited’s shareholders

39,620,269

33,834,808

36,860,464

79,458,763

70,695,272

Non-GAAP earnings per ordinary share

——Basic

0.25

0.22

0.24

0.50

0.47

——Diluted

0.22

0.19

0.21

0.44

0.40

Weighted average number of shares
outstanding used in computing earnings
per ordinary share

——Basic

155,958,658

152,975,006

150,945,883

157,604,992

151,954,839

——Diluted

180,765,359

177,171,652

175,048,711

181,508,856

176,104,576


Aon Announces CFO Transition

–  Nadin Virani appointed Interim CFO
–  Reaffirms full-year 2026 financial guidance

DUBLIN, Aug. 18, 2026 /PRNewswire/ — Aon plc (NYSE: AON), a leading global professional services firm, today announced that Edmund Reese will transition from his role as Executive Vice President and Chief Financial Officer, effective immediately, to pursue opportunities outside the firm. Aon appointed Nadin Virani as Interim CFO, effective immediately, and Reese will serve as senior advisor to Aon President and CEO Greg Case, through August 16, 2027, to support the transition.

“I want to recognize Edmund for his many contributions to our firm,” said Case. “Through consistent execution of our 3×3 Plan and a relentless and disciplined focus on performance, Edmund has helped to enhance our capabilities, accelerate growth and deliver meaningful value for our shareholders.”

“It has been a privilege to serve as CFO of Aon,” said Reese. “I am proud of the significant progress we have made building on the firm’s strong financial foundation, strengthening our growth engine and enhancing our capacity to invest in long-term value creation. With a winning strategy and an experienced financial leadership team in place, Aon is well positioned to continue delivering strong results and creating value for clients, colleagues and shareholders.”

Virani brings deep financial leadership expertise and a wealth of experience in the financial services industry to his new role, having previously served as the firm’s Global Head of Corporate Planning and Analytics with oversight of financial planning and analysis, forecasting processes, cash management and budgeting. Prior to joining Aon, Virani served as Head of Corporate Planning and Analytics at Broadridge Financial and General Manager for the Delta Amex Co-Brand portfolio at American Express, where for 18 years he held a number of CFO positions in London, Frankfurt and New York, supporting areas such as international and U.S. lending, loyalty, insurance and merchant pricing.

“As Global Head of Corporate Planning and Analytics and a member of our Aon Executive Committee, Nadin has played a central role in strengthening our financial performance and developing our strategy to drive sustainable growth across our firm,” said Case. “His financial expertise and proven leadership will be invaluable as we continue to accelerate our Aon United strategy and create better outcomes for clients and shareholders.”

Virani will report to Case and lead Aon’s Finance organization, while working closely with the Aon Executive Committee to ensure continuity and oversight of the firm’s financial strategy. Aon has also engaged a leading executive search firm to conduct a comprehensive internal and external search for a permanent CFO.

“I am honored to serve as Interim CFO of Aon and build on the strong foundation we have established across our Finance organization,” said Virani. “We will remain focused on financial discipline and thoughtful investment in the business as we continue to support Aon’s growth and create long-term shareholder value.”

Consistent with the update provided in its second quarter earnings release on July 29, 2026, Aon reaffirmed its full-year 2026 guidance.

About Aon
Aon plc (NYSE: AON) exists to shape decisions for the better — to protect and enrich the lives of people around the world. Through actionable analytic insight, globally integrated Risk Capital and Human Capital expertise, and locally relevant solutions, our colleagues provide clients in over 120 countries with the clarity and confidence to make better risk and people decisions that help protect and grow their businesses.

Follow Aon on LinkedIn, X, Facebook and Instagram. Stay up-to-date by visiting Aon’s newsroom and sign up for news alerts here.

Media Contact
mediainquiries@aon.com
Toll-free (U.S., Canada and Puerto Rico): +1 833 751 8114
International: +1 312 381 3024


HCLTech report reveals telecom leaders identify AI as top revenue driver, but only 25% ready to scale

NEW YORK and NOIDA, India, Aug. 17, 2026 /PRNewswire/ — HCLTech (NSE: HCLTECH) (BSE: HCLTECH), a leading global technology company, in partnership with Mobile World Live, a global telecom industry destination, today unveiled findings from its Telecom Pulse Survey Report, highlighting an execution gap between telecom leaders’ AI ambitions and their readiness to deploy AI-native, autonomous and cloud native services at scale.

Based on insights from nearly 200 senior executives across network operators, MVNOs, communication service providers (CSPs) and OEMs worldwide, the survey reveals that while 60% of telecom leaders see AI as a key driver of future revenue, only 25% believe their organizations are ready to operationalize AI at scale, preventing the essential shift from a telco to an AI-native TechCo. Persistent challenges around legacy infrastructure, cloud native modernization and skills continue to slow progress for the industry to be prepared for an AI-driven future.

The findings also underscore mounting pressure on traditional telecom business models. Nearly 70% of respondents agree that connectivity services are increasingly commoditized, reinforcing the need for differentiated digital services and platform-led growth. However, innovation velocity remains constrained, with nearly 80% launching fewer than five new digital products or services in the past year, pointing to ongoing challenges in product engineering and time-to-market acceleration.

Ecosystem collaboration emerged as a critical enabler, with nearly half of telecom leaders citing partnerships with hyperscalers, AI platform providers and software vendors as essential to accelerating innovation and monetization. Despite this shift, success metrics remain heavily skewed toward cost optimization, with operational efficiency continuing to dominate how AI and digital transformation outcomes are measured.

“The telecom industry is at a defining moment as AI transforms networks into intelligent, platform-driven ecosystems and this research recognizes that connectivity alone is no longer sufficient to sustain growth,” said Anil Ganjoo, Chief Growth Officer and Global Head of Telecom, Media and Technology at HCLTech. “HCLTech’s AI-intrinsic approach helps telcos accelerates the shift to become TechCos, further scaling innovation and embracing AI-native and autonomous operations.”

To read the full report, please visit: https://www.hcltech.com/en-us/telecom-pulse-survey-report.

About HCLTech

HCLTech is a global technology company, home to more than 223,000 people across 60 countries, delivering industry-leading capabilities centered around AI, digital, engineering, cloud and software, powered by a broad portfolio of technology services and products. We work with clients across all major verticals, providing industry solutions for Financial Services, Manufacturing, Life Sciences and Healthcare, Technology & Services, Semiconductor, Telecom and Media, Retail and CPG, Mobility and Public Services. Consolidated revenues as of 12 months ending June 2026 totaled $14.8 billion. To learn how we can supercharge progress for you, visit hcltech.com.

Mini storage provider Restore expands to Tsuen Wan, now with 40+ stores across Hong Kong

HONG KONG, Aug. 14, 2026 /PRNewswire/ — Restore, an innovative mini storage provider distinguished by clean, minimalist interiors, today announces 4 new store additions to its Hong Kong footprint. These include a brand-new store in Tsuen Wan, as well as capacity expansion to its existing facilities in Fo Tan, Kwai Chung, and Wong Chuk Hang. Pairing advanced smart storage features with a customer-first service philosophy, Restore is well known to leverage human-centric technology to deliver seamless, secure, and exceptionally convenient storage solutions.

First Tsuen Wan Store: A Different Mini Storage Experience Combining Clean Designs and Smart Tech


With its recent expansion to Tsuen Wan, Restore has grown its network to over 40 stores across the city, broadening its service reach to New Territories West to better serve local residents and businesses. To celebrate the opening of the new branch, the Tsuen Wan mini-storage is offering a grand opening promotion with average monthly fees from as low as HK$239 per month, available on a first-come, first-served basis.

In addition to expanding into new areas, Restore has concurrently expanded its existing branches in Fo Tan, Kwai Chung, and Wong Chuk Hang. By increasing its capacity in these three districts, Restore aims to offer a more diverse range of storage options to more effectively meet local customer needs, alongside its hallmark “0 prepayment, no lock-in” payment plans.

Smart tech for better customer convenience and protection

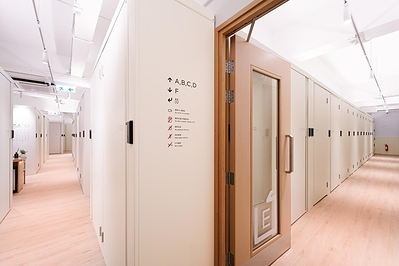
Restore stands out as one of the very few mini-storage companies adopting smart tech throughout all aspects of customer experience. Moving away from cumbersome move-in procedures of traditional storage facilities, Restore integrates human-centric technology into all facets of its facility design to significantly enhance both security and convenience for its users: 

  • Smart locks combined with mechanical ones for dual protection: Customers enjoy 24/7 card-free facility access via smartphones. Each storage unit also pairs an independent electronic lock with a mechanical locking latch, delivering a dual-layered security system that perfectly balances modern convenience with robust protection.
  • IoT systems for intelligent interior climate control:Restore’s facilities feature innovative IoT systems that track interior climate conditions. By replacing traditional manual inspections with data-driven management, Restore is able to effectively eliminate blind spots and response delays. This enables consistent facility climate control and therefore better peace of mind for customers.
  • Paperless online account management: Customers are now able to book storage units, sign contracts, and manage their accounts online at their convenience. This paperless process eliminates the need to visit a branch in person, saving both time and effort.

Clear focus on specialized facilities dedicated to storage

Restore offers arguably the widest range of locker sizes and specialized storage options in the market. These include wardrobe units, book-shelf units, and double-decker lockers. It also offers comprehensive moving services enabling seamless customer move-ins.

To prioritize customer privacy and security, Restore’s facilities are designed exclusively for storage purposes. By keeping its spaces dedicated solely to storage, Restore minimizes foot traffic and maintains a quiet and safe environment where customers can comfortably access and organize their belongings.

New store locations

Tsuen Wan Storage: 13/F (Reception), Bonsun Industrial Building, 364-366 Sha Tsui Road, Tsuen Wan, NT

Fo Tan Storage: Units 703 (Reception), 704, 401 and 402, Hopeful Factory Center, 10-16 Wo Shing Street, Fo Tan

Kwai Chung Storage: 6/F (Reception) & 4/F & 5/F And 8/F, Kinwah Factory Building, 136-138 Tai Lin Pai Road, Kwai Chung, Hong Kong

Wong Chuk Hang Storage:
1. Unit C,D, 2/F (Reception) & And Unit C, 8/F, Sing Teck Factory Building, 44 Wong Chuk Hang Road, Hong Kong
2. Unit B, 9/F (Reception) & Unit A, 1/F And Unit B, 8/F, Shui Ki Industrial Building, 18 Wong Chuk Hang Road, Hong Kong

For more information contact:
66338008
hello@restore.space 

Yeahka Limited to Report 2026 Interim Results on Thursday, August 27, 2026

HONG KONG, Aug. 17, 2026 /PRNewswire/ — Yeahka Limited (“Yeahka” or the “Company”, stock code: 9923.HK), a leading payment-based technology platform, today announced that it will report its unaudited financial results for the six months ended June 30, 2026.

Mr. Luke Liu, Founder and Chief Executive Officer, Mr. John Yao, Chief Financial Officer, Mr. Vincent Chan, Head of Corporate Development & Capital Markets, Mr. Derek Lai, General Manager of Finance & Board Secretary, and Mr. Arnold Yang, Senior Investor Relations Specialist, will host an earnings conference call on August 27, 2026 at 8:00 PM Beijing Time (8:00 AM U.S. Eastern Time).

Participation Method

  1. Please register by clicking the following registration link.
  2. Registered participants will be directed to the link with dial-in numbers and personal PIN code, or receive the information via the registered email. (For better call quality, participants from mainland China are encouraged to use this method.)
  3. Participants can also join the call by using the “Call Me” function. Choose the country code and enter their phone numbers then click “Call Me”. However, this function is not currently available in mainland China.
  4. Kindly register at least one working day before the event.
  5. Please dial in 15 minutes before the call is scheduled to begin and provide the personal PIN to join the call.
  6. Highly recommend Android users registering with Chrome or Firefox browsers, Windows users registering with ChromeFirefoxEdge browsers, iOS users registering with ChromeSafariWebView browsers, and macOS users registering with ChromeFirefoxSafariEdge browsers.

Registration link

https://register-conf.media-server.com/register/BI34ed41b418fa4ac89fa9f1227a24cea9

A replay of the conference call will be accessible the day after the conclusion of the live call, by following link:

https://www.yeahka.com/conferencecall

About YEAHKA LIMITED (Stock Code: 9923.HK)

Yeahka is a leading payment-based technology platform dedicated to creating value for merchants and consumers. We strive to expand an independent commercial digitalized ecosystem to (i) provide seamless, convenient and reliable payment services to both merchants and consumers through our one-stop payment services; (ii) enable merchants to better manage and drive business growth through our merchant solutions; and (iii) provide consumers with local lifestyle services of great value through our in-store e-commerce services.

For more information, please visit https://www.yeahka.com/


DG Display Showcase Helps Wongs Jewellers’ Manchester Store Reach UK Store Design of the Year Shortlist

Wongs Jewellers won two categories at the 2026 UK Jewellery Awards and was shortlisted for Store Design of the Year for its Manchester showroom, a project supported by DG Display Showcase.

GUANGZHOU, China, Aug. 17, 2026 /PRNewswire/ — DG Display Showcase, a customized display and retail-space solution provider with more than 27 years of industry experience, is highlighting its work with UK independent jeweller Wongs Jewellers following the retailer’s recognition at the 2026 UK Jewellery Awards, held in London on July 8. Wongs Jewellers won Bridal Jewellery Retailer of the Year and Jewellery Retailer of the Year (five stores or fewer), while its Manchester store was shortlisted for Store Design of the Year and its “Welded by Wongs” initiative was shortlisted for Marketing/Social Media Campaign or Collaboration of the Year (Retail).

The UK Jewellery Awards, presented by Retail Jeweller and now in their 34th year, are among the UK jewellery industry’s longest-running and most established honours. Wongs Jewellers was shortlisted in four categories overall and ultimately won two awards on the night. Notably, the Manchester store had been open for less than a year at the time of its Store Design of the Year shortlisting, having launched in late 2025 as Wongs’ first location in the city.

For DG Display Showcase, the recognition provides a project context for its work as an international retail-space partner. DG Display Showcase supported Wongs Jewellers’ Manchester store through a one-stop process covering brand understanding, spatial planning, custom showcase production, material coordination, lighting coordination, transportation and after-sales maintenance and repair. The project was developed to connect the retailer’s heritage with a contemporary customer environment rather than treating display fixtures as standalone furniture.

DG Display Showcase's Manchester Project Helps Wongs Jewellers Reach UK Store Design of the Year Shortlist
DG Display Showcase’s Manchester Project Helps Wongs Jewellers Reach UK Store Design of the Year Shortlist

Translating Jewellery Heritage Into Retail Space

Wongs Jewellers was founded in Liverpool in 1979. The business has stayed independent ever since, built around in-house craftsmanship, bespoke design and the kind of personal service chain retailers struggle to match. Founder Mr. Wong brought his Chinese heritage into the brand from the start, and it still shows up in the story the company tells and the pieces it sells. The workshop remains the heart of the operation. Across the North West of England, Wongs has become the name people think of for engagement rings and bridal jewellery.

For the Manchester store project, DG Display Showcase’s team worked with Wongs to understand the brand’s concept, history and spatial requirements before developing the display and interior solution. The design process considered brand heritage, customer circulation, product presentation and lighting atmosphere as connected elements of the retail experience, allowing display cases, counters and other fixtures to contribute to the wider visual identity of the store rather than function as separate furnishings.

The project included customized jewelry display showcases, premium counter displays, island displays, wall-mounted cabinets, an experience table and complementary retail fixtures, coordinated around Wongs’ individual design concept and material requirements rather than a standardized display package.

From Design Concept to International Delivery

The project also illustrates the practical demands of cross-border retail-space execution. Wongs Jewellers was introduced to DG Display Showcase through a customer referral and subsequently evaluated the company’s track record across the UK and other international markets — one of more than 200 customized projects DG Display Showcase completes globally each year from its Guangzhou manufacturing base. The two teams then worked through the design concept, materials and spatial details together before reaching agreement on the final solution.

For DG Display Showcase, the project required coordination across design, production and delivery while maintaining consistency between the approved concept and the finished fixtures. The company’s one-stop model is designed to keep these stages connected, extending beyond manufacturing to transportation and after-sales maintenance and repair — an approach intended to give overseas clients confidence when working with a manufacturing partner based in China.

“DG Display Showcase did more than understand our brand; they truly incorporated our brand philosophy into the space,” said Peter Wong, Managing Director of Wongs Jewellers. “Their professionalism and attention to detail helped give the store a distinctive character.”

The completed Manchester store became part of Wongs Jewellers’ wider recognition at the 2026 UK Jewellery Awards. In its own account of the ceremony, Wongs described its four shortlists and two wins as recognition of the creativity, customer experience and dedication of its wider team.

For DG Display Showcase, the project demonstrates how customized jewelry display manufacturing can be integrated with broader retail-space planning to help international jewellery brands express heritage, organize customer experiences and maintain consistency from design through delivery.

As luxury jewellery retailers place greater emphasis on the environment surrounding the product, DG Display Showcase continues to position its display expertise within a broader retail-space service model, combining design, engineering, manufacturing and project support for customized jewellery and luxury retail environments worldwide.

About DG Display Showcase

Founded in 1999 and headquartered in Guangzhou, China, DG Display Showcase develops customized display and retail-space solutions for jewellery, watches, perfume, museums and luxury retail environments. With more than 27 years of industry experience and more than 9,000 completed brand store projects worldwide, the company provides services spanning design, engineering, manufacturing, logistics, installation support and after-sales service. DG Display Showcase works with international clients on customized display systems and one-stop retail solutions developed around individual brand and project requirements.

Media Contact:

Official website: https://www.degreefurniture.com/
Company Name: DG Master of Display Showcase Co.,Ltd
Email: sales@degreefurniture.com
WhatsApp: +86 13922429233

XPPen Unveils Artist Ultra 14, Bringing Professional Drawing Performance to a More Portable Form Factor

LOS ANGELES, Aug. 17, 2026 /PRNewswire/ — XPPen, a global leader in digital art innovation, today unveiled the Artist Ultra 14, an Ultra Clear True Color Portable Drawing Display featuring a 2.8K OLED display, studio-grade color performance, the advanced X-Touch solution, and an ultra-slim design. Marking XPPen’s 21st anniversary, the Artist Ultra 14 combines flagship-level performance with exceptional portability, empowering creators to bring professional creativity wherever inspiration strikes.

XPPen Artist Ultra 14

“Creative workflows are becoming increasingly flexible, and creators today need tools that can adapt to the way they work,” said Brian Huang, Marketing Director at XPPen. “The Artist Ultra 14 is designed for professional creators seeking greater mobility without compromising visual quality or creative performance. It gives artists the freedom to create across different environments, expanding the possibilities of professional digital art.”

Professional-Grade Performance for Creative Excellence

The Artist Ultra 14 features a 2.8K OLED display with a True RGB Stripe pixel arrangement, native 10-bit color depth, and 99% Adobe RGB, 99% sRGB, and 99% Display P3 color gamut coverage, delivering exceptional clarity and true-to-life colors. With Delta E < 1 color accuracy and Calman Verified certification, it ensures reliable color precision for illustrations, animations, and other professional creative workflows.

With a 90Hz refresh rate and ultra-fast OLED response time, the Artist Ultra 14 minimizes motion blur and pen latency for smoother pen strokes and fluid playback. A 100,000:1 contrast ratio further enriches visual depth with finer shadow detail and more lifelike images. Its AG nano-etched glass surface helps reduce glare in bright environments, while the hybrid dimming solution minimizes flicker, helping to reduce eye strain during extended creative sessions.

XPPen Artist Ultra 14

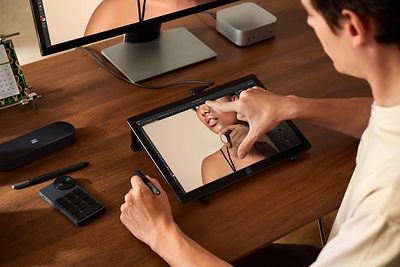
Beyond visual performance, the Artist Ultra 14 provides a natural and intuitive drawing experience with two X3 Pro series styli, each supporting 16K pressure levels and 60° tilt recognition for precise and responsive strokes. XPPen’s X-Touch solution further streamlines interaction with intuitive multi-finger gestures, customizable touch zones, and a floating shortcut menu, allowing creators to navigate and control their canvas with greater efficiency. The new virtual tablet mode lets creators use the stylus to control up to 10 screens with smooth cross-screen operation, making it easy to drag files and move windows seamlessly.

Built around the way creators work, the Artist Ultra 14 features two side buttons preset for the floating menu and virtual tablet interface, while remaining customizable to suit individual workflows. Together with the included ACK05 Shortcut Remote, foldable stand, and pen case, it provides a complete and efficient creative setup.

Ultra-Slim Design for Creative Mobility

At just 6mm thin and weighing only 720g, the Artist Ultra 14 is engineered for effortless portability for creators who work across multiple locations. Its 16:10 display provides more vertical workspace than traditional 16:9 screens, offering additional room for toolbars, timelines, and creative workflows. Combined with a floating etched glass design and an ultra-narrow 14.5mm bezel, the display maximizes every inch of space to deliver an immersive, near-borderless canvas that keeps creators focused on their work.

XPPen Artist Ultra 14

The slightly curved edges provide a more comfortable wrist-resting position during extended creative sessions, while the aluminum alloy back panel enhances heat dissipation and structural durability. For flexible creative setups, a single full-featured USB-C connection supports power, video, and data transmission through one cable, enabling a clean, clutter-free workspace and quick setup whether at home, in the studio, or on the go.

Price & Availability

The Artist Ultra 14 is available starting August 17, 2026, at a retail price of $699. Pricing and availability may vary by region. For more information, please visit: https://www.xp-pen.com/product/artist-ultra-14.html.

Zhibao Technology Inc. Announces Closing of $154.7 Million PIPE Financing


KEY HIGHLIGHTS

  • $154.7 Million PIPE Financing Closed: Zhibao Technology Inc. (NASDAQ: ZBAO) (“Zhibao,” “we,” or the “Company”) has closed its previously announced private investment in public equity (“PIPE”) financing for an aggregate purchase price of $154,700,000.
  • Streamlined Unit Structure: The transaction comprises 442,000,000 PIPE Units at $0.35 per Unit (each consisting of one Class A Ordinary Share and one two-year Warrant exercisable at $0.35 per share), with 395,678,152 Units delivered at closing and the remaining 46,321,848 Units to be delivered following shareholder approval.

SHANGHAI, CHINA – Newsfile Corp. – August 17, 2026 – Zhibao Technology Inc. (NASDAQ: ZBAO) (“Zhibao,” “we,” or the “Company”), a leading high-growth InsurTech company and pioneer of the 2B2C digital embedded insurance model in China, today announced the successful closing of its private placement financing pursuant to the Securities Purchase Agreement dated July 31, 2026, as amended on August 17, 2026 (the “Amended Securities Purchase Agreement”), with a syndicate of non-U.S. investors (the “Investors”) in reliance upon Regulation S under the Securities Act of 1933, as amended.

Pursuant to the Amended Securities Purchase Agreement, the Company has completed the PIPE financing for an aggregate of 442,000,000 PIPE Units at a purchase price of $0.35 per Unit, representing an aggregate purchase price of $154,700,000. The total purchase price has been fully satisfied and deemed paid in full at the closing through the contribution by the Investors of 2,380 Bitcoins to the Company’s designated wallet account, based on a reference price of $65,000 per Bitcoin determined with reference to prevailing market prices as of July 30, 2026.

Each PIPE Unit consists of one Class A Ordinary Share, par value $0.0001 per share, and one Warrant to purchase one Class A Ordinary Share at an exercise price of $0.35 per share, exercisable for a period of two years from the closing date. At the closing, the Company delivered 395,678,152 PIPE Units, with the remaining 46,321,848 PIPE Units to be delivered following shareholder approval, with no additional consideration required from any Investor.

Management Commentary

“The successful closing of this $154.7 million investment marks one of the most transformational moments in Zhibao’s 10-year history, strengthening our financial foundation and significantly accelerating our future growth potential,” said Mr. Botao Ma, Director of Zhibao. “Our teams and operating entities remain passionately committed to following through on our foundational vision: providing the world’s best digital insurance brokerage services to individuals and small- and medium-sized enterprises (SMEs) via our 2B2C business model and utilizing our Platform as a Service (PaaS).”

Mr. Ma continued: “I am very hopeful for the future as this investment solidifies our foundations and ensures we are even better positioned to deepen our scenario integrations, expand our AI-driven capabilities, and provide top-notch service to our existing and future clients. Our investors bring with them deep understanding and technical ability of cryptocurrency markets and Web3 infrastructure. I am confident that our combined might will unlock new and innovative synergies and scenarios that will extend our lead in the Insurtech space and unlock sustainable, long-term value for our shareholders, partners, and clients worldwide.”

Registration Rights

Under the terms of the transaction agreements, the Company will use commercially reasonable efforts to file a registration statement on Form F-1 with the U.S. Securities and Exchange Commission (SEC) within forty-five (45) calendar days following the July 31, 2026 effective date, covering the resale of the Class A Ordinary Shares, Warrant Shares, and certain management shares.

Hashtag: #ZhibaoTechnology

The issuer is solely responsible for the content of this announcement.

About Zhibao Technology Inc.

Zhibao Technology Inc. is a leading and high-growth InsurTech company primarily engaging in providing digital insurance brokerage services through its operating entities (“Zhibao China Group”) in China. 2B2C (“to-business-to-customer”) digital embedded insurance is the Company’s innovative business model, which Zhibao China Group pioneered in China. Zhibao China Group launched the first digital insurance brokerage platform in China in 2020, which is powered by their proprietary PaaS (“Platform as a Service”).

Zhibao has developed over 40 proprietary and innovative digital insurance solutions addressing different scenarios in a wide range of industries, including but not limited to travel, sports, logistics, utilities, and e-commerce. Zhibao acquires and analyzes customer data, utilizes big data and AI technology to continually iterate and enhance its digital insurance solutions. This iterative process, in addition to continually improving its digital insurance solutions, will keep it abreast of the new trends and customer preferences in the market. For more information, please visit: .

Forward-Looking Statements

Statements in this press release about future expectations, plans and prospects, as well as any other statements regarding matters that are not historical facts, may constitute “forward-looking statements” within the meaning of The Private Securities Litigation Reform Act of 1995. The words “anticipate,” “believe,” “continue,” “could,” “estimate,” “expect,” “intend,” “may,” “plan,” “is/are likely to,” “potential,” “predict,” “project,” “should,” “target,” “will,” “would” and similar expressions are intended to identify forward-looking statements, although not all forward-looking statements contain these identifying words. The Company undertakes no obligation to update or revise publicly any forward-looking statements to reflect subsequent occurring events or circumstances, or changes in its expectations that arise after the date hereof, except as may be required by law. These statements are subject to uncertainties and risks including, but not limited to, the uncertainties related to market conditions, the receipt of shareholder approval, the satisfaction of post-closing covenants, and other factors discussed in the “Risk Factors” section of our annual reports on Form 20-F (as amended) and registration statements on Form F-1 (as amended) that have been filed or will be filed from time to time with the SEC. Although the Company believes that the expectations expressed in these forward-looking statements are reasonable, it cannot assure you that such expectations will turn out to be correct, and the Company cautions investors that actual results may differ materially from the anticipated results and encourages investors to review other factors that may affect its future results in the Company’s registration statements and other filings with the SEC. Additional factors are discussed in the Company’s filings with the SEC, which are available for review at .

Investor Relations Contact

Zhibao Technology Inc.
Investor Relations
Office Email:

Skyline Corporate Communications Group, LLC
Scott Powell, President
Avenues Tower
1177 Avenue of the Americas, 5th floor
New York, NY 10036
Office: (646) 893-5835
Email: