Home Blog Page 248

Classys Nears 50,000 Devices Sold Globally as Full-Lineup Growth Accelerates

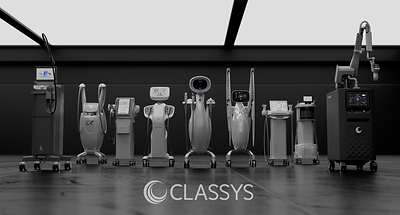
SEOUL, South Korea, Aug. 25, 2026 /PRNewswire/ — Classys Inc. (KOSDAQ: 214150) expects device sales worldwide to surpass 50,000 units this year.


As of the end of June, Classys had a cumulative global installed base of more than 22,000 units for its flagship HIFU line and more than 4,000 units for its MRF line. Its MNRF and dermabrasion product lines have also each surpassed 6,000 cumulative global installations. Classys plans to leverage this established footprint to introduce next-generation platforms and create additional avenues for growth through the global rollout of Quadessy and the planned European launch of Viclara later this year.

A well-established sales infrastructure underpins this global expansion. The domestic Korean market, which accounts for approximately 25% of total revenue, serves as a key test market for validating new products and clinical treatment protocols while strengthening the company’s global brand competitiveness. The ability to introduce next-generation devices through this existing distribution infrastructure is expected to serve as a key driver of future growth.

This expanding commercial foundation continues to translate into strong financial performance. Classys reported consolidated revenue of KRW 192.7 billion for the first half of the year, representing a 20% year-over-year increase. Even excluding the impact of consolidating its Brazilian subsidiary, growth across existing international markets remained robust. Excluding shipments from Classys headquarters to its Brazilian subsidiary, 1H26 export sales increased 29% year over year, demonstrating that demand for Classys products continues to grow across its existing global markets beyond the impact of the transition to direct sales in Brazil.

In Europe, market diversification delivered tangible results, driven by expansion into new countries—including the UK, Sweden, the Netherlands, Finland, Hungary, and Bulgaria—as well as sales growth in existing European markets. Despite continued investments in global commercialization and market expansion, Classys maintained strong profitability, achieving a standalone operating margin of 50.8% in the first half of the year.

The expansion of the installed base is also significant, as it supports recurring consumables revenue and the adoption of multi-device combination treatments. In the first half of the year, consumables revenue reached KRW 80.2 billion, up 5.3% year over year and 52.7% from the first half of 2024. As cumulative global device installations continue to grow, the foundation for stable, recurring consumables revenue is expanding accordingly.

View Full Article: https://www.prnewswire.com/news-releases/classys-nears-50-000-devices-sold-globally-as-full-lineup-growth-accelerates-302858977

Kehua Launches New-Generation 40kW & 80kW VPFC and Power Modules to Drive High-Efficiency, Reliable EV Charging Infrastructure

Power Modules Evolve for the Era of Ultra-Fast Charging

SEOUL, South Korea, Aug. 25, 2026 /PRNewswire/ — As 800V platforms, electric heavy-duty vehicles, and megawatt charging technologies accelerate, EV charging infrastructure is evolving toward higher power, greater efficiency, and enhanced reliability. To meet the growing demand for commercial fleets, and future megawatt-scale applications, Kehua has launched its new-generation 40kW power module and 80kW VPFC high-power module.


New-Generation 40kW Module: Higher Efficiency, Greater Power Density

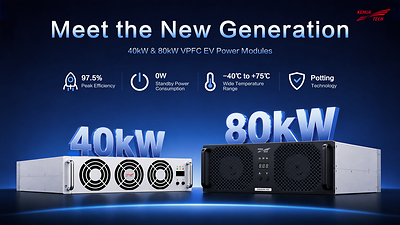
As a core power conversion unit in DC fast chargers, the 40kW module is widely used in public charging stations and commercial charging sites. The upgraded Kehua 40kW module delivers up to 97.5% peak efficiency and 97% weighted charging efficiency, reducing conversion losses and improving energy utilization. Its volume is approximately 7.5% smaller than the previous generation, enabling higher power density and more flexible system integration. Standby power consumption is reduced from 7.5W to 0W, with zero reactive power consumption, minimizing idle energy losses and improving overall system efficiency.

All-New 80kW VPFC Module: Built for High-Power and Megawatt Charging

Designed for ultra-fast and megawatt-scale charging applications, the all-new 80kW VPFC module features SiC devices, achieving up to 97.5% peak efficiency and 97% weighted charging efficiency. It supports 0W standby and zero reactive power consumption, while VPFC technology helps optimize power quality. The module operates from -40°C to +75°C and maintains full-power output at 55°C without derating. It also meets EMC Class B and IEC 61851-23:2023, making it suitable for highway fast-charging stations, commercial charging hubs, and fleet charging depots. With dual-side potting and silent operation down to 55dB, it delivers reliable performance in demanding environments.

Powering the Next Generation of EV Infrastructure

Backed by 38 years of power electronics expertise, Kehua offers a comprehensive portfolio spanning power modules, DC chargers, high-power charging systems, megawatt charging solutions, and integrated PV-ESS-charging solutions. Kehua continues to advance high-efficiency, high-power-density, and high-reliability technologies to support the global transition to electric mobility.

CONTACT: Cherry Li, cherry@kehuasz.com

Binance TradFi Perpetuals Gain Greater Traction as Multi-Asset Strategy Takes Hold

10 of 15 perpetual futures on Binance are TradFi perpetuals ranging from equities to commodities

ISLAMABAD, Aug. 25, 2026 /PRNewswire/ — Binance’s push to bring traditional finance (TradFi) assets onto its crypto-native platform is showing clear signs of traction, according to real-time derivatives data. A snapshot of the top 15 perpetual contracts on Binance by 24-hour volume shows that roughly two-thirds are now linked to traditional assets (equities, ETFs, and commodities) with the crypto perpetuals led by BTC, ETH and SOL.

Binance TradFi Perpetuals Gain Greater Traction as Multi-Asset Strategy Takes Hold

The top 15 list is led by SANDUSDT (SanDisk) perpetual contract with ~$6.87 bn 24-hour trading volume on Binance as of 19 August, 9:00am UTC. This was approximately 22% of the 24-hour SanDisk trading volume on Nasdaq.[1]

The other top perpetual contracts by current trading volume includes other single-name equities, equity-linked products, and commodity contracts such as XAGUSDT (Silver) (~$826 mil trading vol on Binance), alongside established crypto perps.

“The shift validates Binance’s stated mission to make its platform a multi-asset financial super app where users can access crypto and traditional asset classes within a single account. By offering USDT-margined perpetual contracts on ETFs, commodities and more, Binance has effectively extended crypto-style round-the-clock trading to assets that were previously confined to traditional market hours,” said Shunyet Jan, Head of Exchange and Trading at Binance.

Recent industry data supports this trend. Weekly stock-linked perpetual volume on centralized exchanges has surged roughly 79x since the start of 2026, with Binance identified as the dominant venue for equity perps. In July alone, Binance accounted for about 76% of equity perpetual volume across tracked exchanges, highlighting its central role in the convergence of crypto and TradFi trading.

Disclaimer: Products and services referred to here may not be available in your region. Digital asset prices can be volatile. The value of your investment may go down or up and you may not get back the amount invested. You are solely responsible for your investment decisions and Binance is not liable for any losses you may incur. TradFi Perps are subject to high market risk and price volatility (particularly outside traditional market hours). You may be called upon at short notice to make additional margin deposits or interest payments. If the required margin deposits or interest payments are not made within the prescribed time, your collateral may be liquidated. Moreover, you will remain liable for any resulting deficit in your account and interest charged on your account. All of your margin balance may be liquidated in the event of adverse price movement. Past performance is not a reliable predictor of future performance. TradFi Perps do not represent ownership of the relevant underlying asset. Before trading, you should make an independent assessment of the appropriateness of the transaction in light of your own objectives and circumstances, including the risks and potential benefits. Consult your own advisers, where appropriate. This information should not be construed as financial or investment advice. TradFi Perps are not associated or affiliated with, or sponsored or endorsed by, the issuer of the relevant underlying shares or the exchange on which they are listed. Futures trading is restricted in certain countries and to certain users. This content is not intended for users/countries to which restrictions apply. To learn more about how to protect yourself, visit our Responsible Trading page. For more information, see our Terms of Use, Clearing Rules, Clearing Procedures, Contract Specifications and Risk Warning.

About Binance

Binance is a leading global blockchain ecosystem behind the world’s largest cryptocurrency exchange by trading volume and registered users. Binance is trusted by more than 320 million people in 100+ countries for its industry-leading security, transparency, trading engine speed, protections for investors, and unmatched portfolio of digital asset products and offerings from trading and finance to education, research, social good, payments, institutional services, and Web3 features. Binance is devoted to building an inclusive crypto ecosystem to increase the freedom of money and financial access for people around the world with crypto as the fundamental means. For more information, visit: https://www.binance.com.

[1] This is an approximation of Nasdaq SNDK trading volume. Nasdaq provides data for share volume, the approximation of dollar volume is based on shares × price https://www.nasdaq.com/market-activity/stocks/sndk/historical

https://nasdaqtrader.com/Trader.aspx?id=DailyMarketSummaryDefs 

Laos Economy Grows 5% in Year’s First Half, Government Holds to 6% Target

This photo is used for representational purpose only.

Laos’ economy expanded 5 percent in the first half of 2026, helped by a strong tourism season and growth in services, but slowed in the second quarter as the government works to meet its 6 percent target for the year.

Growth reached 5.5 percent in the first quarter before easing to 4.6 percent in the second, according to figures released by the Ministry of Finance at its mid-year review meeting on 24 August.

Tourism has been one of the brighter spots. Nearly 2.6 million international visitors arrived in Laos during the first six months of the year, a 9.9 percent increase from the same period in 2025. The government is hoping to attract between 5 million and 6 million visitors by the end of the year.

The services sector is expected to grow 7.1 percent this year, making it the fastest-growing part of the economy, followed by industry at 5.7 percent and agriculture at 4.1 percent.

The government collected LAK 44,956 billion (USD 2.01 billion) in revenue during the first half, up 19 percent from the same period last year and putting it more than halfway toward its annual target.

For Laos, however, the 6 percent growth goal is about more than this year’s economic performance. The country is preparing to graduate from the United Nations’ Least Developed Country category at the end of 2026, while the government has set a broader goal of maintaining at least 6 percent annual growth through 2030.

Officials project that GDP per capita will reach USD 3,104 and gross national income per capita USD 2,914 by 2030.

The first-half figures put Laos behind several of its regional neighbors.

Vietnam’s economy grew 8.2 percent during the same period, while Singapore, Malaysia and Indonesia recorded growth of 6.1 percent, 5.7 percent and 5.5 percent, respectively. Thailand and the Philippines grew more slowly, at 2.4 percent and 2.6 percent.

The Finance Ministry said the economy generated LAK 199,987 billion (USD 8.92 billion) in the first six months, equivalent to 48 percent of the government’s full-year output target of LAK 417,523 billion (USD 18.62 billion).

Classys Nears 50,000 Devices Sold Globally as Full-Lineup Growth Accelerates

  • Expands global portfolio beyond HIFU and MRF to include MNRF, laser, and dermabrasion devices, strengthening its medium- to long-term growth foundation
  • 1H26 Exports, excluding shipments to its Brazilian subsidiary, grew 29% year over year, underscoring continued growth across global markets

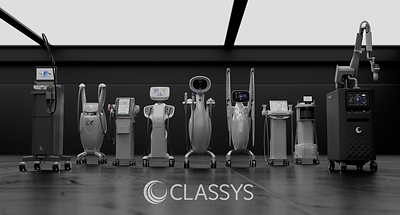
SEOUL, South Korea, Aug. 25, 2026 /PRNewswire/ — Classys Inc. (KOSDAQ: 214150), a global medical aesthetics company, announced today that, supported by its robust global commercial infrastructure, it expects device sales worldwide to surpass 50,000 units this year.


This milestone reflects the company’s successful expansion into new device categories, including microneedle radiofrequency (MNRF) and laser systems, beyond its traditional core portfolio of high-intensity focused ultrasound (HIFU) and monopolar radiofrequency (MRF). By offering a comprehensive aesthetic portfolio designed to address diverse customer needs and leveraging its large global installed base, Classys is strengthening the foundation for sustainable medium- to long-term growth.

As of the end of June, Classys had a cumulative global installed base of more than 22,000 units for its flagship HIFU line and more than 4,000 units for its MRF line. Its MNRF and dermabrasion product lines have also each surpassed 6,000 cumulative global installations. Classys plans to leverage this established footprint to introduce next-generation platforms and create additional avenues for growth through the global rollout of Quadessy and the planned European launch of Viclara later this year.

A well-established sales infrastructure underpins this global expansion. The domestic Korean market, which accounts for approximately 25% of total revenue, serves as a key test market for validating new products and clinical treatment protocols while strengthening the company’s global brand competitiveness. Internationally, Classys has established end-to-end commercial capabilities—from initial market entry and product launches to procedure adoption—supported by a global distributor network, key opinion leaders (KOLs), and a broad network of clinic customers. The ability to introduce next-generation devices through this existing distribution infrastructure is expected to serve as a key driver of future growth.

This expanding commercial foundation continues to translate into strong financial performance. Classys reported consolidated revenue of KRW 192.7 billion for the first half of the year, representing a 20% year-over-year increase. Even excluding the impact of consolidating its Brazilian subsidiary, growth across existing international markets remained robust. Excluding shipments from Classys headquarters to its Brazilian subsidiary, 1H26 export sales increased 29% year over year, demonstrating that demand for Classys products continues to grow across its existing global markets beyond the impact of the transition to direct sales in Brazil.

In Europe, market diversification delivered tangible results, driven by expansion into new countries—including the UK, Sweden, the Netherlands, Finland, Hungary, and Bulgaria—as well as sales growth in existing European markets. Despite continued investments in global commercialization and market expansion, Classys maintained strong profitability, achieving a standalone operating margin of 50.8% in the first half of the year.

The expansion of the installed base is also significant, as it supports recurring consumables revenue and the adoption of multi-device combination treatments. In the first half of the year, consumables revenue reached KRW 80.2 billion, up 5.3% year over year and 52.7% from the first half of 2024. As cumulative global device installations continue to grow, the foundation for stable, recurring consumables revenue is expanding accordingly.

Portfolio diversification through new products is also accelerating, particularly in the dermabrasion category. The previous-generation Aquapure has already built a track record of global sales and established customer relationships, helping to lower barriers to market entry. Set to launch in Europe under the brand name “Viclara” by the end of this year, Classys plans to drive cross-selling and increase utilization by leveraging its existing HIFU, MRF, and MNRF customer base and global distribution network.

Moving forward, Classys plans to expand device distribution in line with regional regulatory approvals and launch timelines, while introducing combination treatment protocols to existing customers to increase device utilization and revenue per customer. The company will also intensify localized marketing efforts through global medical congresses, clinical education programs, and KOL collaborations tailored to regional skin characteristics, treatment preferences, and practitioner needs.

“The continued growth in cumulative global device sales demonstrates that Classys is steadily expanding its reach among medical professionals and patients worldwide,” said Yugene Choi, Head of Investor Relations at Classys. “By continuously introducing new platforms and clinical treatment protocols to our established installed base, distribution channels, and clinical networks, we aim to drive continued growth in both device and consumables sales and sustain our long-term growth in the global medical aesthetics market.”

ISCA and GDUFS Strengthen Singapore–Guangdong Talent Links

Partnership creates new pathways for accountancy students in Guangdong to pursue the Singapore Chartered Accountant Qualification and gain professional exposure in Singapore


SINGAPORE – Media OutReach Newswire – 25 August 2026 – The Institute of Singapore Chartered Accountants (ISCA) and Guangdong University of Foreign Studies (GDUFS) have signed a Memorandum of Understanding (MOU) to strengthen Singapore–Guangdong collaboration in accountancy education and talent development, creating greater opportunities for GDUFS students in Guangdong to connect with the accountancy profession and pursue international professional pathways.

The MOU was signed in Singapore in conjunction with the 16th Singapore-Guangdong Collaboration Council (SGCC) Meeting, underscoring the strategic significance of the partnership and the growing links between Singapore and Guangdong in education, professional services and talent development.

Under the partnership, GDUFS’ Accounting, Auditing and Financial Management programmes will apply for accreditation under the Singapore Chartered Accountant Qualification (SCAQ) programme. Once accredited, graduates of these programmes will be eligible for fee waivers relating to five SCAQ Foundation Programme modules, providing a more streamlined pathway towards attaining the Chartered Accountant of Singapore, or CA (Singapore) designation upon fulfilling the remaining SCAQ requirements.

The partnership will also provide GDUFS students with opportunities to connect with ISCA and the wider accountancy profession, which includes industry and professional networks, events and activities. Students will have access to relevant ISCA membership opportunities and the relevant benefits, while those pursuing the SCAQ pathway will receive study support and opportunities such as internship and job-matching recommendations, SCAQ scholarships and access to ISCA’s publications.

Developing Internationally Connected Accountancy Talent

The partnership reflects ISCA and GDUFS’s shared commitment to developing the next generation of accountancy professionals with the capabilities, professional networks and international exposure to contribute across markets.

The two institutions will also collaborate on professional learning and development, including guest lectures, workshops and seminars for GDUFS faculty, students and alumni, as well as access to ISCA publications and online resources. Continuous professional development collaboration via ISCA’s specialisation programmes in financial forensics, sustainability and subscription-based online learning platforms for accounting professionals will ensure GDUFS graduates remain updated on evolving industry standards and best practices.

ISCA President Mr Lee Boon Teck said: “Our partnership with GDUFS is about building stronger links between Singapore and Guangdong in accountancy education and talent development. By connecting students with professional pathways, networks and industry exposure and opportunities in Singapore, we hope to equip the next generation of accountancy professionals with the capabilities and international exposure ready to contribute in an increasingly interconnected business environment.”

Professor Yu Pengyi, Dean of the School of Accountancy at GDUFS, said: “This partnership with ISCA marks an important milestone in our internationalisation journey, creating new professional pathways and opportunities for our students. By combining our strengths in language and accounting education with ISCA’s professional expertise and networks, we look forward to developing globally minded accounting professionals who can contribute across markets.”

The five-year partnership provides a framework for ISCA and GDUFS to further develop cooperation in accountancy education, professional development and engagement with the accountancy profession.
Hashtag: #ISCA #CharteredAccountants #DifferenceMakers #Accounting #Accountancy #MOU #GDUFS

The issuer is solely responsible for the content of this announcement.

Institute of Singapore Chartered Accountants (ISCA)

The Institute of Singapore Chartered Accountants (ISCA) is the national accountancy body of Singapore. Established in 1963, ISCA administers the Singapore Chartered Accountant Qualification programme and is the designated entity by the Singapore Ministry of Finance to confer the Chartered Accountant of Singapore [CA (Singapore)] designation.

ISCA supports over 46,000 members across industries in Singapore and globally, with members in more than 40 countries. With a growing international presence, ISCA has 12 overseas chapters, 7 offices across 10 countries and a network of over 150 strategic partners, strengthening professional connections and opportunities across borders. ISCA is also a member of Chartered Accountants Worldwide, a global network representing more than 1.8 million Chartered Accountants and students across over 190 countries.

ISCA advances professional development and lifelong learning through ISCA Academy, its training arm and drives community impact through ISCA Cares, its charity arm.

For more information, visit .

Empyrion Digital Closes Financing for TW1 Data Centre in Taiwan


TAIPEI, TAIWAN & SINGAPORE – Media OutReach Newswire – 25 August 2026 – Empyrion Digital has closed a significant financial package for TW1, its 7MW data centre in Neihu, Taipei, with E.Sun Bank.

The financing is a key milestone for TW1 Empyrion Digital’s strategy of developing high-quality digital infrastructure across Asia’s key markets.

Located in Neihu, Taipei, TW1 is a carrier-neutral colocation facility designed to meet Taiwan’s growing demand for reliable, scalable and well-connected digital infrastructure. The facility will offer colocation solutions to enterprise, cloud and digital infrastructure customers with the capacity and connectivity to support AI deployment alongside their evolving compute needs.

Teruo Iwamoto, Chief Financial Officer of Empyrion Digital, said:

“Closing this financing is another important step in our growth in Taiwan. It reflects the strong fundamentals of TW1 and our financing partner’s confidence in the project and Taiwan’s broader digital infrastructure market. We thank E.Sun Bank, our advisers and all our partners for their support throughout the financing process.”

E.Sun Bank, said:

E.Sun Bank is pleased to support Empyrion Digital in the financing of TW1. As AI, cloud computing and digital services continue to grow, resilient and high-quality digital infrastructure is becoming increasingly important to Taiwan’s digital economy. E.Sun Bank is committed to leveraging its financial expertise to support quality infrastructure projects with long-term development potential. We look forward to building a strong partnership with Empyrion Digital as TW1 progresses.”

The financing underpins the continued development of TW1 as Empyrion Digital advances its data centre portfolio across Asia. The company remains focused on delivering strategically located, high-quality colocation infrastructure to meet the region’s growing demand for AI, cloud, connectivity and data-intensive applications.

Empyrion Digital thanks E.Sun Bank, its advisers and the wider project team for their contributions to the successful completion of this financing.

Hashtag: #EmpyrionDigital


The issuer is solely responsible for the content of this announcement.

About Empyrion Digital

Empyrion Digital is a next-generation digital infrastructure platform committed to sustainable practices and operational excellence. Green-by-design, we develop and operate scalable, carrier-neutral AI-capable data centres for hyperscale and enterprise customers across Asia.

Headquartered in Singapore, Empyrion Digital is a portfolio company of Seraya Partners, a leading Asia infrastructure fund with USD 2.7 billion of assets under management.

For more information, visit www.empyriondigital.com.

Gorilla Technology H1 Revenue Surges 99% to US$78.4 Million; Raises FY2026 Revenue Outlook to at Least US$200 Million

London, United Kingdom – Newsfile Corp. – August 24, 2026 – Gorilla Technology Group Inc. (NASDAQ: GRRR) (“Gorilla” or the “Company”), a global solution provider in Security Intelligence, Network Intelligence, Business Intelligence, IoT technology and data centres, today announced its unaudited financial results for the six months ended June 30, 2026.

Gorilla delivered a significant acceleration in revenue and a marked sequential improvement in reported operating performance during the second quarter. The outperformance was principally driven by earlier-than-anticipated delivery across multiple contracted customer programmes, enabling the Company to recognize the associated revenue ahead of its original expectations. This was complemented by continued execution across Gorilla’s broader portfolio.

Financial highlights

  • H1 revenue nearly doubled: Revenue increased 99.3% to approximately US$78.4 million, compared with US$39.3 million in H1 2025. Growth was driven by the scaling of Gorilla’s AI infrastructure and data-centre programmes, alongside continued delivery across its security intelligence, network intelligence and smart-city operations, including Egypt, Taiwan and Thailand.
  • Reported and adjusted operating performance: Gorilla reported an IFRS operating loss of approximately US$47.2 million for H1 2026, compared with US$9.1 million in H1 2025. The 2026 results included approximately US$25.4 million of stock-based compensation expense, US$4.0 million of downward fair-value measurement effects, US$2.0 million of debt-transaction costs and US$0.3 million of acquisition-related expenses. Adjusted EBITDA was a loss of approximately US$14.6 million, compared with adjusted EBITDA of approximately US$6.2 million in H1 2025.
  • Reported and adjusted net result: Gorilla reported an IFRS net loss of approximately US$46.9 million for H1 2026, compared with US$8.5 million in H1 2025. Adjusted net loss was approximately US$15.6 million, or US$0.58 per share, compared with adjusted net income of approximately US$6.3 million, or US$0.32 per share, in H1 2025.
  • Operating cash efficiency improved year on year: Net cash used in operating activities declined by approximately US$8.2 million, or 65.3%, from US$12.5 million in H1 2025 to US$4.3 million in H1 2026.
  • Cash position strengthened: Cash increased by approximately US$79.8 million during H1, driven principally by financing inflows and supported by customer collections. Gorilla closed the period with approximately US$179.4 million in cash.
  • Infrastructure investment accelerated: Gorilla deployed approximately US$14.1 million during H1 for the acquisition of property and equipment, including capital advances and project work-in-progress. Property and equipment, including capital work-in-progress, reached approximately US$29.4 million at June 30, 2026.

Comparative financial performance

Financial measure H1 2026 H1 2025
Operating loss (IFRS) US$(47.2)m US$(9.1)m
EBITDA loss (non-IFRS) US$(46.4)m US$(8.4)m
Adjusted EBITDA (non-IFRS) US$(14.6)m US$6.2m
Net loss (IFRS) US$(46.9)m US$(8.5)m
Adjusted net income (loss) (non-IFRS) US$(15.6)m US$6.3m
Diluted loss per share (IFRS) US$(1.74) US$(0.43)
Adjusted diluted earnings (loss) per share (non-IFRS) US$(0.58) US$0.30

Statement from Jay Chandan, Chairman and Chief Executive Officer

“This is the clearest evidence yet that Gorilla has entered a different phase of scale,” said Jay Chandan, Chairman & CEO.

“In one year we managed to nearly double our first half revenue to US$78.4 million. Our second quarter revenue increased 78% sequentially and 138% year-on-year to US$50.1 million, while our reported operating loss narrowed by approximately 85% compared with Q1.

The progression matters. In the first half, we absorbed a significant share-based compensation charge largely tied to services rendered prior to 2025 and other significant accounting effects. With their removal during the first half of 2026, we are poised for an improvement in operating results.

We are now converting years of preparation into delivery at scale. We are investing in hardware, infrastructure, people and execution capacity because we see a substantial opportunity ahead of us. Infrastructure cannot be switched on like a tap. Equipment must be procured, installed, commissioned and integrated. Customers must migrate workloads and utilisation must then progress toward steady-state levels.

That investment is happening now. During H1, Gorilla deployed approximately US$14.1 million for the acquisition of property and equipment, while property and equipment, including capital work-in-progress, reached approximately US$29.4 million at June 30, 2026. We are building the capacity and delivery platform required to support a much larger business. Our priorities for the remainder of 2026 are unambiguous: bring more capacity into service, increase utilisation, expand the workloads we deliver for existing customers and convert additional demand into revenue. We are on track to meet previously announced delivery timelines. The objective is not simply to deploy hardware. It is to build long-term customer relationships around infrastructure, compute and associated services.”

Statement from Bruce Bower, Chief Financial Officer

“The first-half results demonstrate both the scale of Gorilla’s investment and the improvement in cash efficiency,” said Bruce Bower, Chief Financial Officer.

“On an IFRS basis, Gorilla reported an operating loss of approximately US$47.2 million and a net loss of approximately US$46.9 million. Adjusted EBITDA was a loss of approximately US$14.6 million, and adjusted net loss was approximately US$15.6 million. The reconciliation included below provides investors with the individual adjustments and their respective treatment.”

“H1 revenue increased 99.3%, while net cash used in operating activities declined by approximately US$8.2 million, or 65.3%, to US$4.3 million. Put simply, we nearly doubled revenue while reducing operating cash usage from 31.8% to 5.5% of revenue.”

“This improvement was achieved while Gorilla deployed approximately US$14.1 million during H1 for the acquisition of property and equipment. Cash deployment may increase as we fund equipment purchases, project-related deposits, construction and commissioning activities. These expenditures represent the planned conversion of liquidity into productive infrastructure and delivery capacity intended to support future revenue-not a weakening of our underlying operating discipline.”

“The Company recorded an overall increase in cash of approximately US$79.8 million during H1, driven principally by financing inflows and supported by customer collections. We closed the period with approximately US$179.4 million in cash. As this liquidity is deployed, our cash balance may fluctuate as we fund existing projects and build the capacity required to support future revenue.”

“We are investing ahead of the revenue and utilisation curve, but we are doing so from a position of substantial liquidity. Our priorities remain disciplined capital allocation, project execution, improved utilisation and the conversion of infrastructure investment into sustainable revenue and cash flow.”

Infrastructure investment and the path to steady state

Gorilla’s current financial profile reflects the deliberate acceleration of its AI infrastructure strategy.

Infrastructure projects require capital to be deployed before their full revenue and margin potential can be realized. Hardware procurement is followed by installation, commissioning, integration, customer onboarding, workload migration and utilisation growth. Consequently, expenditure and accounting recognition may precede steady-state revenue generation.

The Company’s priorities for the second half of 2026 are to:

  • Bring additional infrastructure capacity into service.
  • Increase utilisation across existing deployments.
  • Expand the range of workloads delivered for existing customers.
  • Onboard new customers and convert additional demand.
  • Develop a broader revenue mix across infrastructure, compute and associated services.
  • Maintain disciplined capital allocation and liquidity management while investing for growth.

Financial Outlook

Gorilla is increasing its Q3 2026 revenue planning range to approximately US$48 million to US$50 million, compared with its previous planning range of US$36 million to US$40 million. Gorilla now expects revenue for the 2026 fiscal year of at least US$200 million, raising the minimum from its previously announced range of US$160 million to US$200 million.

2027 guidance

Gorilla is targeting a revenue range of US$450 to US$500 million in 2027, with substantial gross margin improvement.

This objective is supported by the infrastructure being installed in connection with previously disclosed projects, the opportunity to increase utilisation, the potential to expand existing customer relationships and Gorilla’s pipeline of additional demand. The objective remains subject to execution, customer demand, deployment schedules and prevailing market conditions.

Financials

Gorilla Technology Group Inc. and Subsidiaries
Condensed Interim Consolidated Balance Sheets
(Expressed in United States dollars)

As of
June 30, 2026 December 31, 2025
Items (Unaudited and Unreviewed)
Assets
Current assets
Cash and cash equivalents $ 179,361,146 $ 99,532,115
Restricted deposits 45,933 5,298,442
Accounts receivable, net and contract assets 145,301,296 111,994,621
Other current assets 20,045,479 17,221,988
Total current assets 344,753,854 234,047,166
Non-current assets
Property and equipment, net 29,441,217 15,749,411
Right-of-use assets 1,055,377 1,091,526
Goodwill and other intangible assets 3,360,361 2,432,278
Deferred tax assets, net 5,201,078 11,938,173
Other non-current assets 6,072,360 6,624,980
Total non-current assets 45,130,393 37,836,368
Total assets $ 389,884,247 $ 271,883,534
Liabilities and Equity
Liabilities
Current liabilities
Borrowings $ 10,221,241 $ 10,391,379
Derivative liability 48,200,000 –
Accounts and other payables 91,708,655 46,042,759
Contract liabilities 1,523,600 1,305,644
Income tax liabilities 1,378,280 11,588,564
Other current liabilities 899,764 951,094
Total current liabilities 153,931,540 70,279,440
Non-current liabilities
Long-term borrowings 63,025,823 3,404,363
Deferred tax liabilities 827,315 652,782
Other non-current liabilities 1,246,054 1,467,110
Total non-current liabilities 65,099,192 5,524,255
Total liabilities 219,030,732 75,803,695
Equity
Share capital 27,664 26,356
Treasury shares at cost (5,285,347) (2,105,274)
Other equity 176,111,198 198,158,757
Total equity 170,853,515 196,079,839
Total liabilities and equity $ 389,884,247 $ 271,883,534

Gorilla Technology Group Inc. and Subsidiaries
Condensed Interim Consolidated Statements of Comprehensive Loss
(Expressed in United States dollars)

Six Months Ended June 30,
2026 2025
Items (Unaudited and Unreviewed)
Revenues $ 78,361,225 $ 39,325,839
Cost of revenues (74,516,947) (25,877,004)
Gross profit 3,844,278 13,448,835
Operating expenses:
Foreign currency exchange losses, net (2,594,853) (11,552,001)
Stock-based compensation expenses (25,426,746) (472,642)
Other operating expenses (23,003,400) (10,494,639)
Total operating expenses (51,024,999) (22,519,282)
Operating loss (47,180,721) (9,070,447)
Net loss (46,893,714) (8,503,060)
Other comprehensive income (loss), net of tax (748,898) 1,057,235
Total comprehensive loss $ (47,642,612) $ (7,445,825)
Basic and diluted loss per share $ (1.74) $ (0.43)

Gorilla Technology Group Inc. and Subsidiaries
Condensed Interim Consolidated Statements of Cash Flows
(Expressed in United States dollars)

Six Months Ended June 30,
2026 2025
(Unaudited and Unreviewed)
Net cash used in operating activities $ (4,339,769) $ (12,518,511)
Net cash used in investing activities (12,675,421) (4,852,819)
Net cash flows from financing activities 98,511,610 5,334,134
Effect of foreign exchange rate changes on cash and cash equivalents (1,667,389) 448,200
Net increase (decrease) in cash and cash equivalents $ 79,829,031 $ (11,588,996)
Cash and cash equivalents at beginning of the period 99,532,115 21,699,202
Cash and cash equivalents at end of the period $ 179,361,146 $ 10,110,206

Reconciliation of non-IFRS Financial Measures to IFRS Measures

In addition to its reported results in accordance with International Financial Reporting Standards (“IFRS”) followed by the Company, it has included in this release certain financial measures that are considered non-IFRS financial measures, including the following:

(i) Earnings before interest, taxes, depreciation, and amortization (“EBITDA”);
(ii) Adjusted EBITDA; and
(iii) Adjusted net income (loss) and adjusted earnings (loss) per share.

Reconciliation of Operating Loss to EBITDA and Adjusted EBITDA

Six Months Ended June 30,
2026 2025
(Unaudited and Unreviewed)
Items (Amount in USD)
Operating loss (IFRS) $ (47,180,721) $ (9,070,447)
Add: Depreciation expenses 588,726 325,824
Add: Amortization expenses 181,200 317,806
EBITDA loss (non-IFRS) $ (46,410,795) $ (8,426,817)
Add: Foreign currency devaluation (1) – 12,630,726
Add: Fair value measurement of financial instruments, net (2) 4,002,918 1,531,210
Add: Stock-based compensation expenses 25,426,746 472,642
Add: Acquisition-related expenses (3) 340,000 –
Add: Debt transaction costs (4) 2,044,673 –
Adjusted EBITDA (non-IFRS) $ (14,596,458) $ 6,207,761

Reconciliation of Net Loss and Loss per Share to Adjusted Net Income (Loss) and Adjusted Earnings (Loss) per Share

Six Months Ended June 30,
2026 2025
(Unaudited and Unreviewed)
(Amount in USD)
Items Amount Per share Amount Per share
Net loss (IFRS) $ (46,893,714) $ (1.74) $ (8,503,060) $ (0.43)
Add: Foreign currency devaluation (1) – – 12,630,726 0.64
Add: Fair value measurement of financial instruments, net (2) 4,002,918 0.15 1,531,210 0.08
Add: Stock-based compensation expenses 25,426,746 0.94 472,642 0.02
Less: Tax effects of stock-based compensation expenses (727,217) (0.03) (21,145) –
Add: Acquisition-related expenses (3) 340,000 0.01 – –
Add: Debt transaction costs (4) 2,044,673 0.08 – –
Add: Amortization of acquired intangible assets (5) 171,000 0.01 171,000 0.01
Adjusted net income (loss) (non-IFRS) $ (15,635,594) $ (0.58) $ 6,281,373 $ 0.32
Adjusted diluted earnings (loss) per share (non-IFRS) $ (0.58) $ 0.30

Notes:

  1. Foreign currency devaluation – effects of material depreciation of the Egyptian pound against the U.S. dollar.
  2. Fair value measurement of financial instruments – includes effects of fair value measurement of stock warrants and derivative liabilities.
  3. Acquisition-related expenses – includes expenses incurred for acquisition of Shackleton Finance Limited in June 2026.
  4. Debt transaction costs – includes the portion allocated to derivative liabilities for one-time issuance costs incurred in connection with the convertible notes.
  5. Amortization of acquired intangible assets – includes non-cash amortization expense related to acquired intangible assets.


About Gorilla Technology Group Inc.

Headquartered in London U.K., Gorilla is a global solution provider in Security Intelligence, Network Intelligence, Business Intelligence, IoT technology and data centers. We provide a wide range of solutions, including Smart City, Network, Video, Security Convergence and IoT, across select verticals of Government and Public Services, Manufacturing, Telecom, Retail, Transportation and Logistics, Healthcare and Education, by using AI and Deep Learning Technologies.

Our expertise lies in revolutionizing urban operations, bolstering security and enhancing resilience. We deliver pioneering products that harness the power of AI in intelligent video surveillance, facial recognition, license plate recognition, edge computing, post-event analytics and advanced cybersecurity technologies. By integrating these AI-driven technologies, we empower Smart Cities to enhance efficiency, safety and cybersecurity measures, ultimately improving the quality of life for residents.

For more information, please visit our website: Gorilla-Technology.com.

Forward-Looking Statements
This press release contains “forward-looking statements” within the meaning of the “safe harbor” provisions of the Private Securities Litigation Reform Act of 1995. Gorilla’s actual results may differ from its expectations, estimates and projections and consequently, you should not rely on these forward-looking statements as predictions of future events. Words such as “expect,” “estimate,” “project,” “budget,” “forecast,” “anticipate,” “intend,” “plan,” “may,” “will,” “could,” “should,” “believes,” “predicts,” “potential,” “might” and “continues,” and similar expressions are intended to identify such forward-looking statements. These forward-looking statements include, without limitation, statements regarding our beliefs about the expected timing and amount of revenues that may be recognized under our existing contracts during the second half of 2026 and during 2027, our ability to sign new contracts and execute existing contracts, equipment deployment schedules and overall market conditions, along with those other risks described under the heading “Risk Factors” in the Form 20-F Gorilla filed with the Securities and Exchange Commission (the “SEC”) on April 15, 2026 and those that are included in any of Gorilla’s future filings with the SEC. These forward-looking statements involve significant risks and uncertainties that could cause actual results to differ materially from expected results. Most of these factors are outside of the control of Gorilla and are difficult to predict. Should one or more of these risks or uncertainties materialize, or should underlying assumptions prove incorrect, actual results may vary materially from those indicated or anticipated by such forward-looking statements. Readers are cautioned not to place undue reliance upon any forward-looking statements, which speak only as of the date made. Gorilla undertakes no obligation to update forward-looking statements to reflect events or circumstances after the date they were made except as required by law or applicable regulation.

Investor Relations Contact
Dave Gentry
RedChip Companies, Inc.
1-407-644-4256
GRRR@redchip.com

The issuer is solely responsible for the content of this announcement.