Home Blog Page 2730

TOJOY Shared Holding Group’s 8th China Unicorn Carnival Celebrates Milestone Success, Paving the Way for Private Sector Growth


HONG KONG SAR – Media OutReach Newswire – 21 August 2025 – The 8th China Unicorn Carnival, marking TOJOY Shared Holding Group’s 34th anniversary, concluded in Beijing on August 18, bringing together more than 2,000 leaders from business, government, and academia. Under the theme “Private Enterprises’ Second Leap,” the event explored critical challenges and opportunities for private enterprises, offering innovative strategies for sustainable growth. Beyond being a high-profile gathering of ideas, the event reaffirmed TOJOY’s vital role in advancing high-quality development in China’s private economy through strategic, actionable initiatives.

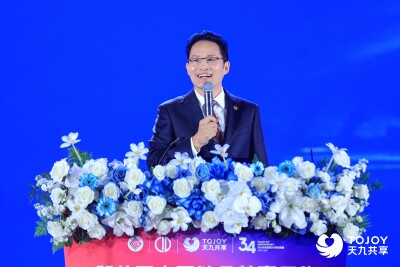
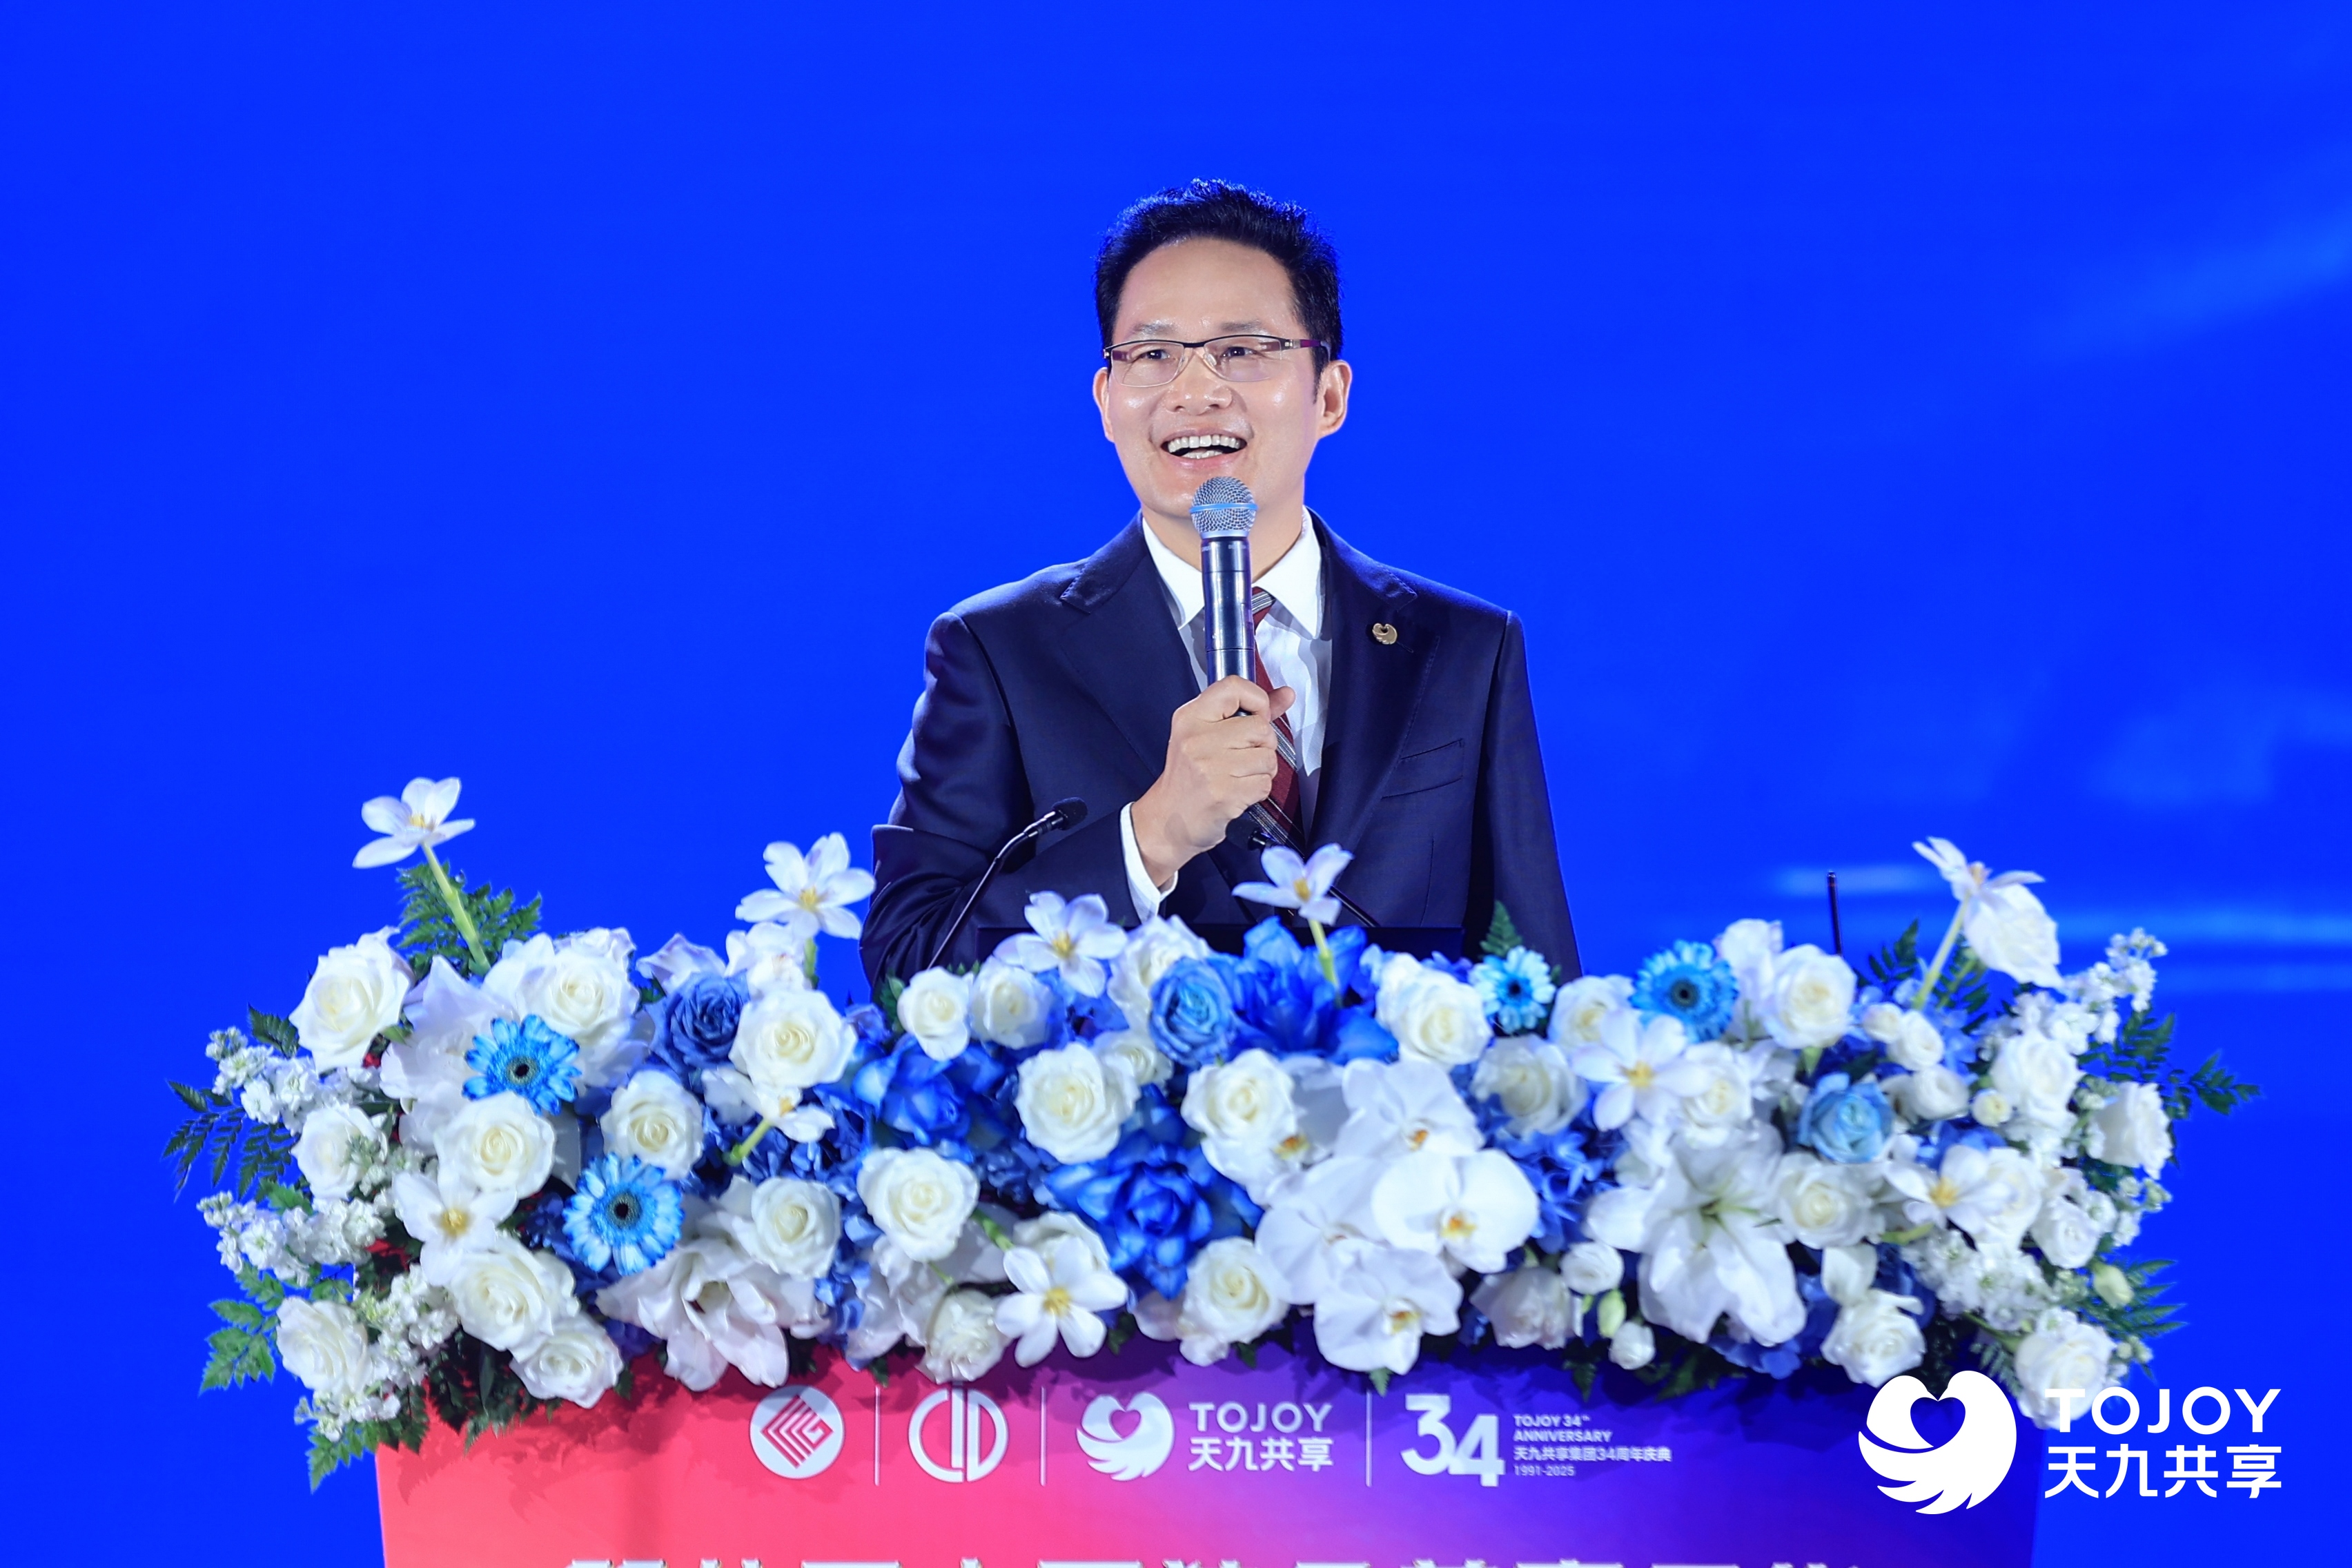
Ge Jun, Co-Chairman of TOJOY Shared Holding Group and the Chairman of the Board and CEO of TOJOY Shared Enterprise Services, highlighted the pivotal role of platform ecosystems in transforming business models.
Ge Jun, Co-Chairman of TOJOY Shared Holding Group and the Chairman of the Board and CEO of TOJOY Shared Enterprise Services, highlighted the pivotal role of platform ecosystems in transforming business models. “The future will belong to businesses that either build platforms or leverage them,” he said.

Driving the Next Leap for Private Enterprises

In his keynote speech, “Private Enterprises’ Second Leap in a Changing Era,” Ge Jun, Co-Chairman of TOJOY Shared Holding Group and the Chairman of the Board and CEO of TOJOY Shared Enterprise Services, highlighted the pivotal role of platform ecosystems in transforming business models. “The future will belong to businesses that either build platforms or leverage them,” he said.

Using TOJOY’s Boss Cloud platform and NVIDIA’s CUDA ecosystem as examples, GE Jun outlined the critical role platform-driven ecosystems play in unlocking growth potential. He encouraged private enterprises to explore new consumer markets, especially in the emerging “emotional value” economy, while building new growth drivers by capitalizing on their core strengths. He also highlighted the importance of using platform ecosystems to expand globally and capitalize on opportunities arising from favorable policies. Calling for innovation and collaboration, GE Jun stressed that businesses must harness the synergies of platforms to drive disruptive value and shared success.

Wang Min, Executive President and Secretary-General of the China General Chamber of Commerce, reinforced this message at the opening ceremony, stressing the need for collaboration and innovation to navigate today’s challenging economic landscape. He praised TOJOY’s platform-driven model for optimizing resource allocation and driving sustainable growth in the private sector.

Boss Cloud Surpasses 6 Million Users, Cementing Leadership in Smart Ecosystems

The event marked a significant milestone for TOJOY’s flagship platform, Boss Cloud, which has now surpassed 6 million registered users. This achievement underscores the platform’s growing influence and its ability to aggregate resources, reflecting the broader digitalization and intelligent transformation sweeping through China’s private economy.

As one of China’s premier big-data resource platforms for entrepreneurs, Boss Cloud connects businesses across industries, regions, and stages of development. The platform employs advanced AI technology to match companies with opportunities, helping them identify markets, expand resources, build networks, and seize new growth potential.

Boss Cloud’s strong growth is driven by TOJOY’s ongoing investment in AI innovation. Its proprietary Tianxingqiong AI model has reached key milestones, including certification from China’s Cyberspace Administration for deep synthesis algorithms and regulatory approval for generative AI services in 2025. These developments enable the platform to deliver smarter, faster, and more accurate solutions to its growing user base.

Platforms and AI Propel the Future of Private Economic Growth

Boss Cloud’s success is closely tied to supportive national policies, such as the implementation of the Private Economy Promotion Law and the Interim Measures for Generative AI Services Management, which provide a favorable environment for compliant AI enterprises like TOJOY. Reflecting on these developments, Ge Jun remarked, “Boss Cloud’s 6 million users are living proof of the win-win logic of a shared ecosystem. Moving forward, businesses must align with policy directions and embrace platform ecosystems to seize opportunities in an ever-changing economic landscape.”

Having witnessed the evolution of private enterprises over its 34-year journey, TOJOY continues to lead the sector’s transformation from traditional models to the digital and intelligent age. Looking ahead, the company remains committed to empowering businesses through platform-driven solutions and AI-powered innovations, injecting new momentum into China’s economy. With its 6 million users, TOJOY aims to write a new chapter in the growth and transformation of the country’s private economy.

Hashtag: #TOJOY

The issuer is solely responsible for the content of this announcement.

Waterdrop Inc. to Report Second Quarter 2025 Financial Results on September 4, 2025

BEIJING, Aug. 21, 2025 /PRNewswire/ — Waterdrop Inc. (NYSE: WDH) (“Waterdrop” or the “Company”), a leading technology platform dedicated to insurance and healthcare service with a positive social impact, today announced that it will report its unaudited financial results for the second quarter ended June 30, 2025, before U.S. markets open on Thursday, September 4, 2025.

Waterdrop’s management team will hold a conference call on September 4, 2025 at 8:00 AM U.S. Eastern Time (8:00 PM Beijing/Hong Kong Time on the same day) to discuss the financial results. Dial-in details for the earnings conference call are as follows:

International:

1-412-317-6061

United States Toll Free:

1-888-317-6003

Hong Kong Toll Free:

800-963976

Hong Kong:

852-58081995

Mainland China:

4001-206115

Chinese Line (Mandarin) Entry Number:

0088782

English Interpretation Line (Listen-only Mode) Entry Number:  

7013962

Participants can choose between the Chinese and the English interpretation lines. Please note that the English interpretation option will be in listen-only mode. Please dial in 15 minutes before the call is scheduled to begin and provide the Elite Entry Number to join the call.

Telephone replays will be accessible two hours after the conclusion of the conference call through September 11, 2025 by dialing the following numbers:

United States Toll Free:                                  

1-877-344-7529

International Toll:

1-412-317-0088

Chinese Line Access Code:

4409082

English Interpretation Line Access Code:

3334217

Additionally, live and archived webcasts of the conference call will be available at the Company’s investor relations website at http://ir.waterdrop-inc.com/.

About Waterdrop Inc.

Waterdrop Inc. (NYSE: WDH) is a leading technology platform dedicated to insurance and healthcare service with a positive social impact. Founded in 2016, with the comprehensive coverage of Waterdrop Insurance Marketplace and Waterdrop Medical Crowdfunding, Waterdrop aims to bring insurance and healthcare service to billions through technology. For more information, please visit www.waterdrop-inc.com.

For investor inquiries, please contact

Waterdrop Inc.
IR@shuidi-inc.com

Yunji Announces First Half 2025 Unaudited Financial Results

HANGZHOU, China, Aug. 21, 2025 /PRNewswire/ — Yunji Inc. (“Yunji” or the “Company”) (NASDAQ: YJ), a leading membership-based social e-commerce platform, today announced its unaudited financial results for the half year ended June 30, 2025[1].

First Half 2025 Highlights

  • Total revenues in the first half of 2025 were RMB158.3 million (US$22.1 million), compared with RMB233.8 million in the same period of 2024. The change was primarily due to soft consumer confidence and the Company’s continued strategy to refine its product selection across all categories and optimize its selection of suppliers and merchants, which had an impact on sales.
  • Repeat purchase rate[2] in the twelve months ended June 30, 2025 was 71.0%.

Mr. Shanglue Xiao, Chairman and Chief Executive Officer of Yunji, said, “In the first half of 2025, we continued to advance our strategic transformation toward becoming a trusted advocate for organic living. By building an integrated portfolio that combines organic health products, beauty offerings, and immersive wellness experiences, we are deepening customer engagement and reinforcing our focus on high‑margin, high‑retention categories. We are expanding user acquisition through both online and offline channels to better connect with consumers and deliver greater value to our members.”

“During the first half of 2025, we continued to optimize our cost structure while ensuring efficient capital allocation. We remain committed to maintaining financial discipline and driving improved profitability while supporting long-term, sustainable growth,” said Ms. Nan Song, Senior Financial Director of Yunji.

First Half 2025 Unaudited Financial Results

Total revenues were RMB158.3 million (US$22.1 million), compared with RMB233.8 million in the same period of 2024. The change was primarily due to soft consumer confidence and the Company’s continued strategy to refine its product selection across all categories and optimize its selection of suppliers and merchants, which had an impact on sales.

  • Revenues from sales of merchandise were RMB131.7 million (US$18.4 million), compared with RMB185.0 million in the same period of 2024.
  • Revenues from the marketplace business were RMB24.5 million (US$3.4 million), compared with RMB45.2 million in the same period of 2024.
  • Other revenues were RMB2.1 million (US$0.3 million), compared with RMB3.6 million in the same period of 2024.

Total cost of revenues decreased by 31.2% to RMB83.5 million (US$11.7 million), or 52.7% of total revenues, from RMB121.3 million, or 51.9% of total revenues, in the same period of 2024. Revenues and cost of revenues are recognized on a gross basis. Total cost of revenues, which mainly comprises the costs related to the sales of merchandise, decreased accordingly in the first half of 2025.

Total operating expenses increased by 20.3% to RMB179.4 million (US$25.0 million) from RMB149.1 million in the same period of 2024.

  • Fulfillment expenses decreased by 51.7% to RMB20.6 million (US$2.9 million), or 13.0% of total revenues, from RMB42.6 million, or 18.2% of total revenues, in the same period of 2024. The decrease was primarily due to (i) reduced warehousing and logistics expenses due to lower merchandise sales, and (ii) reduced personnel costs as a result of staffing structure refinements.
  • Sales and marketing expenses increased by 5.5% to RMB50.1 million (US$7.0 million), or 31.6% of total revenues, from RMB47.5 million, or 20.3% of total revenues, in the same period of 2024. The increase was primarily due to (i) the increase in member management fees, as a result of our expanded initiatives to grow the membership base, and (ii) the increase in personnel costs as a result of adjusting staffing structure to support market expansion initiatives, partially offset by a reduction in advertising expenses.
  • Technology and content expenses decreased by 40.0% to RMB15.3 million (US$2.1 million), or 9.7% of total revenues, from RMB25.5 million, or 10.9% of total revenues, in the same period of 2024. The decrease was primarily due to the reduction in personnel costs as a result of staffing structure refinements.
  • General and administrative expenses increased by 178.6% to RMB93.4 million (US$13.0 million), or 59.0% of total revenues, from RMB33.5 million, or 14.3% of total revenues, in the same period of 2024. The increase was primarily due to an increase in an allowance for credit losses[4] , partially offset by (i) the reduction in professional service expenses, as a result of our cost-saving efforts, and (ii) the reduction in personnel costs as a result of staffing structure refinements.

Loss from operations was RMB100.4 million (US$14.0 million), compared with RMB32.4 million in the same period of 2024.

Financial income, net was RMB3.9 million (US$0.5 million), compared with financial income, net of RMB25.6 million in the same period of 2024, primarily due to a decrease in the fair value changes of equity securities investments.

Net loss was RMB100.7 million (US$14.1 million), compared with RMB8.0 million in the same period of 2024.

Adjusted net loss (non-GAAP)[3] was RMB100.5 million (US$14.0 million), compared with RMB6.7 million in the same period of 2024.

Basic and diluted net loss per share attributable to ordinary shareholders were both RMB0.05, compared with RMB0.00 in the same period of 2024.

Use of Non-GAAP Financial Measures

In evaluating the business, the Company considers and uses adjusted net loss as a supplemental measure to review and assess operating performance. The presentation of this non-GAAP financial measure is not intended to be considered in isolation or as a substitute for the financial information prepared and presented in accordance with U.S. GAAP. The Company defines adjusted net loss as net loss excluding share-based compensation.

The Company presents adjusted net loss because it is used by management to evaluate operating performance and formulate business plans. Adjusted net loss enables management to assess operating performance without considering the impact of share-based compensation recorded under ASC 718, “Compensation-Stock Compensation.” The Company also believes that the use of this non-GAAP measure facilitates investors’ assessment of operating performance.

This non-GAAP financial measure is not defined under U.S. GAAP and is not presented in accordance with U.S. GAAP. The non-GAAP financial measure has limitations as an analytical tool. One of the key limitations of using adjusted net loss is that it does not reflect all items of income and expense that affect the Company’s operations. Share-based compensation has been and may continue to be incurred in Yunji’s business and is not reflected in the presentation of adjusted net loss. Further, this non-GAAP measure may differ from the non-GAAP information used by other companies, including peer companies, and therefore its comparability may be limited.

The Company compensates for these limitations by reconciling the non-GAAP financial measure to the nearest U.S. GAAP performance measure, all of which should be considered when evaluating performance. Yunji encourages investors and others to review its financial information in its entirety and not rely on a single financial measure.

For more information on the non-GAAP financial measures, please see the table captioned “Reconciliation of Non-GAAP Measures to the Most Directly Comparable Financial Measures” set forth at the end of this press release.

Conference Call

The Company will host a conference call on Thursday, August 21, 2025, at 7:30 A.M. Eastern Time or 7:30 P.M. Beijing/Hong Kong Time to discuss its earnings. Listeners may access the call by dialing the following numbers:

International:

1-412-902-4272

United States Toll Free:

1-888-346-8982

Mainland China Toll Free:  

4001-201203

Hong Kong Toll Free:     

800-905945

Conference ID: 

Yunji Inc.

A telephone replay of the call will be available after the conclusion of the conference call for one week.

Dial-in numbers for the replay are as follows:

United States Toll Free

1-877-344-7529

International

1-412-317-0088

Replay Access Code

9361525

Safe Harbor Statements

This announcement contains forward-looking statements. These statements are made under the “safe harbor” provisions of the U.S. Private Securities Litigation Reform Act of 1995. These forward-looking statements can be identified by terminology such as “will,” “expects,” “anticipates,” “aims,” “future,” “intends,” “plans,” “believes,” “estimates,” “confident,” “potential,” “continue” or other similar expressions. Among other things, the quotations from management in this announcement, as well as Yunji’s strategic and operational plans, contain forward-looking statements. Yunji may also make written or oral forward-looking statements in its periodic reports to the U.S. Securities and Exchange Commission (the “SEC”), in its annual report to shareholders, in press releases and other written materials and in oral statements made by its officers, directors or employees to third parties. Statements that are not historical facts, including but not limited to statements about Yunji’s beliefs and expectations, are forward-looking statements. Forward-looking statements involve inherent risks and uncertainties. A number of factors could cause actual results to differ materially from those contained in any forward-looking statement, including but not limited to the following: Yunji’s growth strategies; its future business development, results of operations and financial condition; its ability to understand buyer needs and provide products and services to attract and retain buyers; its ability to maintain and enhance the recognition and reputation of its brand; its ability to rely on merchants and third-party logistics service providers to provide delivery services to buyers; its ability to maintain and improve quality control policies and measures; its ability to establish and maintain relationships with merchants; trends and competition in China’s e-commerce market; changes in its revenues and certain cost or expense items; the expected growth of China’s e-commerce market; PRC governmental policies and regulations relating to Yunji’s industry, and general economic and business conditions globally and in China and assumptions underlying or related to any of the foregoing. Further information regarding these and other risks is included in Yunji’s filings with the SEC. All information provided in this press release and in the attachments is as of the date of this press release, and Yunji undertakes no obligation to update any forward-looking statement, except as required under applicable law.

About Yunji Inc.

Yunji Inc. is a leading social e-commerce platform in China that has pioneered a unique, membership-based model to leverage the power of social interactions. The Company’s e-commerce platform offers high-quality products at attractive prices across a wide variety of categories catering to the day-to-day needs of Chinese consumers. In addition, the Company uses advanced technologies including big data and artificial intelligence to optimize user experience and incentivize members to promote the platform as well as share products with their social contacts. Through deliberate product curation, centralized merchandise sourcing, and efficient supply chain management, Yunji has established itself as a trustworthy e-commerce platform with high-quality products and exclusive membership benefits, including discounted prices.

For more information, please visit https://investor.yunjiglobal.com/

Investor Relations Contact

Yunji Inc.
Investor Relations
Email: Yunji.IR@icrinc.com
Phone: +1 (646) 224-6957

ICR, LLC
Robin Yang
Email: Yunji.IR@icrinc.com
Phone: +1 (646) 224-6957


YUNJI INC.

UNAUDITED CONDENSED CONSOLIDATED BALANCE SHEETS

(All amounts in thousands, except for share and per share data, unless otherwise noted)

As of

December 31,

2024

June 30,

2025

RMB

RMB

US$

ASSETS

Current Assets

Cash and cash equivalents

219,365

150,407

20,996

Restricted cash

23,467

23,138

3,230

Short-term investments

43,535

6,077

Accounts receivable, net (Allowance for
credit losses of RMB34,005 and
RMB32,167, respectively)

56,233

4,285

598

Advance to suppliers

9,810

9,018

1,259

Inventories, net

29,448

46,047

6,428

Amounts due from related parties

662

384

54

Prepaid expenses and other current assets[4] (Allowance for credit losses of RMB23,423
and RMB104,864, respectively)

177,187

114,308

15,957

Total current assets

516,172

391,122

54,599

Non-current assets

Property and equipment, net

205,450

234,324

32,710

Land use rights, net[5]

174,437

172,229

24,042

Long-term investments

364,534

355,516

49,628

Operating lease right-of-use assets, net

13,809

5,752

803

Other non-current assets (Allowance for
credit losses of RMB28,305 and
RMB18,337, respectively)

78,050

65,039

9,079

Total non-current assets

836,280

832,860

116,262

Total assets

1,352,452

1,223,982

170,861


YUNJI INC.

UNAUDITED CONDENSED CONSOLIDATED BALANCE SHEETS (CONTINUED)

(All amounts in thousands, except for share and per share data, unless otherwise noted)

As of

December 31,

2024

June 30,

2025

RMB

RMB

US$

LIABILITIES AND SHAREHOLDERS’
EQUITY


Current Liabilities

Accounts payable

54,678

46,843

6,539

Deferred revenue

8,596

14,325

2,000

Incentive payables to members[6]

66,039

55,055

7,685

Member management fees payable

1,263

2,056

287

Other payable and accrued liabilities

126,177

97,765

13,647

Amounts due to related parties

1,645

1,527

213

Short-term borrowings

15,057

2,102

Operating lease liabilities – current

3,845

1,251

175

Total current liabilities

262,243

233,879

32,648

Non-current liabilities

Operating lease liabilities

7,808

3,809

532

Other non-current liabilities

4,355

10,398

1,451

Total non-current liabilities

12,163

14,207

1,983

Total Liabilities

274,406

248,086

34,631


YUNJI INC.

UNAUDITED CONDENSED CONSOLIDATED BALANCE SHEETS (CONTINUED)

(All amounts in thousands, except for share and per share data, unless otherwise noted)

As of

December 31,

2024

June 30,

2025

RMB

RMB

US$

Shareholders’ equity

Ordinary shares

70

70

10

Less: Treasury stock

(113,334)

(113,334)

(15,821)

Additional paid-in capital

7,328,336

7,328,546

1,023,026

Statutory reserve

16,726

16,726

2,335

Accumulated other comprehensive income

93,145

91,496

12,772

Accumulated deficit

(6,247,557)

(6,348,267)

(886,184)

Total Yunji Inc. shareholders’ equity

1,077,386

975,237

136,138

Non-controlling interests

660

659

92

Total shareholders’ equity

1,078,046

975,896

136,230

Total liabilities and shareholders’ equity

1,352,452

1,223,982

170,861


YUNJI INC.

UNAUDITED CONDENSED CONSOLIDATED STATEMENTS OF COMPREHENSIVE LOSS

 (All amounts in thousands, except for share and per share data, unless otherwise noted)

For the Six Months Ended

June 30,

2024

June 30,

2025

RMB

RMB

US$

Revenues:

Sales of merchandise, net

185,025

131,735

18,389

Marketplace revenue

45,167

24,463

3,415

Other revenues

3,645

2,132

298

Total revenues

233,837

158,330

22,102

Operating cost and expenses:

Cost of revenues

(121,311)

(83,487)

(11,654)

Fulfilment

(42,568)

(20,556)

(2,869)

Sales and marketing

(47,488)

(50,083)

(6,991)

Technology and content

(25,531)

(15,317)

(2,138)

General and administrative

(33,521)

(93,406)

(13,039)

Total operating cost and expenses

(270,419)

(262,849)

(36,691)

Other operating income

4,161

4,127

576

Loss from operations

(32,421)

(100,392)

(14,013)

Financial income, net

25,593

3,900

544

Foreign exchange income/(loss), net

2,330

(1,816)

(254)

Other non-operating income,

 net

118

936

131

Loss before income tax expense, and
equity in loss of affiliates, net of tax

(4,380)

(97,372)

(13,592)

Income tax expense

(1,293)

(1,975)

(276)

Equity in loss of affiliates, net of tax

(2,359)

(1,363)

(190)

Net loss

(8,032)

(100,710)

(14,058)

Less: net loss attributable to non-
controlling interests shareholders

(1)

Net loss attributable to YUNJI INC.

(8,031)

(100,710)

(14,058)


YUNJI INC.

UNAUDITED CONDENSED CONSOLIDATED STATEMENTS OF COMPREHENSIVE LOSS (CONTINUED)

(All amounts in thousands, except for share and per share data, unless otherwise noted)

For the Six Months Ended

June 30,

2024

June 30,

2025

RMB

RMB

US$

Net loss attributable to ordinary
shareholders

(8,031)

(100,710)

(14,058)

Net loss

(8,032)

(100,710)

(14,058)

Other comprehensive income

 Foreign currency translation
adjustment

4,121

(1,649)

(230)

Total comprehensive loss

(3,911)

(102,359)

(14,288)

Less: total comprehensive loss
attributable to non-controlling interests
shareholders

(1)

Total comprehensive loss attributable
to YUNJI INC.

(3,910)

(102,359)

(14,288)

Net loss attributable to ordinary
shareholders

(8,031)

(100,710)

(14,058)

Weighted average number of ordinary
shares used in computing net loss per
share, basic and diluted

1,967,014,878

1,970,633,933

1,970,633,933

Net loss per share attributable to
ordinary shareholders

Basic

(0.00)

(0.05)

(0.01)

Diluted

(0.00)

(0.05)

(0.01)


YUNJI INC.

NOTES TO UNAUDITED FINANCIAL INFORMATION

(All amounts in thousands, except for share and per share data, unless otherwise noted)

For the Six Months Ended

June 30,

2024

June 30,

2025

RMB

RMB

US$

Share-based compensation expenses
included in:

Technology and content

823

117

16

General and administrative

448

93

13

Fulfillment

36

(12)

(2)

Sales and marketing

44

12

2

Total

1,351

210

29


YUNJI INC.

RECONCILIATION OF NON-GAAP MEASURES TO THE MOST DIRECTLY COMPARABLE FINANCIAL
MEASURES

(All amounts in thousands, except for share and per share data, unless otherwise noted)

For the Six Months Ended

June 30,

2024

June 30,

2025

RMB

RMB

US$

Reconciliation of Net Loss to Adjusted
Net Loss:

Net loss

(8,032)

(100,710)

(14,058)

Add: Share-based compensation

1,351

210

29

Adjusted net loss

(6,681)

(100,500)

(14,029)


[1].       This announcement contains translations of certain Renminbi (RMB) amounts into U.S. dollars (US$) at a specified rate solely for the convenience of the reader. Unless otherwise noted, the translation of RMB into US$ has been made at RMB7.1636 to US$1.00, the exchange rate in effect as of June 30, 2025 as set forth in the H.10 statistical release of The Board of Governors of the Federal Reserve System.

[2].       “Repeat purchase rate” in a given period is calculated as the number of transacting members who purchased not less than twice divided by the total number of transacting members during such period. “Transacting member” in a given period refers to a member who successfully promotes Yunji’s products to generate at least one order or places at least one order on Yunji’s platform, regardless of whether any product in such order is ultimately sold or delivered or whether any product in such order is returned.

[3].       Adjusted net loss is a non-GAAP financial measure, which is defined as net loss excluding share-based compensation expense. See “Reconciliation of Non-GAAP Measures to the Most Directly Comparable Financial Measures” set forth at the end of this press release.

[4].       As of June 30, 2025, Short-term loan receivables of amount RMB148.0 million were included in the prepaid expenses and other current assets balance, which represent the principal and interest to be collected on loans provided by the Group to third-party companies. The decrease in prepaid expenses and other current assets as of June 30, 2025 compared to June 30, 2024 was primarily due to an increased allowance for credit losses. The increase of credit losses was driven mainly by a provision of approximately RMB69.0 million for credit losses on a short-term loan receivable extended to an independent third party. The Company has determined the loan to be probably unrecoverable and has accordingly recognized an allowance for expected credit losses.

[5].       In June 2024, the Company won the bid for a parcel of land located in Xiaoshan District, Hangzhou, China, covering approximately 10 thousand square meters (the “Hangzhou Land Parcel”) and entered into an agreement with the local government to acquire the land use right of the Hangzhou Land Parcel for an aggregate consideration of approximately RMB171.5 million. In July 2024, the Company obtained the certificate of the land use right and carried the land use right at a cost of RMB176.6 million, including a tax expense of RMB5.1million, less accumulated amortization and impairment losses, if any. The Company intends to construct a new office building on the Hangzhou Land Parcel to use it as its new headquarters and also lease offices to external parties. The total amount for the land acquisition and office building construction is expected to be approximately RMB600.0 million. The Company intends to fund the land acquisition and building construction through cash on hand and bank financing.

[6].       As of June 30, 2025, the decrease in incentive payables was mainly due to derecognition of long-aged payables to inactive members.


Canadian Solar Reports Second Quarter 2025 Results

KITCHENER, ON, Aug. 21, 2025 /PRNewswire/ — Canadian Solar Inc. (“Canadian Solar” or the “Company”) (NASDAQ: CSIQ) today announced financial results for the second quarter ended June 30, 2025.

Second Quarter Highlights

  • 14% quarter-over-quarter (“qoq”) increase in solar module shipments to 7.9 GW, within guidance of 7.5 GW to 8.0 GW.
  • 29.8% gross margin, exceeding guidance of 23% to 25%.
  • Released the 2024 Sustainability Report on May 29, 2025, with updated disclosures aligned to global reporting standards.

Dr. Shawn Qu, Chairman and CEO, commented, “We delivered a second quarter largely in line with expectations. While revenue came in below guidance due to storage shipments shifting to the second half and delays in certain project sales, gross margin exceeded expectations, driven by a higher mix of North America module shipments and robust storage volumes. Following the surge in installations in China during the first half, we expect demand to normalize as the market adjusts to a new paradigm. We remain focused on navigating the uncertain policy environment with a focus on risk management and sustainable profitability.”

Yan Zhuang, President of Canadian Solar’s subsidiary CSI Solar, said, “In the second quarter, we delivered module shipments near the high end of guidance. Despite tariff headwinds, e-STORAGE achieved one of its strongest quarters. With solar supply chain pricing trending higher and storage margins normalizing, we expect margin pressure in the second half. We remain focused on strategically managing module volumes to less profitable markets and growing our storage volumes globally. Meanwhile, we continue to build emerging profitability drivers such as our residential energy storage systems and bundled sales solutions.”

Ismael Guerrero, CEO of Canadian Solar’s subsidiary Recurrent Energy, said, “Revenue and profitability in the second quarter were sequentially lower, primarily due to lighter project sales. We monetized over 200 MW of projects in Europe and Japan, including our first and profitable sale of a battery energy storage project in Italy, while a project sale in Latin America shifted to the second half of the year. Overall, we expect our electricity sales revenue to grow steadily, as we enhance the performance of our existing IPP portfolio and advance construction in our target markets, with more meaningful contributions expected next year.”

Xinbo Zhu, Senior VP and CFO, added, “In the second quarter, we delivered $1.7 billion in revenue and a gross margin of 29.8%. Non-recurring operating expenses, including impairments to projects and manufacturing assets, reduced profitability, resulting in net income attributable to shareholders of $7 million, or a net loss of $0.08 per diluted share. We continue to manage cash flow prudently, prioritizing disciplined capital deployment. Operating cash inflow was $189 million, and we ended the quarter with a cash position of $2.3 billion.”

Second Quarter 2025 Results

Total module shipments recognized as revenues in Q2 2025 were 7.9 GW, up 14% quarter-over-quarter (“qoq”) and down 4% year-over-year (“yoy”). Of the total, 672 MW were shipped to the Company’s own utility-scale solar power projects.

Net revenues were $1.7 billion in Q2 2025, up 42% sequentially and 4% yoy, mainly due to higher sales of battery energy storage systems and solar modules.

Gross profit was $505 million, compared to $140 million in Q1 2025 and $282 million in Q2 2024. Gross margin was 29.8%, compared to 11.7% and 17.2%, respectively. The gross margin sequential and yoy increases were primarily driven by a release of unrealized profit upon sales-type leasing of a U.S. project, higher margin contribution from battery energy storage systems, and the benefit from a U.S. anti-dumping (“AD”) and countervailing duty (“CVD”) true-up adjustment.

Operating expenses were $378 million, up from $195 million in Q1 2025 and $234 million in Q2 2024. The increase was primarily caused by impairment charges related to certain solar and storage assets, as well as manufacturing assets. Operating expenses represented 22.3% of revenue, compared to 16.3% in Q1 2025 and 14.3% in Q2 2024.

Net income attributable to Canadian Solar in accordance with generally accepted accounting principles in the United States of America (“GAAP”) in Q2 2025 was $7 million, or a net loss of $0.08 per diluted share, compared to a net loss of $34 million, or $0.69 per diluted share, in the Q1 2025, and net income of $4 million, or $0.02 per diluted share, in Q2 2024.

Adjusted net loss attributable to Canadian Solar Inc. (non-GAAP) was $23 million, and adjusted loss per share – diluted was $0.53 per share in Q2 2025, compared to an adjusted net loss of $60 million or adjusted $1.07 per share in Q1 2025, and a net income of $4 million or $0.02 per share in Q2 2024. Adjusted net loss attributable to Canadian Solar Inc. and adjusted loss per share – diluted in Q2 2025 and Q1 2025 exclude the recognition of income using hypothetical liquidation at book value (“HLBV”) method. The Company uses the HLBV method to attribute income and loss to its tax equity investors. Please see Recurrent Energy – HLBV for definition and About Non-GAAP Financial Measures for reconciliation to nearest GAAP measures.

Net cash flow provided by operating activities in Q2 2025 was $189 million, driven by changes in working capital, specifically a decrease in inventories, compared to net cash flow used in operating activities of $264 million in Q1 2025 and $429 million in Q2 2024.

Total debt, including financing liabilities, was $6.3 billion as of June 30, 2025, including $2.5 billion, $3.5 billion, and $0.3 billion related to CSI Solar, Recurrent Energy, and convertible notes, respectively. Total debt rose from $5.7 billion as of March 31, 2025, mainly due to new borrowings for development of projects and operational assets. Total non-recourse debt as of June 30, 2025, was $1.8 billion.

Business Segments

The Company operates in two reportable segments: CSI Solar, focused on solar modules and battery energy storage manufacturing and products, and Recurrent Energy, focused on utility-scale solar power and battery energy storage project development and operation.

Recurrent Energy

As of June 30, 2025, the Company held a leading position with a total global solar project development pipeline of approximately 27 GWp and a battery energy storage project development pipeline of 80 GWh.

The business model consists of three key drivers:

  • Electricity revenue from operating portfolio to drive stable, diversified cash flows in growth markets with stable currencies, with some project ownership sales to manage cash flow and debt level;
  • Asset sales (solar power and battery energy storage) in the rest of the world to drive cash-efficient growth model, as value from project sales will help fund growth in operating assets in stable currency markets; and
  • Power services (O&M) through long-term operations and maintenance (“O&M”) contracts, currently with nearly 14 GW of contracted projects, to drive stable and long-term recurring earnings and synergies with the project development platform.

Project Development Pipeline – Solar

As of June 30, 2025, the Company’s total solar project development pipeline was 27.3 GWp, including 2.0 GWp under construction, 4.2 GWp of backlog, and 21.1 GWp of projects in advanced and early-stage development, defined as follows:

  • Backlog projects are late-stage projects that have passed their risk cliff date and are expected to start construction in the next 1-4 years. A project’s risk cliff date is the date on which the project passes the last high-risk development stage and varies depending on the country where it is located. Typically, this occurs after the project has received all the required environmental and regulatory approvals, and entered into interconnection agreements and offtake contracts, including feed-in tariff (“FIT”) arrangements and power purchase agreements (“PPAs”). A significant majority of backlog projects are contracted (i.e., have secured a PPA or FIT), and the remaining have a reasonable assurance of securing PPAs.
  • Advanced pipeline projects are mid-stage projects that have secured or have more than 90% certainty of securing an interconnection agreement.
  • Early-stage pipeline projects are early-stage projects controlled by the Company that are in the process of securing interconnection.

While the magnitude of the Company’s project development pipeline is an important indicator of potential expanded power generation and battery energy storage capacity as well as potential future revenue growth, the development of projects in its pipeline is inherently uncertain. If the Company does not successfully complete the pipeline projects in a timely manner, it may not realize the anticipated benefits of the projects to the extent anticipated, which could adversely affect its business, financial condition, or results of operations. In addition, the Company’s guidance and estimates for its future operating and financial results assume the completion of certain solar projects and battery energy storage projects that are in its pipeline. If the Company is unable to execute on its actionable pipeline, it may miss its guidance, which could adversely affect the market price of its common shares and its business, financial condition, or results of operations.

HLBV

The Company applies the HLBV method to account for its contractual relationships with tax equity investors in U.S. solar energy and battery energy storage projects. This method which allocates income or loss attributable to redeemable noncontrolling interests reflects the changes in the amounts that tax equity investors would hypothetically receive upon liquidation at the beginning and end of each reporting period, after considering any capital transactions, such as contributions or distributions, between our subsidiaries and tax equity investors.

The following table presents the Company’s total solar project development pipeline.

Solar Project Development Pipeline (as of June 30, 2025) – MWp*

Region

Under
Construction

Backlog

Advanced
Development

Early-Stage
Development

Total

North America

276

547

427

5,024

6,274

Europe, the Middle East, and Africa
(“EMEA”)

1,073

1,704**

872

4,767

8,416

Latin America

128**

823

352

5,666

6,969

Asia Pacific excluding China and Japan

171

275

430

1,289

2,165

China

300

780**

2,100

3,180

Japan

52

33

80

127

292

Total

2,000

4,162

2,161

18,973

27,296

*All numbers are gross MWp.

**Including 63 MWp under construction and 551 MWp in backlog that are owned by or already sold to third parties.


Project Development Pipeline – Battery Energy Storage

As of June 30, 2025, the Company’s total battery energy storage project development pipeline was 80.2 GWh, including 6.4 GWh under construction and in backlog, and 73.8 GWh of projects in advanced and early-stage development.

The table below sets forth the Company’s total battery energy storage project development pipeline.

Battery Energy Storage Project Development Pipeline (as of June 30, 2025) – MWh

Region

Under
Construction

Backlog

Advanced
Development

Early-Stage
Development

Total

North America

600

200

600

20,644

22,044

EMEA

43

2,708

4,493

31,790

39,034

Latin America

1,320

1,385

2,705

Asia Pacific excluding China and Japan

440

240

740

2,580

4,000

China

1,200

6,600

7,800

Japan

8

936

2,031

1,650

4,625

Total

1,091

5,284

9,184

64,649

80,208


CSI Solar

Solar Modules and Solar System Kits

CSI Solar shipped 7.9 GW of solar modules and solar system kits to more than 70 countries in Q2 2025. The top five markets ranked by shipments were the U.S., China, Pakistan, Spain, and Australia.

CSI Solar’s revised manufacturing capacity expansion targets are set forth below.

Solar Manufacturing Capacity, GW*

June 2025

Actual

December 2025

Plan

Ingot

31.0

31.0

Wafer

37.0

37.0

Cell

36.2

32.4

Module

59.0

51.2

*Nameplate annualized capacities at said point in time. Capacity expansion plans are subject to change without notice
based on market conditions and capital allocation plans. 


e-STORAGE: Battery Energy Storage Solutions

As of June 30, 2025, e-STORAGE contracted backlog, including contracted long-term service agreements, was $3 billion. These are signed orders with contractual obligations to customers, providing significant earnings visibility over a multi-year period.

The table below sets forth e-STORAGE’s manufacturing capacity expansion targets.

e-STORAGE Manufacturing Capacity Expansion Plans*

June 2025
Actual

December 2025
Plan

December 2026
Plan

SolBank Battery Energy Storage Solutions (GWh)

10

15

24

Battery Cells (GWh)

3

3

9

*Nameplate annualized capacities (single-shift basis) at said point in time. Capacity expansion plans are subject to change
without notice based on market conditions and capital allocation plans.


Business Outlook

The Company’s business outlook is based on management’s current views and estimates given factors such as existing market conditions, order book, production capacity, input material prices, foreign exchange fluctuations, the anticipated timing of project sales, and the global economic environment. This outlook is subject to uncertainty with respect to, among other things, customer demand, project construction and sale schedules, product sales prices and costs, supply chain constraints, and geopolitical conflicts. Management’s views and estimates are subject to change without notice.

In Q3 2025, the Company expects total revenue to be in the range of $1.3 billion to $1.5 billion. Gross margin is expected to be between 14% and 16%. Total module shipments recognized as revenues by CSI Solar are expected to be in the range of 5.0 GW to 5.3 GW. Total battery energy storage shipments by CSI Solar in Q3 2025 are expected to be in the range of 2.1 GWh to 2.3 GWh, including approximately 250 MWh to the Company’s own projects.

For the full year of 2025, the Company expects CSI Solar’s total module shipments to be in the range of 25 GW to 27 GW, including approximately 1 GW to the Company’s projects. CSI Solar’s total battery energy storage shipments are expected to be in the range of 7 GWh to 9 GWh, including approximately 1 GWh to the Company’s own projects. The Company’s total revenue is expected to be in the range of $5.6 billion to $6.3 billion.

Dr. Shawn Qu, Chairman and CEO, commented, “We expect third quarter margins to moderate as difficult market conditions persist, and storage profitability reflects more recent orders at normalized levels. We narrowed our full year module volume guidance and maintained our storage volume guidance, supported by increased visibility into the second half. Full year revenue expectations have been adjusted to reflect certain project sales shifting into 2026 and a more measured view on module pricing. The second half will remain challenging, with rising solar supply chain prices and ongoing trade uncertainties. We will continue to navigate these conditions with discipline, maintaining a prudent balance between growth and profitability.”

Recent Developments

Canadian Solar

On May 29, 2025, Canadian Solar announced the publication of its 2024 Sustainability Report, which highlights the Company’s sustainability strategy and performance, including progress towards achieving its sustainability goals. The sustainability disclosures in the report are aligned with the global standards set by the SASB and GRI, with reference to the IFRS set by the ISSB.

CSI Solar

On July 16, 2025, Canadian Solar announced its residential energy storage system, EP Cube, designed by its subsidiary, Eternalplanet, won the prestigious Red Dot Award 2025. This award recognizes EP Cube as one of the most well-designed residential energy storage products globally. Earlier this year, EP Cube also received several other international design awards, including the If Design Award and MUSE Design Award Gold.  

On June 3, 2025, Canadian Solar announced the completion of Large-Scale Fire Testing for its SolBank 3.0 energy storage system. The successful test demonstrated that SolBank 3.0 meets key fire safety criteria by containing thermal events within a single enclosure, providing enhanced safety assurance for utility-scale deployments.

Recurrent Energy

On July 17, 2025, Canadian Solar announced it closed project financing and tax equity for Blue Moon Solar located in Harrison County, Kentucky. U.S. Bank, through its subsidiary U.S. Bancorp Impact Finance, is providing both tax equity and construction financing for the project, totaling $260 million. Constellation will purchase power and renewable energy certificates produced by the 94 MW energy facility. Blue Moon Solar is currently under construction and expected to reach commercial operation in 2026. Recurrent Energy will own and operate the project after it is energized.

On July 7, 2025, Canadian Solar announced that the 1,200 MWh Papago Storage facility in Maricopa County, Arizona, has reached commercial operation. The project is now dispatching stored energy to Arizona Public Service (APS), the state’s largest electric utility. Papago Storage is the first of three Recurrent Energy projects with tolling agreements in place with APS to become operational.

Conference Call Information

The Company will hold a conference call on Thursday, August 21, 2025, at 8:00 a.m. U.S. Eastern Time (8:00 p.m., Thursday, August 21, 2025, in Hong Kong) to discuss the Company’s second quarter 2025 results and business outlook. The dial-in phone number for the live audio call is +1-877-704-4453 (toll-free from the U.S.), 800 965 561 (from Hong Kong), +86 400 120 2840 (local dial-in from Mainland China) or +1-201-389-0920 from international locations. The conference ID is 13755040. A live webcast of the conference call will also be available on the investor relations section of Canadian Solar’s website at www.canadiansolar.com.

A replay of the call will be available after the conclusion of the call until 11:00 p.m. U.S. Eastern Time on Thursday, September 4, 2025 (11:00 a.m. September 5, 2025, in Hong Kong) and can be accessed by dialing +1-844-512-2921 (toll-free from the U.S.) or +1-412-317-6671 from international locations.  The replay pin number is 13755040. A webcast replay will also be available on the investor relations section of Canadian Solar’s website at www.canadiansolar.com.

About Canadian Solar Inc.

Canadian Solar is one of the world’s largest solar technology and renewable energy companies. Founded in 2001 and headquartered in Kitchener, Ontario, the Company is a leading manufacturer of solar photovoltaic modules; provider of solar energy and battery energy storage solutions; and developer, owner, and operator of utility-scale solar power and battery energy storage projects. Over the past 24 years, Canadian Solar has successfully delivered nearly 165 GW of premium-quality, solar photovoltaic modules to customers across the world. Through its subsidiary e-STORAGE, Canadian Solar has shipped over 13 GWh of battery energy storage solutions to global markets as of June 30, 2025, boasting a $3 billion contracted backlog as of June 30, 2025. Since entering the project development business in 2010, Canadian Solar has developed, built, and connected approximately 12 GWp of solar power projects and 6 GWh of battery energy storage projects globally. Its geographically diversified project development pipeline includes 27 GWp of solar and 80 GWh of battery energy storage capacity in various stages of development. Canadian Solar is one of the most bankable companies in the solar and renewable energy industry, having been publicly listed on the NASDAQ since 2006. For additional information about the Company, follow Canadian Solar on LinkedIn or visit www.canadiansolar.com.

Safe Harbor/Forward-Looking Statements

Certain statements in this press release, including those regarding the Company’s expected future shipment volumes, revenues, gross margins, and project sales are forward-looking statements that involve a number of risks and uncertainties that could cause actual results to differ materially. These statements are made under the “Safe Harbor” provisions of the U.S. Private Securities Litigation Reform Act of 1995. In some cases, you can identify forward-looking statements by such terms as “may”, “will”, “expect”, “anticipate”, “future”, “ongoing”, “continue”, “intend”, “plan”, “potential”, “prospect”, “guidance”, “believe”, “estimate”, “is/are likely to” or similar expressions, the negative of these terms, or other comparable terminology. These forward-looking statements include, among other things, our expectations regarding global electricity demand and the adoption of solar and battery energy storage technologies; our growth strategies, future business performance, and financial condition; our transition to a long-term owner and operator of clean energy assets and expansion of project pipelines; our ability to monetize project portfolios, manage supply chain fluctuations, and respond to economic factors such as inflation and interest rates; our outlook on government incentives, trade measures, regulatory developments, and geopolitical risks; our expectations for project timelines, costs, and returns; competitive dynamics in solar and storage markets; our ability to execute supply chain, manufacturing, and operational initiatives; access to capital, debt obligations, and covenant compliance; relationships with key suppliers and customers; technological advancement and product quality; and risks related to intellectual property, litigation, and compliance with environmental and sustainability regulations. Other risks were described in the Company’s filings with the Securities and Exchange Commission, including its annual report on Form 20-F filed on April 30, 2025. Although the Company believes that the expectations reflected in the forward-looking statements are reasonable, it cannot guarantee future results, level of activity, performance, or achievements. Investors should not place undue reliance on these forward-looking statements. All information provided in this press release is as of today’s date, unless otherwise stated, and Canadian Solar undertakes no duty to update such information, except as required under applicable law.

Investor Relations Contact:

Wina Huang

Investor Relations

Canadian Solar Inc.

investor@canadiansolar.com


FINANCIAL TABLES FOLLOW

The following tables provide unaudited select financial data for the Company’s CSI Solar and Recurrent Energy businesses.

Select Financial Data – CSI Solar and Recurrent Energy

Three Months Ended and As of June 30, 2025

(In Thousands of U.S. Dollars)

CSI Solar

Recurrent
Energy

Elimination
and unallocated
items

Total

Net revenues 

$ 1,731,803

$ 106,135

$ (144,067)

$ 1,693,871

Cost of revenues

1,346,248

71,757

(229,164)

1,188,841

Gross profit

385,555

34,378

85,097

505,030

Operating expenses

264,815

108,815

3,967

377,597

Income (loss) from
   operations

120,740

(74,437)

81,130

127,433

Other segment items (1)

(46,299)

Income before income taxes
   and equity in losses of
   affiliates

81,134

Supplementary Information:

Interest expense

$ (15,983)

$ (25,521)

$ (3,303)

$ (44,807)

Interest income

7,264

2,296

360

9,920

Depreciation and
   amortization, included in
   cost of revenues and
   operating expenses

131,433

14,344

145,777

Cash and cash equivalents

$ 1,454,276

$ 346,844

$ 54,914

$ 1,856,034

Restricted cash – current and
   non-current

340,258

67,917

408,175

Non-recourse borrowings

1,809,269

1,809,269

Other short-term and long-
   term borrowings

2,443,265

1,478,119

3,921,384

Convertible notes – non-
   current

274,510

274,510

Green bonds – non-current

163,586

163,586

Select Financial Data – CSI Solar and Recurrent Energy

Six Months Ended June 30, 2025

(In Thousands of U.S. Dollars)

CSI Solar

Recurrent Energy

Elimination and unallocated items

Total

Net revenues 

$ 2,922,061

$ 231,377

$ (262,942)

$ 2,890,496

Cost of revenues

2,376,968

173,715

(305,711)

2,244,972

Gross profit

545,093

57,662

42,769

645,524

Operating expenses

422,516

144,096

6,284

572,896

Income (loss) from operations

122,577

(86,434)

36,485

72,628

Other segment items (1)

(87,225)

Loss before income taxes and
   equity in losses of affiliates

(14,597)

Supplementary Information:

Interest expense

$ (32,865)

$ (46,490)

$ (5,939)

$ (85,294)

Interest income

15,338

5,974

704

22,016

Depreciation and amortization,
 included in cost of revenues
and operating expenses

261,276

28,216

289,492

(1) Includes interest expense, net, loss on change in fair value of derivatives, net, foreign exchange loss, net and investment income, net.


The following table summarizes the revenues generated from each product or service.

Three Months
Ended

June 30, 2025

Three Months
Ended

March 31, 2025

Three Months
Ended

June 30, 2024

(In Thousands of U.S. Dollars)

CSI Solar:

Solar modules

$ 1,022,266

$ 797,422

$ 1,207,816

Solar system kits

73,812

85,526

114,869

Battery energy storage solutions

432,399

155,310

225,805

EPC and others

61,613

35,037

36,418

Subtotal

1,590,090

1,073,295

1,584,908

Recurrent Energy:

Solar power and battery energy storage asset
sales

48,091

72,151

12,752

Power services

18,809

16,499

16,853

Revenue from electricity, battery energy storage
operations and others

36,881

34,680

20,920

Subtotal

103,781

123,330

50,525

Total net revenues

$ 1,693,871

$ 1,196,625

$ 1,635,433


Six Months Ended

June 30, 2025

Six Months Ended

June 30, 2024

(In Thousands of U.S. Dollars)

CSI Solar:

Solar modules

$ 1,819,688

$ 2,119,966

Solar system kits

159,338

214,116

Battery energy storage solutions

587,709

477,278

EPC and others

96,650

63,226

Subtotal

2,663,385

2,874,586

Recurrent Energy:

Solar power and battery energy storage asset
sales

120,242

18,796

Power services

35,308

31,009

Revenue from electricity, battery energy storage
operations and others

71,561

40,153

Subtotal

227,111

89,958

Total net revenues

$ 2,890,496

$ 2,964,544


Canadian Solar Inc.

Unaudited Condensed Consolidated Statements of Operations

(In Thousands of U.S. Dollars, Except Share and Per Share Data)

Three Months Ended

Six Months Ended

June 30,

March 31,

June 30,

June 30,

June 30,

2025

2025

2024

2025

2024

Net revenues

$ 1,693,871

$ 1,196,625

$ 1,635,433

$ 2,890,496

$ 2,964,544

Cost of revenues

1,188,841

1,056,131

1,353,339

2,244,972

2,429,697

Gross profit

505,030

140,494

282,094

645,524

534,847

Operating expenses:

Selling and distribution
expenses

109,479

90,767

131,692

200,246

220,104

General and administrative
expenses

252,671

105,651

100,911

358,322

195,604

Research and development
expenses

24,719

24,284

25,578

49,003

59,857

Other operating income, net

(9,272)

(25,403)

(23,737)

(34,675)

(37,440)

Total operating expenses

377,597

195,299

234,444

572,896

438,125

Income (loss) from operations

127,433

(54,805)

47,650

72,628

96,722

Other income (expenses):

Interest expense

(44,807)

(40,487)

(33,022)

(85,294)

(67,889)

Interest income

9,920

12,096

14,122

22,016

48,424

Gain (loss) on change in fair
value of derivatives, net

(5,760)

(9,039)

81

(14,799)

(16,613)

Foreign exchange gain
(loss), net

(7,318)

(4,586)

12,486

(11,904)

25,399

Investment income (loss),
net

1,666

1,090

(835)

2,756

(666)

Total other expenses

(46,299)

(40,926)

(7,168)

(87,225)

(11,345)

Income (loss) before income
taxes and equity in earnings
(losses) of affiliates

81,134

(95,731)

40,482

(14,597)

85,377

Income tax benefit (expense)

(34,311)

23,122

(5,283)

(11,189)

(14,960)

Equity in losses of affiliates

(2,053)

(4,045)

(7,775)

(6,098)

(6,770)

Net income (loss)

44,770

(76,654)

27,424

(31,884)

63,647

Less: net income (loss)
attributable to non-controlling
interests and redeemable non-
controlling interests

37,573

(42,683)

23,602

(5,110)

47,473

Net income (loss) attributable
to Canadian Solar Inc.

$ 7,197

$ (33,971)

$ 3,822

$ (26,774)

$ 16,174

Earnings (loss) per share – basic

$ (0.08)

$ (0.69)

$ 0.02

$ (0.77)

$ 0.21

Shares used in computation –
basic

67,167,296

66,962,686

66,413,750

67,065,556

66,289,155

Earnings (loss) per share –
diluted

$ (0.08)

$ (0.69)

$ 0.02

$ (0.77)

$ 0.21

Shares used in computation –
diluted

67,167,296

66,962,686

66,984,783

67,065,556

66,813,754


 Canadian Solar Inc.

Unaudited Condensed Consolidated Statement of Comprehensive Income (Loss)

(In Thousands of U.S. Dollars)

Three Months Ended

Six Months Ended

June 30,

March 31,

June 30,

June 30,

June 30,

2025

2025

2024

2025

2024

Net income (loss)

$ 44,770

$ (76,654)

$ 27,424

$ (31,884)

$ 63,647

Other comprehensive income (loss), net of tax:

Foreign currency
translation adjustment

95,175

2,091

(59,897)

97,266

(113,710)

Gain (loss) on changes
in fair value of available-
for-sale debt securities

865

(504)

769

361

1,649

Gain (loss) on interest
rate swap

(8,148)

(3,081)

(481)

(11,229)

484

Share of gain (loss) on
changes in fair value of
interest rate swap of
affiliate

(629)

(1,232)

(159)

(1,861)

975

Comprehensive income (loss)

132,033

(79,380)

(32,344)

52,653

(46,955)

Less: comprehensive
income (loss) attributable

to non-controlling
interests and
redeemable non-
controlling interests

41,855

(40,768)

15,637

1,087

35,974

Comprehensive income
(loss) attributable to
Canadian Solar Inc.

$ 90,178

$ (38,612)

$ (47,981)

$ 51,566

$ (82,929)


Canadian Solar Inc.

Unaudited Condensed Consolidated Balance Sheets

(In Thousands of U.S. Dollars)

June 30,

December 31,

2025

2024

ASSETS

Current assets:

Cash and cash equivalents

$ 1,856,034

$ 1,701,487

Restricted cash

388,025

551,387

Accounts receivable trade, net

915,302

1,118,770

Accounts receivable, unbilled

176,542

142,603

Amounts due from related parties

2,874

5,220

Inventories

1,247,923

1,206,595

Value added tax recoverable

232,744

221,539

Advances to suppliers, net

211,625

124,440

Derivative assets

10,936

14,025

Project assets

371,434

394,376

Prepaid expenses and other current assets

796,174

436,635

Total current assets

6,209,613

5,917,077

Restricted cash

20,150

11,147

Property, plant and equipment, net

3,307,521

3,174,643

Solar power and battery energy storage systems,
net

1,981,087

1,976,939

Deferred tax assets, net

397,146

473,500

Advances to suppliers, net

97,985

118,124

Investments in affiliates

262,015

232,980

Intangible assets, net

32,212

31,026

Project assets

1,347,421

889,886

Right-of-use assets

430,534

378,548

Amounts due from related parties

78,150

75,215

Other non-current assets

648,097

232,465

TOTAL ASSETS

$ 14,811,931

$ 13,511,550


Canadian Solar Inc.

Unaudited Condensed Consolidated Balance Sheets (Continued)

(In Thousands of U.S. Dollars)

June 30,

December 31,

2025

2024

LIABILITIES, REDEEMABLE INTERESTS AND EQUITY

Current liabilities:

Short-term borrowings

$ 2,275,211

$ 1,873,306

Convertible notes

228,917

Accounts payable

1,016,152

1,062,874

Short-term notes payable

610,288

637,512

Amounts due to related parties

3,427

3,927

Other payables

1,040,789

984,023

Advances from customers

143,224

204,826

Derivative liabilities

2,336

13,738

Operating lease liabilities

24,972

21,327

Other current liabilities

559,163

388,460

Total current liabilities

5,675,562

5,418,910

Long-term borrowings

3,455,442

2,731,543

Convertible notes

274,510

Green bonds

163,586

146,542

Liability for uncertain tax positions

5,770

5,770

Deferred tax liabilities

119,790

204,832

Operating lease liabilities

321,310

271,849

Other non-current liabilities

620,101

582,301

TOTAL LIABILITIES

10,636,071

9,361,747

Redeemable non-controlling interests

205,363

247,834

Equity:

Common shares

835,543

835,543

Additional paid-in capital

575,449

590,578

Retained earnings

1,558,984

1,585,758

Accumulated other comprehensive loss

(115,175)

(196,379)

Total Canadian Solar Inc. shareholders’ equity

2,854,801

2,815,500

Non-controlling interests

1,115,696

1,086,469

TOTAL EQUITY

3,970,497

3,901,969

TOTAL LIABILITIES, REDEEMABLE
INTERESTS AND EQUITY

$ 14,811,931

$ 13,511,550


Canadian Solar Inc.

Unaudited Condensed Statements of Cash Flows

(In Thousands of U.S. Dollars)

Three Months Ended

Six Months Ended

June 30,

March 31,

June 30,

June 30,

June 30,

2025

2025

2024

2025

2024

Operating Activities:

Net income (loss)

$ 44,770

$ (76,654)

$ 27,424

$ (31,884)

$ 63,647

Adjustments to net
income (loss)

366,084

161,770

174,201

527,854

332,551

Changes in operating
assets and liabilities

(222,298)

(349,319)

(630,963)

(571,617)

(1,117,023)

Net cash provided by
(used in) operating
activities

188,556

(264,203)

(429,338)

(75,647)

(720,825)

Investing Activities:

Purchase of property,
plant and equipment
and intangible assets

(172,729)

(256,380)

(390,248)

(429,109)

(660,310)

Purchase of solar
power and battery
energy storage systems

(219,695)

(128,707)

(10,936)

(348,402)

(184,277)

Other investing
activities

(55,882)

(83,897)

2,515

(139,779)

12,947

Net cash used in investing
activities

(448,306)

(468,984)

(398,669)

(917,290)

(831,640)

Financing Activities:

Proceeds from
subsidiary’s issuance of
preferred shares, net

297,000

297,000

Capital contributions
from tax equity
investors in subsidiaries

14,680

14,680

Repurchase of shares
by subsidiary

(24,221)

(21,404)

(70,624)

(45,625)

(70,624)

Other financing
activities

495,276

550,962

(38,778)

1,046,238

684,634

Net cash provided by
financing activities

471,055

544,238

187,598

1,015,293

911,010

Effect of exchange rate
changes

18,985

(41,153)

(61,483)

(22,168)

(112,736)

Net increase (decrease) in
cash, cash equivalents
and restricted cash

230,290

(230,102)

(701,892)

188

(754,191)

Cash, cash equivalents
and restricted cash at
the beginning of the period

$ 2,033,919

$ 2,264,021

$ 2,894,133

$ 2,264,021

$ 2,946,432

Cash, cash equivalents and restricted
cash at the end of the period

$ 2,264,209

$ 2,033,919

$ 2,192,241

$ 2,264,209

$ 2,192,241


About Non-GAAP Financial Measures

This press release also contains adjusted net income (loss) attributable to Canadian Solar Inc. and adjusted earnings (loss) per share – diluted that are not determined in accordance with GAAP. These non-GAAP financial measures should not be considered as an alternative to net income (loss) attributable to Canadian Solar Inc. or earnings (loss) per share, respectively, each of which is an indicator of financial performance determined in accordance with GAAP. Adjusted net income (loss) attributable to Canadian Solar Inc. and adjusted earnings (loss) per share – diluted exclude from net income (loss) attributable to Canadian Solar Inc. and earnings (loss) per share certain items that the Company does not consider indicative of its ongoing financial performance such as the effects of HLBV method to account for its tax equity arrangements. Management uses these non-GAAP financial measures to facilitate the analysis and communication of the Company’s financial performance as compared to its previous financial results. Management believes that these non-GAAP financial measures are also useful and meaningful to investors to facilitate their analysis of the Company’s financial performance. These non-GAAP measures may differ from non-GAAP measures used by other companies, and therefore their comparability may be limited.

The table below provides a reconciliation of our GAAP net income (loss) to non-GAAP financial measures.

Three Months Ended

Six Months Ended

June 30,

March 31,

June 30,

June 30,

June 30,

2025

2025

2024

2025

2024

GAAP net income (loss)
attributable to Canadian Solar
Inc.

$ 7,197

$ (33,971)

$ 3,822

$ (26,774)

$ 16,174

Non-GAAP income
adjustment items:

Less: HLBV effects

(30,248)

(25,902)

(56,150)

Non-GAAP adjusted net
income (loss) attributable to
Canadian Solar Inc.

$ (23,051)

$ (59,873)

$ 3,822

$ (82,924)

$ 16,174

GAAP earnings (loss) per
share – diluted

$ (0.08)

$ (0.69)

$ 0.02

$ (0.77)

$0.21

Non-GAAP income adjustment items:

Less: HLBV effects

(0.45)

(0.38)

(0.83)

Add: HLBV effects
attributable to redeemable
non-controlling interests

Non-GAAP adjusted earnings
(loss) per share – diluted

$ (0.53)

$ (1.07)

$ 0.02

$ (1.60)

$0.21

Shares used in computation –
diluted (GAAP)

67,167,296

66,962,686

66,984,783

67,065,556

66,813,754

Shares used in computation –
diluted (Non-GAAP)

67,167,296

66,962,686

66,984,783

67,065,556

66,813,754


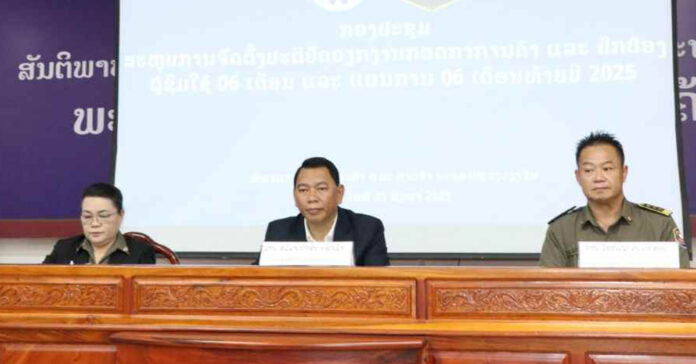
Vientiane Cracks Down on Business Violations, Fines Over LAK 338 Million

Vientiane Capital inspected 98 businesses in mid-2025, fined 13 units LAK 290 million (about USD 13,000).

In the first half of 2025, the Vientiane Capital Department of Industry and Commerce inspected 98 businesses and fined 13 units a total of LAK 290 million (about USD 13,000).

Presenting the report at a meeting on 21 August, Manosack Xaysilikoun, Deputy Director of Internal Trade of Vientiane Capital, highlighted that the main violations included operating without a business license, price violations, and failure to label products in the Lao language.

Authorities also confiscated illegal goods, including 25 tons of frozen pork parts, 437 cartons of untaxed cigarettes, 45 cases of imported liquor, and 36 packs of illegally imported beer, with a total value of nearly LAK 380 million (around USD 18,000).

At the district level, inspections covered 477 businesses and 10 markets, uncovering 39 violations. 

Fines totaling LAK 48.7 million were issued, primarily against unregistered businesses, along with cases of improper labeling and other breaches.

SINGZYME WINS 2025 AMGEN X NSG GOLDEN TICKET FOR BREAKTHROUGH BIOCONJUGATION PLATFORM

Now in its fourth year, the programme continues to empower biotech startups through ecosystem support and collaboration to advance science that serves patients.

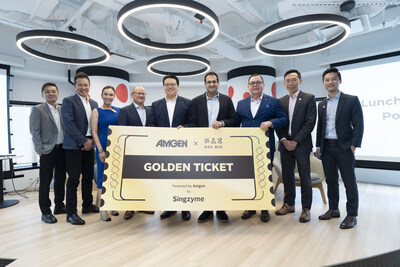
SINGAPORE, Aug. 21, 2025 /PRNewswire/ — Singzyme, a Singapore-based biotech startup pioneering next-generation bioconjugation solutions, has been named the winner of the 2025 Golden Ticket Programme in Singapore. The award is part of a joint programme by Amgen, a U.S.-based leader in biologic medicines and NSG BioLabs, Singapore’s leading provider of biotechnology co-working laboratories and offices.

Singzyme wins 2025 Amgen x NSG BioLabs Golden Ticket

Now in its fourth year, the Golden Ticket Programme supports promising biotech startups by providing infrastructure, mentorship, and resources to advance scientific progress and talent development in accelerating the development of new therapies. As this year’s awardee, Singzyme will receive a one-year residency at NSG BioLabs, along with access to certified BSL-2 lab facilities and networking opportunities through Amgen’s community of scientific and business leaders.

Singzyme was selected from a competitive pool of six finalists following an interactive pitch session reviewed by Amgen’s internal scientific committee. The startup stood out for its proprietary Peptide Asparaginyl Ligase (PAL) platform, a novel site-specific conjugation technology that addresses key challenges in the manufacturing of antibody-drug conjugates (ADCs) and other complex biologics. The platform holds strong potential for enabling safer, more precise, and efficient production of next-generation targeted therapies.

“Singzyme’s novel platform reflects the strong scientific thinking and innovation emerging from Singapore’s biotech sector,” said Dr Alan Russell, Vice President for Research Biologics at Amgen. “It’s encouraging to see creative approaches to longstanding challenges in bioconjugation, and we’re pleased to be part of an initiative that helps spotlight and connect promising science with broader networks in the industry that aligns with Amgen’s mission to deliver impactful therapies to serve patients.” 

Ms Daphne Teo, CEO and Founder of NSG BioLabs, added, “The Golden Ticket Programme provides a valuable stepping stone for biotech startups at critical stages of their journey. As Singapore’s life sciences community continues to expand, it’s exciting to support companies like Singzyme as they bring their ideas to life and move closer to the clinic in Singapore’s growing vibrant biotech industry.”

Mr Abbas Sahili, Chief Technology Officer, inventor and founding team member of Singzyme, said, “This award validates the transformative potential of Singzyme’s peptide ligation technology to enable the next generation of precision medicines. The Golden Ticket is a significant recognition of our PAL platform’s ability to address critical unmet needs in biologics development – not only in oncology, but across diverse modalities and disease areas.”

Mr Wee Kiat Tan, CEO of Singzyme, said, “With this support, we are committed to advancing our platform toward clinical applications in oncology and beyond. Through this collaboration, we will continue to strengthen our capabilities and accelerate the delivery of impactful therapies to patients worldwide.”

Singzyme joins a growing list of previous Golden Ticket recipients in Singapore, including Albatroz Therapeutics, VerImmune, and PairX Bio. These companies have leveraged the programme’s access and visibility to further their research, raise funding, and expand partnerships. Albatroz secured US$3 million in seed funding to advance its drug development programmes, while VerImmune’s recent closure of the first half of its Pre-Series A round reflects strong confidence in its platform and trajectory.

Unlocking Biotech Growth Through Cross-Sector Collaboration

Accelerating biotech startups takes more than breakthrough science, it requires the right mix of mentorship, infrastructure, and collaboration. This was the key message shared at a panel discussion held at the award ceremony, titled “Powering Biotech Breakthroughs: Scaling Science Through Cross-Sector Collaboration.” Speakers from Amgen, ClavystBio, and the Singapore Economic Development Board (EDB) discussed how cross-sector collaboration is helping startups progress from scientific concepts to real-world applications. The discussion emphasized the importance of a dynamic ecosystem – one that offers shared infrastructure, strong talent pipelines, and access to mentorship – to support biotech ventures and enable researchers and entrepreneurs to grow and scale globally.

“We are growing Singapore’s biotech leadership via three key drivers – access to capital, a strong talent pool, and strategic partnerships,” said Mr Chen Pengfei, Vice President for Healthcare of EDB. “Beyond a strong scientific community, a vibrant entrepreneurship ecosystem is critical to bringing innovations to market. We hope to forge more collaborations with key stakeholders including academic and biotech companies, to unlock greater growth opportunities from Singapore.”

For more information on Golden Ticket Programme, visit https://nsgbio.com/nsg-bio-tomorrow/

About Amgen 

Amgen discovers, develops, manufactures and delivers innovative medicines to help millions of patients in their fight against some of the world’s toughest diseases. More than 40 years ago, Amgen helped to establish the biotechnology industry and remains on the cutting-edge of innovation, using technology and human genetic data to push beyond what’s known today. Amgen is advancing a broad and deep pipeline that builds on its existing portfolio of medicines to treat cancer, heart disease, osteoporosis, inflammatory diseases and rare diseases.

In 2024, Amgen was named one of the “World’s Most Innovative Companies” by Fast Company and one of “America’s Best Large Employers” by Forbes, among other external recognitions. Amgen is one of the 30 companies that comprise the Dow Jones Industrial Average®, and it is also part of the Nasdaq-100 Index®, which includes the largest and most innovative non-financial companies listed on the Nasdaq Stock Market based on market capitalization.

For more information, visit Amgen.com and follow Amgen on X, LinkedIn, Instagram, TikTok, YouTube and Threads

About NSG BioLabs

Founded with a focus on supporting biotech innovation, NSG BioLabs offers state-of-the-art equipment, efficient operations, capital efficiency, the expertise of world-class teams and global networks to assist life sciences companies. The conducive R&D environment contains fully-equipped, certified BSL-2 laboratory and office infrastructure across 70,000 sq ft within Singapore’s biomedical science clusters, Biopolis and Singapore Science Park.

By providing access to high-quality infrastructure, its extensive partner network, community, and value-add benefits, NSG BioLabs ensures that companies, ranging from emerging biotech startups to multinational companies, can rapidly and efficiently execute on their cutting-edge research and development ecosystem in Singapore, leading to the innovation of revolutionary technologies and products that translate into breakthrough biotech ventures and impact for patients. For more information, visit www.nsgbio.com

About Singzyme

Singzyme is a Singapore-based biotechnology company pioneering next-generation bioconjugation solutions for the manufacturing of antibody-drug conjugates (ADCs) and other complex biologics. Its proprietary Peptide Asparaginyl Ligase (PAL) based conjugation platform enables highly precise, efficient, and scalable site-specific conjugation of payloads to antibodies and other proteins. By combining breakthrough enzymatic technology with deep expertise in protein engineering, Singzyme empowers partners to accelerate the development of safer, more effective targeted therapies. For more information visit www.singzyme.com

Dingdong (Cayman) Limited Announces Second Quarter 2025 Financial Results

SHANGHAI, Aug. 21, 2025 /PRNewswire/ — Dingdong (Cayman) Limited (“Dingdong” or the “Company”) (NYSE: DDL), a leading fresh grocery e-commerce company in China, with advanced supply chain capabilities, today announced its unaudited financial results for the quarter ended June 30, 2025.

Second Quarter 2025 Highlights: 

  • GMV for the second quarter of 2025 increased by 4.5% year over year to RMB6,499.4 million (US$907.3 million) from RMB6,218.7 million in the same quarter of 2024, positive year-on-year growth for six straight quarters.
  • Total number of orders increased by 5.5% year over year in the second quarter of 2025.
  • Net income for the second quarter of 2025 increased by 59.7% year over year to RMB107.2 million (US$15.0 million) from RMB67.1 million in the same quarter of 2024, the sixth consecutive quarter of profitability.
  • Non-GAAP net income for the second quarter of 2025 increased by 23.9% year over year to RMB127.8 million (US$17.8 million) from RMB103.1 million in the same quarter of 2024, the eleventh consecutive quarter of non-GAAP profitability.

Mr. Changlin Liang, Founder and Chief Executive Officer of Dingdong, stated, “As of the second quarter of 2025, Dingdong has achieved eleven straight quarters of non-GAAP profitability and six straight quarters of GAAP profitability, along with six consecutive quarters of positive year-over-year revenue growth. This consistent growth in scale and profitability not only shows that we have overcome the challenge of survival but also proves the resilience and execution capabilities of the Dingdong team, laying a strong foundation for the next phase of higher-quality growth. By the end of the second quarter, Dingdong’s 4G strategy—centered on “good users, good products, good service, and good mindshare”—had been in place for six months. While the Company is still transforming, it has achieved steady year-over-year growth. Additionally, through adjustments in production relations and productivity improvements, the 4G strategy has already begun to show results. The Company remains focused on developing high-quality products, aiming to create more offerings that are well-received, commercially successful, and distinctive. Our principle is “Where others fall short, we deliver. Where others deliver, we excel. Where others excel, we redefine.” Operational metrics aligned with the 4G strategy continue to improve steadily.”

Mr. Song Wang, Chief Financial Officer of Dingdong, stated, “In the second quarter of 2025, Dingdong generated revenue of RMB5.98 billion, a 6.7% year-on-year increase, marking six consecutive quarters of positive growth. Non-GAAP net profit reached RMB127.8 million, with a net margin of 2.1%, up 0.3 percentage points year-on-year. GAAP net profit was RMB107.2 million, with a net margin of 1.8%, an increase of 0.6 percentage points. In terms of funds, the second quarter recorded a net cash inflow of RMB101.4 million from operating activities, the eighth straight quarter of positive cash flow. By the end of the second quarter, after deducting short-term borrowings, our actual cash owned increased to RMB2.95 billion. Dingdong has been focused on the instant retail and fresh grocery e-commerce sectors for over eight years. Our ongoing profitability and rising cash flow reinforce our commitment to the value proposition “narrow and deep.” Despite external changes, we will remain fully dedicated to the fresh grocery vertical, investing continuously in high-quality products and supply chains, following our unique path.”

Second Quarter 2025 Financial Results

Total revenues were RMB5,975.9 million (US$834.2 million) compared with total revenues of RMB5,599.0 million in the same quarter of 2024, increased by 6.7% year over year, primarily due to the rise of number of orders resulting from rise in the average monthly number of transacting users and higher monthly order frequency, and new opened frontline fulfillment stations with density and market penetration improved in East China. The increase was offset by suspension of operations for a number of stations in the last three quarters of 2024, and the impact of the decline in CPI prices of certain categories in the second quarter of 2025.

  • Product Revenues were RMB5,893.7 million (US$822.7 million) compared with product revenues of RMB5,517.9 million in the same quarter of 2024, increased by 6.8% year over year.
  • Service Revenues were RMB82.1 million (US$11.5 million) compared with service revenues of RMB81.1 million in the same quarter of 2024, increased by 1.3% year over year.

Total operating costs and expenses were RMB5,980.1 million (US$834.8 million) compared with RMB5,612.8 million in the same quarter of 2024, with a detailed breakdown as below:

  • Cost of goods sold was RMB4,255.2 million (US$594.0 million), an increase of 8.6% from RMB3,919.4 million in the same quarter of 2024. Cost of goods sold as a percentage of revenues increased to 71.2% from 70.0% in the same quarter of 2024. Gross margin decreased to 28.8% from 30.0% in the same quarter of 2024. The cost implications arising from product listing and delisting due to the implementation of 4G strategy of “good users, good products, good services, and good mindshare”.
  • Fulfillment expenses were RMB1,297.3 million (US$181.1 million), an increase of 3.5% from RMB1,252.9 million in the same quarter of 2024. Fulfillment expenses as a percentage of total revenues decreased to 21.7% from 22.4% in the same quarter of 2024.
  • Sales and marketing expenses were RMB102.9 million (US$14.4 million), a decrease of 20.6% from RMB129.7 million in the same quarter of 2024. Sales and marketing expenses as a percentage of total revenues decreased to 1.7% from 2.3% in the same quarter of 2024. The traffic and promotional effects generated by the Good Products Strategy have replaced some of the original marketing campaigns, thereby saving corresponding expenses.
  • General and administrative expenses were RMB122.9 million (US$17.2 million), an increase of 13.6% from RMB108.2 million in the same quarter of 2024, mainly due to the increase of staff cost.
  • Product development expenses were RMB201.8 million (US$28.2 million), a slightly decrease of 0.4% from RMB202.7 million in the same quarter of 2024. While advocating for energy and resource saving, we will continue to invest in our product development capabilities, agricultural technology, data algorithms, and other technology infrastructure such as the AI technical capability, to further enhance our competitiveness.

Net income from operations was RMB81.6 million (US$11.4 million), compared with net income from operations of RMB53.6 million in the same quarter of 2024.

Non-GAAP income from operations, which is a non-GAAP measure for loss from operations that excludes share-based compensation expenses, was RMB102.2 million (US$14.3 million), increased by 14.1% year over year, compared with Non-GAAP income from operations of RMB89.6 million in the same quarter of 2024.

Net income was RMB107.2 million (US$15.0 million), compared with net income of RMB67.1 million in the same quarter of 2024.

Non-GAAP net income, which is a non-GAAP measure that excludes share-based compensation expenses, was RMB127.8 million (US$17.8 million), increased by 23.9% year over year, compared with non-GAAP net income of RMB103.1 million in the same quarter of 2024. In addition, non-GAAP net income margin, which is the Company’s non-GAAP net income as a percentage of total revenues, was 2.1% compared with 1.8% in the same quarter of 2024.

Basic and diluted net income per share were RMB0.32 and RMB0.31 (US$0.04), compared with net income per share of RMB0.20 in the same quarter of 2024. Non-GAAP net income per share, basic and diluted, were RMB0.39 and RMB0.37 (US$0.05), compared with RMB0.31 in the same quarter of 2024.

Cash and cash equivalents, restricted cash and short-term investments were RMB3,974.2 million (US$554.8 million) as of June 30, 2025, compared with RMB4,294.5 million as of March 31, 2025. We have been working diligently to optimize our capital usage and financing structure. The cash and cash equivalents, restricted cash, short-term investments and long-term deposits as included in the other non-current assets deducting the balance of short-term borrowings, is RMB2.95 billion, a net increase for the eighth consecutive quarter, compared with RMB2.89 billion as of March 31, 2025.

Guidance

The Company is looking to maintain scale year-over-year and achieve non-GAAP profits in the third quarter of 2025.

Conference Call

The Company’s management will hold an earnings conference call at 8:00 A.M. Eastern Time on Thursday, August 21, 2025 (8:00 P.M. Beijing Time on the same day) to discuss the financial results. The presentation and question and answer session will be presented in both Mandarin and English. Listeners may access the call by dialing the following numbers:

International:

1-412-317-6061

United States Toll Free:

1-888-317-6003

Mainland China Toll Free:

86-4001-206115

Hong Kong Toll Free:

800-963976

Conference ID:

0358096

The replay will be accessible through August 28, 2025 by dialing the following numbers:

International:

1-412-317-0088

United States:

1-877-344-7529

Access Code:

5040747

A live and archived webcast of the conference call will also be available at the Company’s investor relations website at https://ir.100.me.

About Dingdong (Cayman) Limited 

We are a leading fresh grocery e-commerce company in mainland China, with sustainable long-term growth. We directly provide users and households with fresh groceries, prepared food, and other food products through delivering a convenient and excellent shopping experience supported by an extensive self-operated frontline fulfillment grid. Leveraging our deep insights into consumers’ evolving needs and our strong food innovation capabilities, we have successfully launched a series of private label products spanning a variety of food categories. Many of our private label products are produced at our Dingdong production plants, allowing us to more efficiently produce and offer safe and high-quality food products. We aim to be the first choice for fresh and food shopping.

For more information, please visit: https://ir.100.me.

Use of Non-GAAP Financial Measures

The Company uses non-GAAP measures, such as non-GAAP net income, non-GAAP net income margin, non-GAAP net income attributable to ordinary shareholders and non-GAAP net income per share, basic and diluted, in evaluating its operating results and for financial and operational decision-making purposes. The Company believes that the non-GAAP financial measures help identify underlying trends in its business by excluding the impact of share-based compensation expenses, which are non-cash charges and do not correlate to any operating activity trends. The Company believes that the non-GAAP financial measures provide useful information about the Company’s results of operations, enhance the overall understanding of the Company’s past performance and future prospects and allow for greater visibility with respect to key metrics used by the Company’s management in its financial and operational decision-making.

The non-GAAP financial measures are not defined under U.S. GAAP and are not presented in accordance with U.S. GAAP. The non-GAAP financial measures have limitations as analytical tools, and when assessing the Company’s operating performance, cash flows or liquidity, investors should not consider them in isolation, or as a substitute for net loss, cash flows provided by operating activities or other consolidated statements of operations and cash flows data prepared in accordance with U.S. GAAP. The Company’s definition of non-GAAP financial measures may differ from those of industry peers and may not be comparable with their non-GAAP financial measures.

The Company mitigates these limitations by reconciling the non-GAAP financial measures to the most comparable U.S. GAAP performance measures, all of which should be considered when evaluating the Company’s performance.

For more information on the non-GAAP financial measures, please see the table captioned “Unaudited Reconciliation of GAAP and Non-GAAP Results” set forth at the end of this announcement.

Exchange Rate Information

This announcement contains translations of certain RMB amounts into U.S. dollars (“US$”) at specified rates solely for the convenience of the reader. Unless otherwise stated, all translations from RMB to US$ were made at the rate of RMB7.1636 to US$1.00, the exchange rate on June 30, 2025 set forth in the H.10 statistical release of the Federal Reserve Board. The Company makes no representation that the RMB or US$ amounts referred could be converted into US$ or RMB, as the case may be, at any particular rate or at all.

Safe Harbor Statement 

This announcement contains forward-looking statements. These statements are made under the “safe harbor” provisions of the U.S. Private Securities Litigation Reform Act of 1995. These forward-looking statements can be identified by terminology such as “will,” “expects,” “anticipates,” “aims,” “future,” “intends,” “plans,” “believes,” “estimates,” “confident,” “potential,” “continue,” or other similar expressions. Among other things, business outlook and quotations from management in this announcement, as well as Dingdong’s strategic and operational plans, contain forward-looking statements. Dingdong may also make written or oral forward-looking statements in its periodic reports to the U.S. Securities and Exchange Commission (the “SEC”), in its interim and annual reports to shareholders, in press releases and other written materials and in oral statements made by its officers, directors or employees to third parties. Statements that are not historical facts, including but not limited to statements about Dingdong’s beliefs and expectations, are forward-looking statements. Forward-looking statements involve inherent risks and uncertainties. A number of factors could cause actual results to differ materially from those contained in any forward-looking statement, including but not limited to the following: Dingdong’s goals and strategies; Dingdong’s future business development, financial conditions, and results of operations; the expected outlook of the fresh grocery ecommerce market in China; Dingdong’s expectations regarding demand for and market acceptance of its products and services; Dingdong’s expectations regarding its relationships with its users, clients, business partners, and other stakeholders; competition in Dingdong’s industry; and relevant government policies and regulations relating to Dingdong’s industry, and general economic and business conditions globally and in China and assumptions underlying or related to any of the foregoing. Further information regarding these and other risks is included in the Company’s filings with the SEC. All information provided in this announcement and in the attachments is as of the date of the announcement, and the Company undertakes no duty to update such information, except as required under applicable law.


DINGDONG (CAYMAN) LIMITED 

UNAUDITED CONDENSED CONSOLIDATED BALANCE SHEETS

(Amounts in thousands of RMB and US$)

As of

December 31,
2024

June 30,

2025

June 30,

2025

RMB

RMB

US$

 (Unaudited)

ASSETS

Current assets:

Cash and cash equivalents

887,427

926,209

129,294

Restricted cash

2,788

1,630

228

Short-term investments

3,561,977

3,046,326

425,251

Accounts receivable, net

125,896

136,912

19,112

Inventories, net

553,601

504,934

70,486

Advance to suppliers

62,730

96,275

13,439

Prepayments and other current assets

170,753

193,875

27,064

Total current assets

5,365,172

4,906,161

684,874

Non-current assets:

Property and equipment, net

176,290

196,384

27,414

Operating lease right-of-use assets

1,464,791

1,509,628

210,736

Other non-current assets

111,395

145,938

20,372

Total non-current assets

1,752,476

1,851,950

258,522

TOTAL ASSETS

7,117,648

6,758,111

943,396

LIABILITIES, MEZZANINE EQUITY AND

SHAREHOLDERS’ EQUITY

Current liabilities:

Accounts payable

1,660,472

1,782,194

248,784

Customer advances and deferred revenue

279,276

249,154

34,781

Accrued expenses and other current
    liabilities


767,082

755,559

105,472

Salary and welfare payable

317,152

218,035

30,437

Operating lease liabilities, current

640,245

667,992

93,248

Short-term borrowings

1,606,253

1,061,954

148,243

Total current liabilities

5,270,480

4,734,888

660,965

Non-current liabilities:

Operating lease liabilities, non-current

780,036

805,058

112,382

Other non-current liabilities

143,118

145,122

20,258

Total non-current liabilities

923,154

950,180

132,640

TOTAL LIABILITIES

6,193,634

5,685,068

793,605


DINGDONG (CAYMAN) LIMITED 

UNAUDITED CONDENSED CONSOLIDATED BALANCE SHEETS (CONTINUED)

(Amounts in thousands of RMB and US$)

As of

December 31,

2024

June 30,

2025

June 30,

2025

RMB

RMB

US$

(Unaudited)

LIABILITIES, MEZZANINE EQUITY AND

SHAREHOLDERS’ EQUITY (CONTINUED)

Mezzanine Equity:

Redeemable noncontrolling interests

125,403

130,282

18,187

TOTAL MEZZANINE EQUITY

125,403

130,282

18,187

Shareholders’ equity:

Ordinary shares

4

4

1

Additional paid-in capital

14,181,030

14,224,126

1,985,610

Treasury stock

(51,176)

(51,176)

(7,144)

Accumulated deficit

(13,384,881)

(13,274,555)

(1,853,056)

Accumulated other comprehensive income

53,634

44,362

6,193

TOTAL SHAREHOLDERS’ EQUITY

798,611

942,761

131,604

TOTAL LIABILITIES, MEZZANINE EQUITY AND SHAREHOLDERS’ EQUITY


7,117,648

6,758,111

943,396


DINGDONG (CAYMAN) LIMITED 

UNAUDITED CONDENSED CONSOLIDATED STATEMENTS OF COMPREHENSIVE (LOSS)/INCOME

(Amounts in thousands of RMB and US$, except for number of shares and per share data)

For the three months ended

June 30,

2024

2025

2025

 RMB 

RMB

US$

(Unaudited)

Revenues:

Product revenues

5,517,850

5,893,728

822,733

Service revenues

81,103

82,141

11,466

Total revenues

5,598,953

5,975,869

834,199

Operating costs and expenses:

Cost of goods sold

(3,919,445)

(4,255,182)

(594,001)

Fulfillment expenses

(1,252,859)

(1,297,277)

(181,093)

Sales and marketing expenses

(129,659)

(102,917)

(14,367)

Product development expenses

(202,663)

(201,822)

(28,173)

General and administrative expenses

(108,165)

(122,906)

(17,157)

Total operating costs and expenses

(5,612,791)

(5,980,104)

(834,791)

Other operating income, net

67,438

85,870

11,987

Income from operations

53,600

81,635

11,395

Interest income

37,807

33,393

4,663

Interest expenses

(14,023)

(4,820)

(673)

Other (loss)/income, net

(2,844)

783

109

Income before income tax

74,540

110,991

15,494

Income tax expenses

(7,414)

(3,804)

(531)

Net income

67,126

107,187

14,963

Accretion of redeemable noncontrolling interests

(2,292)

(2,476)

(346)

Net income attributable to ordinary shareholders

64,834

104,711

14,617


DINGDONG (CAYMAN) LIMITED

UNAUDITED CONDENSED CONSOLIDATED STATEMENTS OF COMPREHENSIVE (LOSS)/INCOME (CONTINUED)

(Amounts in thousands of RMB and US$, except for number of shares and per share data) 

For the three months ended

June 30,

2024

2025

2025

RMB

RMB

US$

(Unaudited)

Net income per Class A and Class B ordinary share:

Basic

0.20

0.32

0.04

Diluted

0.20

0.31

0.04

Shares used in net income per Class A and Class B
    ordinary share computation:

Basic

325,430,984

324,632,496

324,632,496

Diluted

329,814,651

335,355,966

335,355,966

Other comprehensive income/(loss), net of tax of nil:

Foreign currency translation adjustments

9,441

(6,141)

(857)

Comprehensive income

76,567

101,046

14,106

Accretion of redeemable noncontrolling interests

(2,292)

(2,476)

(346)

Comprehensive income attributable to ordinary
   shareholders

74,275

98,570

13,760


DINGDONG (CAYMAN) LIMITED

UNAUDITED CONDENSED CONSOLIDATED STATEMENTS OF CASH FLOWS

(Amounts in thousands of RMB and US$)

For the three months ended

June 30,

2024

2025

2025

RMB

RMB

US$

(Unaudited)

Net cash generated from operating activities

245,738

101,401

14,155

Net cash generated from/ (used in) investing activities

278,839

(46,026)

(6,425)

Net cash used in financing activities

(592,905)

(344,390)

(48,075)

Effect of exchange rate changes on cash and cash equivalents and
   restricted cash

(1,479)

(140)

(19)

Net decrease in cash and cash equivalents and restricted cash


(69,807)

(289,155)

(40,364)

Cash and cash equivalents and restricted cash at the beginning of the period

1,131,474

1,216,994

169,886

Cash and cash equivalents and restricted cash at the
   end of the period

1,061,667

927,839

129,522


DINGDONG (CAYMAN) LIMITED 

UNAUDITED RECONCILIATION OF GAAP AND NON-GAAP RESULTS

(Amounts in thousands of RMB and US$, except for number of shares and per share data)

For the three months ended
June 30,

2024

2025

2025

RMB  

RMB  

US$  

(Unaudited)

Income from operations

53,600

81,635

11,395

Add: share-based compensation expenses (1)

36,001

20,583

2,873

Non-GAAP income from operations

89,601

102,218

14,268

Operating margin

1.0 %

1.4 %

1.4 %

Add: share-based compensation expenses

0.6 %

0.3 %

0.3 %

Non-GAAP operating margin

1.6 %

1.7 %

1.7 %

Net income

67,126

107,187

14,963

Add: share-based compensation expenses (1)

36,001

20,583

2,873

Non-GAAP net income

103,127

127,770

17,836

Net income margin

1.2 %

1.8 %

1.8 %

Add: share-based compensation expenses

0.6 %

0.3 %

0.3 %

Non-GAAP net income margin

1.8 %

2.1 %

2.1 %

Net income attributable to ordinary shareholders

64,834

104,711

14,617

Add: share-based compensation expenses (1)

36,001

20,583

2,873

Non-GAAP net income attributable to ordinary
  shareholders

100,835

125,294

17,490

Net income per Class A and Class B ordinary share:

Basic

0.20

0.32

0.04

Diluted

0.20

0.31

0.04

Add: share-based compensation expenses

Basic

0.11

0.07

0.01

Diluted

0.11

0.06

0.01

Non-GAAP net income per Class A and Class B ordinary share:

Basic

0.31

0.39

0.05

Diluted

0.31

0.37

0.05


(1) Share-based compensation expenses are recognized as follows:

For the three months ended

June 30,

2024

2025

2025

RMB

RMB

US$

(Unaudited)

Fulfillment expenses

7,825

3,926

548

Sales and marketing expenses

1,844

1,387

194

Product development expenses

15,595

8,590

1,199

General and administrative expenses

10,737

6,680

932

Total

36,001

20,583

2,873


Bank of Thailand Sets THB 50,000 Daily Transfer Limit to Fight Online Fraud

The Bank of Thailand (Photo: www.bot.or.th)

Thailand bank is set to apply a measure of limiting money transfer to THB 50,000 (USD USD 1,400) per day by 2025, to prevent online scamming rate.