Home Blog Page 2849

WuXi Biologics’ WuXiUP™ Accomplishes Automated Continuous Drug Substance Production at Pilot-Scale

  • Building on its success in developing continuous production at pilot-scale with the WuXiUP™ platform, WuXi Biologics has further enhanced the technology to achieve automated continuous drug substance (DS) manufacturing at pilot-scale. This advancement integrates industry-leading technologies, including membrane chromatography and automated control systems, along with iterative enhancements to Process Analytical Technology (PAT).
  • The WuXiUP™ automated continuous production platform will deliver greater value as it boosts manufacturing efficiency and product quality, enabling clients to accelerate the journey of their innovative therapies from development to commercialization.

SHANGHAI, Aug. 12, 2025 /PRNewswire/ — WuXi Biologics (2269.HK), a leading global Contract Research, Development, and Manufacturing Organization (CRDMO), today announced that its intensified perfusion culture process platform, WuXiUP™, has achieved end-to-end, fully automated continuous drug substance(DS)production at pilot scale. The automated continuous production platform will be deployed across the company’s major GMP facilities, offering clients greater efficiency and flexibility to accelerate the journey of their innovative therapies from development to commercialization.

By fully integrating an automated system, the continuous production platform enables non-stop 24/7 operation, which minimizes manual intervention, reduces quality risks, and enhances manufacturing efficiency. In upstream processes, WuXiUPTM has accomplished exceptional performance: 24 days of continuous cell culture yields a total output that exceeds 110 g/L, with a peak daily yield of 7.6 g/L. For downstream purification, WuXiUP™ incorporates a two-step, high-efficiency membrane chromatography system. Compared to traditional resin-based stationary phases, this technology enables faster mass transfer, delivering a 5- to 10-fold increase in productivity.

To strengthen quality control throughout downstream continuous purification, WuXiUP™ employs advanced, iteratively improved Process Analytical Technology (PAT), which provides real-time monitoring and feedback on critical parameters in Harvested Clarified Cell Culture Fluid (HCCF), including protein purity, concentration, pH, and conductivity. When integrated with the automated closed-loop control system, the technology utilizes Residence Time Distribution (RTD) analysis to intelligently divert out-of-spec samples, significantly enhancing manufacturing procedure control.

Dr. Chris Chen, CEO of WuXi Biologics, commented: “The WuXiUP™ platform has already proved its technical maturity and viability in commercial manufacturing. And now it has reached another significant milestone: accomplishing fully automated continuous DS production at pilot scale. Such achievements underscore WuXi Biologics’ steadfast dedication to furthering technological innovation, and advancing the standards for digitalization and automation in biopharmaceutical R&D and manufacturing — both of which are critical capabilities to improve quality and accelerate timelines. With our deep technical expertise and extensive track record, WuXi Biologics remains committed to enabling our global clients to speed drug development more efficiently, benefiting patients worldwide.”

About WuXiUPTM 

WuXiUPTM is an intensified perfusion culture process developed as a next-generation biomanufacturing solution that provides high-yield, high-quality drug products while being highly flexible and cost-effective. Compared to traditional fed-batch and perfusion processes, WuXiUPTM enables the manufacturing of diverse pharmaceutical proteins, including mAb, bispecific antibody, fusion protein, and other recombinant protein, with 5–20× higher productivity.

This performance advantage is particularly notable when scaling to 1,000–2,000 L using single-use bioreactors, where it achieves productivity levels comparable to those of traditional 10,000–20,000 L stainless steel bioreactors. The WuXiUPTM platform has enabled one molecule to receive BLA approval and 11 others to receive IND approvals.


Tencent Music Entertainment Group Announces Second Quarter 2025 Unaudited Financial Results

SHENZHEN, China, Aug. 12, 2025 /PRNewswire/ — Tencent Music Entertainment Group (“TME,” or the “Company”) (NYSE: TME and HKEX: 1698), the leading online music and audio entertainment platform in China, today announced its unaudited financial results for the second quarter ended June 30, 2025.

Second Quarter 2025 Financial Highlights

  • Total revenues were RMB8.44 billion (US$1.18 billion), representing a 17.9% year-over-year increase, primarily due to strong year-over-year growth in revenues from online music services, and partially offset by a decline in revenues from social entertainment services and others.
  • Revenues from online music services were RMB6.85 billion (US$957 million), representing 26.4% year-over-year growth. Revenues from music subscriptions were RMB4.38 billion (US$611 million), representing 17.1% year-over-year growth. Monthly ARPPU grew to RMB11.7 from RMB10.7 in the same period of 2024.
  • Net profit attributable to equity holders of the Company was RMB2.41 billion (US$336 million), representing 43.2% year-over-year growth. Non-IFRS net profit attributable to equity holders of the Company[1] was RMB2.57 billion (US$359 million), representing 37.4% year-over-year growth.
  • Diluted earnings per ADS was RMB1.55 (US$0.22), up from RMB1.07 in the same period of 2024. Non-IFRS diluted earnings per ADS was RMB1.66 (US$0.23), up from RMB1.19 in the same period of 2024.
  • Total cash, cash equivalents, term deposits and short-term investments as of June 30, 2025 were RMB34.92 billion (US$4.87 billion).

Mr. Cussion Pang, Executive Chairman of TME, commented, “We delivered high-quality growth in the second quarter, achieving solid year-over-year increases in both revenue and profitability. While our music subscription business remained a core growth driver, our expanding suite of music-related services—including advertising, concerts, and artist merchandise—showed impressive momentum. As we continue to scale our platform, we are focused on building a vibrant, one-stop music service destination that empowers content creators and reshapes connections with music lovers in meaningful ways.”

Mr. Ross Liang, CEO of TME, continued, “Our focus on product innovation to deliver immersive user experiences has driven solid growth in our online music business. This is reflected in the continued expansion of both our subscriber base and ARPPU, along with deeper user engagement. We are especially pleased to see our SVIP subscribers recently surpass 15 million, a new milestone reflecting the deep trust and loyalty of our users. We see great potential in the music entertainment space and remain committed to investing in new initiatives that create lasting value and impact to music creators and consumers.”

Second Quarter 2025 Operational Highlights 

  • Key Operating Metrics

2Q25

2Q24

YoY %

MAUs – online music (million)

553

571

(3.2 %)

Paying users – online music (million)

124.4

117.0

6.3 %

Monthly ARPPU – online music (RMB)

11.7

10.7

9.3 %

Building a richer content ecosystem to support long-term growth.

  • Expanded partnerships with record labels and artists, home and abroad. 1) Strengthened our K-pop offerings by establishing cooperation with The Black Label and H MUSIC for the first time. 2) Extended collaboration with renowned Chinese artist Wang Feng, featuring both classic music repertoire and latest releases.
  • Innovative approaches to content co-production boosted our content appeal and promoted cultural exchange. 1) Partnered with SM Entertainment, NCT CHENLE’s Chinese EP *Lucid* showcases cross-border collaborative efforts in content creation. Our omni-channel approach to promote the EP through a series of online and offline campaigns broadened our user reach and strengthened user engagement. 2) The theme song that we produced for popular movie THE LYCHEE ROAD, performed by Chen Chusheng, received widespread acclaim from both viewers and critics. 3) Formed a strategic partnership with Zhejiang Satellite TV to not only secure the music rights for popular variety shows, such as The Treasured Voice and Shining Summer, but also collaborate on content creation, artist promotion, and more.

TME’s enhanced brand and platform value, together with tailored approaches to support artists home and abroad, has gained increasing recognition.

  • Achieved resounding success in staging large-scale concerts for renowned artists. 1) Hosted our first international grand concert tour for leading Korean artist G-DRAGON in Macau, where over 36,000 fans immersed in a captivating atmosphere, with on-site official merchandise rapidly selling out. Following a strong kickoff, the tour has been scheduled to expand into other regions this year. 2) Successfully organized a series of stadium concerts for Fiona Sit, TIA RAY and rapper GAI[2], and growing their audience base in China.
  • Our ability to curate live music concerts of all sizes has made us a partner of choice for staging emerging artists. In the first half of 2025, we facilitated over 300 offline performance opportunities for nearly 100 artists and groups from Tencent Musician Platform, featuring our proprietary IPs CITY LIVE and BUFF LIVE with great success. Our cross-platform promotions propelled several works to trending hits, including Xiang Sisi’s Why Not Wait for the Wind, which amassed over 20 million streams and topped multiple music charts.
  • Partnered with DearU to launch bubble on QQ Music, an interactive community that allows users to engage directly with hundreds of K-pop artists from labels, such as SM, JYP, and CUBE. We intend to also invite some popular Chinese artists to the community to foster deeper, more personal connections.

Concerted and innovative efforts to enhance product appeal successfully led to improved user engagement, increased SVIP adoption, and new monetization opportunities.

  • Premium sound quality remains the most popular SVIP membership benefit. In the second quarter, Kugou Music pioneered VIPER HiFi sound quality and One-Click Audio Enhancement 2.0, delivering tailored music experiences for diverse use cases. We also upgraded voice extraction features with the industry’s first AI Chorus function, redefining the live concert sing-along experience for users.
  • On conversion, artist-centric privileges have become increasingly effective at boosting SVIP adoptions, including 1) digital albums, with standout releases like Hold Me Close by A-Lin and JJ Lin and Pleasure by Jolin Cai; 2) priority access to concert tickets, such as in-demand events by G-DRAGON and BLACKPINK; and 3) star card series in collaboration with artists such as JC-T, Silence Wang and aespa.
  • To enrich the ways that our members enjoy music, we have worked closely with leading car manufacturers and a wide range of models to deliver a premium in-car music experience. Highlights included a comprehensive partnership with Geely and integration with Xiaomi’s first SUV, YU7.
  • Newly launched ad-based membership, together with optimized advertising formats and incentives, boosted user engagement and advertising effectiveness, which in turn led to strong year-over-year advertising revenue growth.

Second Quarter 2025 Financial Review

Total revenues increased by RMB1.28 billion, or 17.9%, to RMB8.44 billion (US$1.18 billion) from RMB7.16 billion in the same period of 2024.

  • Revenues from online music services increased by 26.4% to RMB6.85 billion (US$957 million), compared with RMB5.42 billion in the same period of 2024. The increase was driven by solid growth in music subscription revenues, supplemented by growth in revenues from advertising services, artist-related merchandise and offline performances. Revenues from music subscriptions were RMB4.38 billion (US$611 million), representing 17.1% year-over-year growth, compared with RMB3.74 billion in the same period of 2024. The rapid growth was mainly driven by the improved monthly ARPPU, which increased to RMB11.7 in the second quarter of 2025 from RMB10.7 in the same period of 2024. This growth of monthly ARPPU was primarily due to expansion of the SVIP membership program, as we continue to enrich SVIP membership privileges for our users. The year-over-year increase in revenues from advertising was primarily due to our more diversified product portfolio and innovative ad formats, such as ad-supported mode. Additionally, revenues from artist-related merchandise and offline performances achieved robust growth.
  • Revenues from social entertainment services and others decreased by 8.5% to RMB1.59 billion (US$222 million) from RMB1.74 billion in the same period of 2024.

Cost of revenues increased by 13.1% year-over-year to RMB4.69 billion (US$655 million), mainly due to increased IP related costs, such as costs for artist-related merchandise, costs related to offline performances and advertising agency fees. Meanwhile, revenue sharing fees decreased as a result of the decline in revenues from social entertainment services.

Gross margin increased to 44.4% from 42.0% in the same period of 2024, primarily due to strong growth in revenues from music subscriptions and advertising services, and the decline in revenue sharing ratio of social entertainment services. Meanwhile, the growth in revenues from artist-related merchandise and offline performances had offsetting impact on gross margin increase.

Total operating expenses were RMB1.16 billion (US$161 million), which was relatively stable compared with the same period of 2024. Operating expenses as a percentage of total revenues decreased to 13.7% from 16.0% in the same period of 2024.

Total operating profit was RMB2.98 billion (US$416 million) in the second quarter of 2025, representing a 35.5% year-over-year increase.

Income tax expenses for the second quarter of 2025 were RMB515 million (US$72 million), compared with RMB432 million in the same period of 2024. We accrued withholding income tax of RMB118 million (US$16 million) in the second quarter of 2025.

For the second quarter of 2025, net profit was RMB2.47 billion (US$344 million) and net profit attributable to equity holders of the Company was RMB2.41 billion (US$336 million). Non-IFRS net profit was RMB2.64 billion (US$369 million) and non-IFRS net profit attributable to equity holders of the Company was RMB2.57 billion (US$359 million). Please refer to the section in this press release titled “Non-IFRS Financial Measure” for details.

Basic and diluted earnings per American Depositary Shares (“ADS”) for the second quarter of 2025 were RMB1.57 (US$0.22) and RMB1.55 (US$0.22), respectively; non-IFRS basic and diluted earnings per ADS were RMB1.68 (US$0.23) and RMB1.66 (US$0.23), respectively. For the second quarter of 2025, the Company had weighted averages of 1.53 billion basic and 1.55 billion diluted ADSs outstanding, respectively. Each ADS represents two of the Company’s Class A ordinary shares.

As of June 30, 2025, the combined balance of the Company’s cash, cash equivalents, term deposits and short-term investments amounted to RMB34.92 billion (US$4.87 billion), compared with RMB37.67 billion as of March 31, 2025.

Environmental, Social, and Governance (“ESG”)

We continue to unlock the social value of music and its healing powers. This quarter, we launched the ‘Hearing Guizhou’ project, leveraging AI technology to promote better relaxation and sleep through natural instruments and immersive soundscapes.

Exchange Rate

This announcement contains translations of certain RMB amounts into U.S. dollars (“USD”) at specified rates solely for the convenience of the reader. Unless otherwise stated, all translations from RMB to USD were made at the rate of RMB7.1636 to US$1.00, the noon buying rate in effect on June 30, 2025, in the H.10 statistical release of the Federal Reserve Board. The Company makes no representation that the RMB or USD amounts referred could be converted into USD or RMB, as the case may be, at any particular rate or at all. For analytical presentation, all percentages are calculated using the numbers presented in the financial statements contained in this earnings release.

Non-IFRS Financial Measure

The Company uses non-IFRS net profit for the period, which is a non-IFRS financial measure, in evaluating its operating results and for financial and operational decision-making purposes. TME believes that non-IFRS net profit helps identify underlying trends in the Company’s business that could otherwise be distorted by the effect of certain expenses that the Company includes in its profit for the period. TME believes that non-IFRS net profit for the period provides useful information about its results of operations, enhances the overall understanding of its past performance and future prospects and allows for greater visibility with respect to key metrics used by its management in its financial and operational decision-making.

Non-IFRS net profit for the period should not be considered in isolation or construed as an alternative to operating profit, net profit for the period or any other measure of performance or as an indicator of its operating performance. Investors are encouraged to review non-IFRS net profit for the period and the reconciliation to its most directly comparable IFRS measure. Non-IFRS net profit for the period presented here may not be comparable to similarly titled measures presented by other companies. Other companies may calculate similarly titled measures differently, limiting their usefulness as comparative measures to the Company’s data. TME encourages investors and others to review its financial information in its entirety and not rely on a single financial measure.

Non-IFRS net profit for the period represents profit for the period excluding amortization of intangible and other assets arising from business acquisitions or combinations, share-based compensation expenses, net losses/gains from investments and related income tax effects.

Please see the “Unaudited Non-IFRS Financial Measure” included in this press release for a full reconciliation of non-IFRS net profit for the period to its net profit for the period.

[1] Non-IFRS net profit attributable to equity holders of the Company was arrived at after excluding the combined effect of amortization of intangible assets and other assets arising from business acquisitions or combinations, share-based compensation expenses, net losses/gains from investments, and related income tax effects.

[2] Names grouped by artists and bands, sorted in alphabetical order by family names.

About Tencent Music Entertainment

Tencent Music Entertainment Group (NYSE: TME and HKEX: 1698) is the leading online music and audio entertainment platform in China, operating the country’s highly popular and innovative music apps: QQ Music, Kugou Music, Kuwo Music and WeSing. TME’s mission is to create endless possibilities with music and technology. TME’s platform comprises online music, online audio, online karaoke, music-centric live streaming and online concert services, enabling music fans to discover, listen, sing, watch, perform and socialize around music. For more information, please visit ir.tencentmusic.com.

Safe Harbor Statement

This press release contains forward-looking statements. These statements are made under the “safe harbor” provisions of the U.S. Private Securities Litigation Reform Act of 1995. Statements that are not historical facts, including statements about the Company’s beliefs and expectations, are forward-looking statements. Forward-looking statements involve inherent risks and uncertainties, and a number of factors could cause actual results to differ materially from those contained in any forward-looking statement. In some cases, forward-looking statements can be identified by words or phrases such as “may,” “will,” “expect,” “anticipate,” “target,” “aim,” “estimate,” “intend,” “plan,” “believe,” “potential,” “continue,” “is/are likely to” or other similar expressions. Further information regarding these and other risks, uncertainties or factors is included in the Company’s filings with the SEC and the HKEX. All information provided in this press release is as of the date of this press release, and the Company does not undertake any duty to update such information, except as required under applicable law.

Investor Relations Contact 
Tencent Music Entertainment Group
ir@tencentmusic.com
+86 (755) 8601-3388 ext. 885034


TENCENT MUSIC ENTERTAINMENT GROUP

CONSOLIDATED INCOME STATEMENTS

Three Months Ended June 30

Six Months Ended June 30

2024

2025

2024

2025

 RMB 

 RMB 

 US$ 

 RMB 

 RMB 

 US$ 

 Unaudited 

 Unaudited 

 Unaudited 

 Unaudited 

 Unaudited 

 Unaudited 

(in millions, except per share data)

(in millions, except per share data)

Revenues

Online music services

5,424

6,854

957

10,431

12,658

1,767

Social entertainment services and others

1,736

1,588

222

3,497

3,140

438

7,160

8,442

1,178

13,928

15,798

2,205

Cost of revenues

(4,150)

(4,693)

(655)

(8,147)

(8,807)

(1,229)

Gross profit

3,010

3,749

523

5,781

6,991

976

Selling and marketing expenses

(210)

(216)

(30)

(397)

(415)

(58)

General and administrative expenses

(938)

(940)

(131)

(1,887)

(1,884)

(263)

Total operating expenses

(1,148)

(1,156)

(161)

(2,284)

(2,299)

(321)

Interest income 

304

254

35

582

551

77

Other gains, net

32

131

18

78

2,571

359

Operating profit

2,198

2,978

416

4,157

7,814

1,091

Share of net profit of investments accounted
for using equity method

54

16

2

36

39

5

Finance cost

(26)

(12)

(2)

(56)

(37)

(5)

Profit before income tax

2,226

2,982

416

4,137

7,816

1,091

Income tax expense

(432)

(515)

(72)

(813)

(961)

(134)

Profit for the period

1,794

2,467

344

3,324

6,855

957

Attributable to:

Equity holders of the Company

1,682

2,409

336

3,104

6,700

935

Non-controlling interests

112

58

8

220

155

22

Earnings per share for Class A and Class B
ordinary shares

Basic

0.54

0.79

0.11

1.01

2.19

0.31

Diluted

0.54

0.78

0.11

0.99

2.16

0.30

Earnings per ADS (2 Class A shares equal to 1 ADS)

Basic

1.09

1.57

0.22

2.02

4.38

0.61

Diluted

1.07

1.55

0.22

1.99

4.32

0.60

Shares used in earnings per Class A and Class B

ordinary share computation:

Basic

3,087,608,798

3,059,783,073

3,059,783,073

3,072,305,455

3,057,167,291

3,057,167,291

Diluted

3,138,833,816

3,102,937,547

3,102,937,547

3,122,535,463

3,098,531,942

3,098,531,942

ADS used in earnings per ADS computation

Basic

1,543,804,399

1,529,891,537

1,529,891,537

1,536,152,728

1,528,583,645

1,528,583,645

Diluted

1,569,416,908

1,551,468,773

1,551,468,773

1,561,267,732

1,549,265,971

1,549,265,971


TENCENT MUSIC ENTERTAINMENT GROUP

UNAUDITED NON-IFRS FINANCIAL MEASURE

Three Months Ended June 30

Six Months Ended June 30

2024

2025

2024

2025

 RMB 

 RMB 

 US$ 

 RMB 

 RMB 

 US$ 

 Unaudited  

 Unaudited  

 Unaudited  

 Unaudited  

 Unaudited  

 Unaudited  

(in millions, except per share data)

(in millions, except per share data)

Profit for the period

1,794

2,467

344

3,324

6,855

957

Adjustments:

Amortization of intangible and other assets arising from

business acquisitions or combinations*

103

89

12

221

194

27

Share-based compensation

164

147

21

357

308

43

(Gains)/ losses from investments**

(21)

(2)

–

16

(2,377)

(332)

Income tax effects***

(55)

(61)

(9)

(121)

(114)

(16)

Non-IFRS Net Profit

1,985

2,640

369

3,797

4,866

679

Attributable to:

Equity holders of the Company

1,873

2,574

359

3,577

4,698

656

Non-controlling interests

112

66

9

220

168

23

Earnings per share for Class A and Class B

ordinary shares

Basic

0.61

0.84

0.12

1.16

1.54

0.21

Diluted

0.60

0.83

0.12

1.15

1.52

0.21

Earnings per ADS (2 Class A shares equal to 1 ADS)

Basic

1.21

1.68

0.23

2.33

3.07

0.43

Diluted

1.19

1.66

0.23

2.29

3.03

0.42

Shares used in earnings per Class A and Class B

ordinary share computation:

Basic

3,087,608,798

3,059,783,073

3,059,783,073

3,072,305,455

3,057,167,291

3,057,167,291

Diluted

3,138,833,816

3,102,937,547

3,102,937,547

3,122,535,463

3,098,531,942

3,098,531,942

ADS used in earnings per ADS computation

Basic

1,543,804,399

1,529,891,537

1,529,891,537

1,536,152,728

1,528,583,645

1,528,583,645

Diluted

1,569,416,908

1,551,468,773

1,551,468,773

1,561,267,732

1,549,265,971

1,549,265,971

* Represents the amortization of identifiable assets, including intangible assets such as domain name, trademark, copyrights, supplier resources,

corporate customer relationships and non-compete agreement etc., and fair value adjustment on music content (i.e., signed contracts obtained

for the rights to access to the music contents for which the amount was amortized over the contract period), resulting from business acquisitions

or combination.

** Including the net gains/losses on deemed disposals/disposals of investments, fair value changes arising from investments, impairment provision

of investments and other expenses in relation to equity transactions of investments.

*** Represents the income tax effects of Non-IFRS adjustments.


TENCENT MUSIC ENTERTAINMENT GROUP

CONSOLIDATED BALANCE SHEETS

As at December 31, 2024

As at June 30, 2025

 RMB 

 RMB 

 US$ 

 Audited 

 Unaudited 

 Unaudited 

(in millions)

ASSETS

Non-current assets

Property, plant and equipment

803

963

134

Land use rights

2,364

2,327

325

Right-of-use assets

295

310

43

Intangible assets

2,049

3,047

425

Goodwill

19,647

20,465

2,857

Investments accounted for using equity method 

4,669

1,859

260

Financial assets at fair value through other comprehensive income 

14,498

34,254

4,782

Other investments

309

308

43

Prepayments, deposits and other assets

425

263

37

Deferred tax assets

422

431

60

Term deposits

10,419

12,769

1,782

55,900

76,996

10,748

Current assets

Inventories

23

32

4

Accounts receivable

3,508

3,729

521

Prepayments, deposits and other assets

3,793

4,900

684

Other investments

46

50

7

Term deposits

13,999

11,147

1,556

Restricted Cash 

11

20

3

Cash and cash equivalents

13,164

10,999

1,535

34,544

30,877

4,310

Total assets

90,444

107,873

15,058

EQUITY

Equity attributable to equity holders of the Company

Share capital

2

2

0

Additional paid-in capital

29,035

29,463

4,113

Shares held for share award schemes

(520)

(545)

(76)

Treasury shares 

(550)

(939)

(131)

Other reserves

19,845

30,861

4,308

Retained earnings

20,051

25,036

3,495

67,863

83,878

11,709

Non-controlling interests

1,863

2,497

349

Total equity

69,726

86,375

12,057

LIABILITIES

Non-current liabilities

Notes payables

3,572

3,559

497

Other payables and other liabilities

–

345

48

Deferred tax liabilities

198

616

86

Lease liabilities

219

232

32

Deferred revenue 

179

250

35

4,168

5,002

698

Current liabilities

Accounts payable 

6,879

6,956

971

Other payables and other liabilities

3,381

3,010

420

Notes payables

2,154

2,147

300

Current tax liabilities

934

851

119

Lease liabilities

106

104

15

Deferred revenue

3,096

3,428

479

16,550

16,496

2,303

Total liabilities

20,718

21,498

3,001

Total equity and liabilities

90,444

107,873

15,058


TENCENT MUSIC ENTERTAINMENT GROUP

CONDENSED CONSOLIDATED STATEMENTS OF CASH FLOWS

Three Months Ended June 30

Six Months Ended June 30

2024

2025

2024

2025

 RMB 

 RMB 

 US$ 

 RMB 

 RMB 

 US$ 

 Unaudited  

 Unaudited  

 Unaudited  

 Unaudited  

 Unaudited  

 Unaudited  

(in millions)

(in millions)

Net cash provided by operating activities 

2,944

1,638

229

5,630

4,157

580

Net cash provided by/(used in) investing activities 

693

(633)

(88)

(4,805)

(3,854)

(538)

Net cash used in financing activities

(1,611)

(2,056)

(287)

(2,133)

(2,512)

(351)

Net increase/(decrease) in cash and cash equivalents 

2,026

(1,051)

(147)

(1,308)

(2,209)

(308)

Cash and cash equivalents at beginning of the period

10,218

12,022

1,678

13,567

13,164

1,838

Exchange differences on cash and cash equivalents

7

28

4

(8)

44

6

Cash and cash equivalents at end of the period

12,251

10,999

1,535

12,251

10,999

1,535


China Literature Announces 2025 Interim Results

HONG KONG, Aug. 12, 2025 /PRNewswire/ — China Literature Limited (“China Literature” or “the Company”, stock code: 0772), a leading online literature and intellectual property (“IP”) incubation platform in China, today announced the unaudited consolidated results for the six months ended June 30, 2025.

Results Highlights (1)

  • Total revenues were RMB3,190.6 million (USD445.7 million), compared with RMB4,190.9 million in the first half of 2024.
    – Revenues from online business increased by 2.3% year-over-year to RMB1,985.4 million (USD277.3 million), mainly due to the revenue growth of self-owned platform products.
    – Revenues from intellectual property operations and others decreased by 46.4% year-over-year to RMB1,205.2 million (USD168.4 million), mainly attributable to the absence of new TV series or film releases from New Classics Media (“NCM”) in the first half of the year, reflecting the inherent development cycles and scheduling of TV series and film projects.
  • On an IFRS basis:
    – Profit attributable to equity holders of the Company increased by 68.5% year-over-year to RMB849.8 million (USD118.7 million).
    – Basic earnings per share were RMB0.84. Diluted earnings per share were RMB0.83.
  • On a non-IFRS (2) basis, which is intended to reflect core earnings by excluding certain one-time and/or non-cash items:
    – Profit attributable to equity holders of the Company was RMB507.8 million (USD70.9 million), compared with RMB702.1 million in the first half of 2024, influenced by the uneven release schedules for TV series and films of NCM within this year. Excluding this impact, non-IFRS profit attributable to equity holders of the Company increased by 35.7% year-over-year to RMB545.3 million (USD76.2 million).
    – Basic earnings per share were RMB0.50. Diluted earnings per share were RMB0.50.

(1)    Figures stated in USD are based on USD1 to RMB7.1586.
(2)    Non-IFRS adjustments exclude share-based compensation, M&A related impact such as net gains or losses from investee companies, amortization of intangible assets and impairment provisions, as well as related income tax effects.
(3)    Certain figures included in this press release have been subject to rounding adjustments. Accordingly, figures shown as totals may not be an arithmetic aggregation of the figures shown in the breakdown items.

Mr. Hou Xiaonan, Chief Executive Officer of China Literature, commented, “In the first half of 2025, our online reading content ecosystem continued to flourish, with revenues from online business increasing by 2.3% year-over-year to RMB1.99 billion. In terms of our IP operation business, China Literature’s IPs have consistently excelled across premium TV series, animation, and comics. Additionally, we made breakthroughs in emerging segments such as short dramas and IP merchandising. The success rate of blockbuster short dramas saw significant improvement, and our IP merchandise business achieved a GMV of RMB480 million – nearly matching last year’s annual total, underscoring its strong momentum of development.

Overall, the year 2025 will be a pivotal period for fostering strong growth momentum. The rapid rise of short dramas, the breakout popularity of trendy toys, and the spreading influence of goods culture are driving new types of content and consumption patterns into the mainstream at an unprecedented pace. This evolution not only highlights the vibrancy of the cultural consumption market but also reaffirms the fundamental core principle: major breakthroughs in growth are driven by the creative transformation and contextual development of premium IP. With this historic opportunity in front of us, we will capitalize on our vast IP library, extensive experience, and established cross-industry synergies we have cultivated over multiple years to reshape the industry landscape and drive its development. Looking ahead, we remain committed to becoming the key driving force and lead architect of China’s evolving IP ecosystem.”

Financial Review (3)

Revenues were RMB3,190.6 million (USD445.7 million), compared with RMB4,190.9 million in the first half of 2024.

Revenues from online business increased by 2.3% year-over-year to RMB1,985.4 million (USD277.3 million).

i)       Online business revenues from self-owned platform products increased by 3.1% year-over-year to RMB1,746.0 million (USD243.9 million), due to the Company’s focus on improving core product operations and continuous production of high-quality content;

ii)      Online business revenues from channels on Tencent products decreased by 25.6% year-over-year to RMB97.1 million (USD13.6 million), primarily due to a decline in advertising revenues associated with the continuous refinement of content distribution practices on Tencent channels and prioritization of distribution through core pay-to-read products; and

iii)     Online business revenues from third-party platforms increased by 23.1% year-over-year to RMB142.2 million (USD19.9 million), reflecting the increasing value of the Company’s high-quality content to partners.

Revenues from IP operations and others decreased by 46.4% year-over-year to RMB1,205.2 million (USD168.4 million).

i)       Revenues from IP operations decreased by 48.4% year-over-year to RMB1,137.5 million (USD158.9 million), mainly attributable to the absence of new TV series or film releases in the first half of the year, reflecting the inherent development cycles and scheduling of TV series and film projects. Meanwhile, several new businesses have been developing rapidly, particularly the IP merchandise business, which generated strong growth with GMV increasing to RMB480 million in the first half of the year, nearly reaching the full-year total of RMB500 million in 2024; and

ii)      Revenues from the “others” category, mainly generated by sales of physical books, increased by 41.9% year-over-year to RMB67.7 million (USD9.5 million).

Cost of revenues decreased by 25.1% year-over-year to RMB1,578.2 million (USD220.5 million). The decrease was primarily due to the absence of new TV series or film releases in the first half of the year, which resulted in no corresponding production costs being recognized during the period.

Gross profit was RMB1,612.4 million (USD225.2 million), compared with RMB2,083.2 million in the first half of 2024. Gross margin was 50.5%, compared with 49.7% in the first half of 2024.     

Interest income was RMB81.9 million (USD11.4 million), compared with RMB90.6 million in the first half of 2024.

Net other gains were RMB582.5 million (USD81.4 million), compared with net other losses of RMB3.7 million in the first half of 2024. Net other gains of this period were primarily related to investment activities.

Selling and marketing expenses decreased by 20.4% year-over-year to RMB922.4 million (USD128.9 million), mainly due to a decrease in marketing and promotional expenses associated with TV series and films.

General and administrative expenses decreased by 11.0% year-over-year to RMB484.7 million (USD67.7 million), primarily due to lower employee-related expenses.

Net reversal of impairment losses on financial assets was RMB6.2 million (USD0.9 million), mainly due to the recovery of previously impaired receivables related to IP operations.

Operating profit increased by 92.7% year-over-year to RMB875.8 million (USD122.3 million). On a non-IFRS basis, operating profit was RMB448.7 million (USD62.7 million), compared with RMB624.2 million in the first half of 2024.

Income tax expense was RMB149.5 million (USD20.9 million), compared with RMB99.1 million in the first half of 2024, primarily due to the increase in taxable income.

Profit attributable to equity holders of the Company increased by 68.5% year-over-year to RMB849.8 million (USD118.7 million). On a non-IFRS basis, profit attributable to equity holders of the Company was RMB507.8 million (USD70.9 million), down from RMB702.1 million in the first half of 2024, influenced by the uneven release schedules for TV series and films of NCM within this year. Excluding this impact, non-IFRS profit attributable to equity holders of the Company increased by 35.7% year-over-year from RMB401.7 million in the first half of 2024 to RMB545.3 million (USD76.2 million).

Key Operating Information

–        Average MAUs on self-owned platform products and self-operated channels on Tencent products were 141.3 million in the first half of 2025, compared with 176.0 million in the first half of 2024.

i)       MAUs on self-owned platform products declined by 2.5% year-over-year from 105.3 million to 102.7 million but remained largely stable compared with 102.3 million on a six-month basis; and

ii)      MAUs on self-operated channels on Tencent products were 38.5 million, compared with 70.7 million in the first half of 2024, primarily due to ongoing optimization of operational efficiency by concentrating more content distribution through core pay-to-read products which resulted in a decline in active users on free-to-read channels.

–        Average MPUs on self-owned platform products and self-operated channels on Tencent products increased by 4.5% year-over-year to 9.2 million in the first half of 2025, driven primarily by the launch of additional membership content since the second half of 2024.

–        Monthly ARPU for pay-to-read business decreased by 1.3% year-over-year to RMB31.3, mainly due to a mix effect from lower ARPU contributions from newly acquired membership users.

Other Key Information

–        EBITDA was RMB318.2 million (USD44.5 million), compared with RMB501.5 million in the first half of 2024. Adjusted EBITDA was RMB386.9 million (USD54.0 million), compared with RMB587.6 million in the first half of 2024.

–        As of June 30, 2025, the Company’s net cash position was RMB9,573.0 million (USD1,337.3 million), compared with RMB9,935.7 million as of December 31, 2024.

Business Review

During the first half of 2025, China’s IP industry saw rapid growth and major transformations occurred throughout the ecosystem. The changes can be summarized across three key areas:

  • Premium IP continues to increase in value. The traditional model of incubating high-quality TV series and film content based on literary IP remains robust and is consistently producing top-tier works with widespread influence and commercial success.
  • The rapid emergence of short dramas is reshaping content consumption, driving higher conversion efficiency and creating powerful new monetization opportunities for the massive library of mid- and long-tail IP. This has significantly accelerated the unlocking of IP value and driven diversification in digital content consumption.
  • Physical and scenario-based IP merchandise such as trendy toys, collectible cards, and goods continue to grow in popularity. This shows how IP is becoming deeply embedded into consumers’ daily lives, serving as a key medium for emotional connection, companionship, and social identity – essentially functioning like a social currency.

Together, these trends highlight the rapid evolution of China’s IP industry over the first half of 2025. As the industry pivots, our exceptional IP innovation capabilities and expansive IP library ideally position us to capitalize on the moment. Furthermore, we see an opportunity to play a leading role in the evolution of China’s IP ecosystem and unlock new growth potential.

IP Creation

Our online reading content ecosystem continues to thrive. In the first half of 2025, our online reading platform added approximately 200,000 writers and 410,000 literary works, collectively contributing approximately 20 billion Chinese characters. High-quality writers and literary works on our platform are growing steadily, with the number of newly signed works generating over RMB1 million in revenue increasing by 63% year-over-year during the first half of the year. Additionally, the number of newly signed writers with over 10,000 average subscribers per chapter rose by 45% year-over-year. The vibrancy of our content ecosystem is reflected in community engagement metrics: the number of works receiving over 10,000 monthly votes during the first half of the year increased by 20% year-over-year, and those surpassing 1 million monthly votes surged by 200% year-over-year.

As a result of these initiatives, revenue from our online business grew by 2.3% year-over-year to RMB1.99 billion and MPU increased by 4.5% year-over-year to 9.2 million.

IP Visualization

In the premium TV segment, several top-tier series adapted from our IPs premiered in the first half of the year, including “Flourished Peony”, “Si Jin”, “The Glory” and “I am Nobody” which all consecutively ranked first in popularity during their respective broadcasting periods. According to Enlightent data, six out of the top 10 long-form dramas by cumulative views across all platforms in the first half of 2025 were adapted from our IPs. During the summer season in July, our self-produced premium drama series “The Narcotic Operation” debuted on Tencent Video, achieving a popularity index of over 28,000 and earning favorable reviews from multiple mainstream media outlets. We have several additional premium drama projects planned for release in the second half of the year.

In the animation segment, we released new series from our classic animation franchises such as “Battle Through the Heavens”, “Stellar Transformations” and “Martial Universe” They all achieved top rankings on platform popularity charts during their respective broadcasting runs. Notably, the annual series “Battle Through the Heavens” topped Tencent Video’s paid content chart in the first half of this year. According to Enlightent data, eight out of the top 10 animation series by cumulative views across all platforms in the first half of 2025 were adapted from our IPs.

In the comics segment, we maintained market leadership through our premium IPs while expanding our content ecosystem with high-quality new titles. Established IPs like “The Outcast” and “The Fox Spirit Matchmaker” continued to thrive, highlighting their enduring influence. Meanwhile, standout new titles adapted from our IP performed strongly. Notably, “Dao of the Bizarre Immortal” broke into the top 20 paid bestsellers list within two months of release, setting an industry record for the fastest ascent by a new title. Another adaptation, “Martial Evolution: Start by Awakening the King of Monsters” also topped new release charts for four consecutive months since debuting in April, reflecting strong market appeal and long-term growth potential.

In the short drama segment, we achieved robust growth in the first half of 2025, with a significant increase in the success rate of blockbuster productions. This success is underpinned by our rich IP library, strong creator partnerships, and deep engagement across the IP industry chain. According to Enlightent data, we produced two out of the top 10 short dramas by viewership across all platforms in June 2025. One title generated record-breaking revenue of over RMB80 million, ranking second on Enlightent’s viewership charts with over 3 billion views this year. Another title topped Enlightent’s weekly charts during its broadcasting run, surpassing 1 billion views in its first month of release. In March, we further upgraded our short drama business by opening more than 2,000 online literature IPs for high-quality adaptation. We released an initial batch of 300 IPs and invited screenwriters and producers across the industry to collaborate. Going forward, we remain committed to our “IP-centric, quality-driven” strategy, strengthening our competitive edge while driving the high-quality development of the short drama industry.

IP Commercialization and Monetization

In the first half of 2025, physical and scenario-based IP merchandise products such as trendy toys, collectible cards, and goods saw rapid growth, highlighting a major shift in mass cultural consumption habits. We responded by capitalizing on this trend, and as a result, our IP merchandise business achieved major breakthroughs.

Our IP merchandise business generated GMV of RMB480 million in the first half of the year, nearly matching last year’s full-year total of RMB500 million. This rapid growth was driven by our continued dedication to product development, channel development, user engagement, and licensing expansion.

  • Product Development: We made significant progress advancing rapidly across the entire value chain for product development, including original artwork, design, and craftsmanship. This enabled us to accelerate new product launches to 3-4 times the previous year’s pace while simultaneously enhancing product quality.
  • Channel Development: Our online live-streaming rooms and offline stores have expanded steadily. During the 618 shopping festival, our Tmall flagship store ranked first on Taobao’s “Trending Goods Store Dark Horse List.” We now partner with nearly 10,000 online and offline distributors. Additionally, we are offering our channel development capabilities to empower others.
  • User Engagement: We strengthened connections with fans and generated strong social media engagement by hosting themed events around our premium IPs, including “The King’s Avatar”, “Lord of the Mysteries” and “Dao of the Bizarre Immortal” and seamlessly integrating them with new product launches.
  • Licensing Expansion: We partnered with 230 brands to further expand the influence of our IPs.

In the gaming segment, we continue to license premium IPs to our partners. The flagship title “Douluo Continent: Soul Hunting World” generated immense enthusiasm from gamers upon its launch in July this year. Additionally, several licensed adaptations, including “The Hidden Ones” and “Lord of the Mysteries” have obtained publication licenses and are expected to release in the near future.

Exploration in New Technologies

We have been actively embracing and integrating AI across our business.

In the first half of the year, we introduced the industry’s first AI-powered knowledge base for online literature, “Smart Pen Tongjian” built upon our existing AI tools available on the “Writer Assistant” creation platform. This feature enables full-text comprehension and Q&A for works spanning tens of millions of words, offering valuable support for writing, plot development, and inspiration for long-form content creation. Since its launch, interactions between writers and AI have increased by 40%, driving daily active users of “Writer Assistant” up by over 40% year-over-year, with weekly AI usage approaching 70%.

Our AI translation models have significantly accelerated the global spread of Chinese literary works. In the first half of 2025, revenue from AI-translated titles on our international reading platform, WebNovel, increased by 38% year-over-year, accounting for over 35% of total novel revenue on WebNovel. As of June 30, 2025, WebNovel offered overseas users over 10,000 Chinese translated works and approximately 770,000 locally created originals. The number of AI-translated titles reached 7,200, representing 70% of all Chinese translations.

We are also actively exploring AI applications across multiple content formats including animation, comics, video, audiobooks, radio dramas, and digital avatars, with the aim to unlock the vast potential of transforming mid- and long-tail text IPs into more multimedia formats.

About China Literature Limited

China Literature is dedicated to building a deep and immersive intellectual property (“IP”) universe for the Mandarin-speaking world. It incubates original IPs from its online literature platform, which are subsequently adapted to a range of digital entertainment mediums, including comics, animation, film, TV series, web series and games. The virtual world created by these digital offerings becomes an inseparable part of a user’s daily life. China Literature creates and promotes IPs mainly through Qidian Reading and QQ Reading, its leading online literature platforms, as well as New Classics Media, a renowned film and TV drama series production house in China. China Literature collaborates with Tencent, its shareholder and strategic partner, as well as other third-party partners to distribute and develop IP content and to enhance the value of its IP. Many of the Company’s online literature works have been successfully adapted into animation, TV series, web series, films and games, including Joy of Life, Candle in the Tomb, Soul Land, The King’s Avatar and My Heroic Husband. China Literature’s rich and extensive content library as well as its unparalleled capability and resources to adapt IP into various entertainment formats is a significant competitive advantage that lies at the core of its business model. For more information, please visit http://ir.yuewen.com/.

Non-IFRS Financial Measures

To supplement the consolidated financial statements of the Company prepared in accordance with IFRS, certain non-IFRS financial measures, namely non-IFRS operating profit, non-IFRS operating margin, non-IFRS profit for the period, non-IFRS net margin, non-IFRS profit attributable to equity holders of the Company, non-IFRS basic EPS and non-IFRS diluted EPS as additional financial measures, have been presented in this press release for the convenience of readers. These unaudited non-IFRS financial measures should be considered in addition to, and not as a substitute for, measures of the Company’s financial performance prepared in accordance with IFRS. These unaudited non-IFRS measures may be defined differently from similar terms used by other companies. In addition, non-IFRS adjustments include relevant non-IFRS adjustments for the Company’s material associates based on available published financials of the relevant material associates, or estimates made by the Company’s management based on available information, certain expectations, assumptions and premises.

Our management believes that the presentation of these non-IFRS financial measures, when shown in conjunction with the corresponding IFRS measures, provides useful information to investors and management regarding the financial and business trends relating to the Company’s financial condition and results of operations. Our management also believes that the non-IFRS financial measures are useful in evaluating the Company’s operating performances. From time to time, there may be other items that the Company may include or exclude in reviewing its financial results.

Forward-Looking Statements

This press release contains forward-looking statements relating to the industry and business outlook, forecast business plans and growth strategies of the Company. These forward-looking statements are based on information currently available to the Company and are stated herein on the basis of the outlook at the time of this press release. They are based on certain expectations, assumptions and premises, some of which are subjective or beyond our control. These forward-looking statements may prove to be incorrect and may not be realized in future. Underlying the forward-looking statements is a large number of risks and uncertainties. Further information regarding these risks and uncertainties is included in our other public disclosure documents on our corporate website.

CHINA LITERATURE

CONSOLIDATED INCOME STATEMENT

Six months ended June 30,

2025

2024

(RMB in million, unless specified)

Revenues

Online business(1)

1,985.4

1,940.4

Intellectual property operations and others(2)

1,205.2

2,250.6

3,190.6

4,190.9

Cost of revenues

(1,578.2)

(2,107.7)

Gross profit

1,612.4

2,083.2

Gross margin

50.5 %

49.7 %

Interest income

81.9

90.6

Other gains/(losses), net

582.5

(3.7)

Selling and marketing expenses

(922.4)

(1,158.9)

General and administrative expenses

(484.7)

(544.8)

Net reversal of/(provision for) impairment losses

on financial assets

6.2

(12.0)

Operating profit

875.8

454.4

Operating margin

27.4 %

10.8 %

Finance costs, net

(4.0)

(2.1)

Share of net profit of associates and joint ventures

127.3

150.6

Profit before income tax

999.0

603.0

Income tax expense

(149.5)

(99.1)

Profit for the period

849.6

503.9

Net margin

26.6 %

12.0 %

Profit attributable to:

Equity holders of the Company

849.8

504.3

Non-controlling interests

(0.2)

(0.4)

849.6

503.9

Earnings per share

(in RMB per share)

– Basic earnings per share

0.84

0.50

– Diluted earnings per share

0.83

0.49

Notes:

(1)   Revenues from online business primarily reflect revenues from online paid reading, online advertising and distribution of third-party online games on our platform.

(2)   Revenues from intellectual property operations and others primarily reflect revenues from production and distribution of TV, web and animated series, films, licensing of copyrights, operation of self-operated online games, distribution of short dramas, sales of IP merchandise products and sales of physical books.


CHINA LITERATURE

CONSOLIDATED STATEMENT OF COMPREHENSIVE INCOME

Six months ended June 30,

2025

2024

(RMB in million)

Profit for the period

849.6

503.9

Other comprehensive income, net of tax:

Item that may be subsequently reclassified to profit or loss

Share of other comprehensive income/(loss) of an associate

0.2

(0.2)

Transfer of share of other comprehensive income to profit or

      loss upon deemed disposal of an associate

(1.3)

–

Currency translation differences

49.9

(19.0)

Item that may not be reclassified to profit or loss

Net gains from changes in fair value of financial assets at fair

      value through other comprehensive income

24.4

1.4

Currency translation differences

(55.1)

47.9

18.1

30.2

Total comprehensive income for the period

867.7

534.1

Total comprehensive income attributable to:

Equity holders of the Company

867.9

534.5

Non-controlling interests

(0.2)

(0.4)

867.7

534.1


CHINA LITERATURE

CONSOLIDATED STATEMENT OF FINANCIAL POSITION

As of

June 30, 2025

December 31, 2024

(RMB in million)

ASSETS

Non-current assets

Property, plant and equipment

83.3

97.8

Right-of-use assets

194.6

149.8

Intangible assets

6,137.7

6,158.8

Investments in associates and joint ventures

725.2

928.2

Financial assets at fair value through profit or loss

1,031.0

1,039.6

Financial assets at fair value through other

      comprehensive income

874.3

6.3

Deferred income tax assets

413.0

497.2

Prepayments, deposits and other assets

257.2

298.2

Term deposits

2,523.0

2,308.0

12,239.2

11,484.0

Current assets

Inventories

676.3

693.0

Television series and film rights

839.8

529.8

Financial assets at fair value through profit or loss

2,945.7

3,252.9

Trade and notes receivables

1,352.7

1,703.4

Prepayments, deposits and other assets

1,045.0

907.4

Restricted bank deposits

4.5

4.5

Term deposits

2,074.6

1,106.2

Cash and cash equivalents

2,025.3

3,264.2

10,963.8

11,461.4

Total assets

23,203.0

22,945.4

EQUITY

Capital and reserves attributable to the equity

      holders of the Company

Share capital

0.6

0.6

Shares held for RSU scheme

(14.6)

(14.6)

Share premium

15,969.2

16,117.9

Other reserves

2,036.6

1,975.8

Retained earnings

1,166.4

294.7

19,158.2

18,374.4

Non-controlling interests

1.6

1.7

Total equity

19,159.8

18,376.2

As of

June 30, 2025

December 31, 2024

(RMB in million)

LIABILITIES

Non-current liabilities

Lease liabilities

135.7

85.0

Long-term payables

13.5

10.8

Deferred income tax liabilities

127.1

129.4

Deferred revenue

20.8

21.9

297.1

247.2

Current liabilities

Lease liabilities

70.8

81.2

Trade payables

1,101.5

1,044.6

Other payables and accruals

1,062.7

1,662.0

Deferred revenue

1,140.1

1,148.9

Current income tax liabilities

196.8

217.7

Financial liabilities at fair value through profit or loss

174.3

167.6

3,746.2

4,322.0

Total liabilities

4,043.2

4,569.3

Total equity and liabilities

23,203.0

22,945.4


CHINA LITERATURE

RECONCILIATION OF OPERATING PROFIT TO EBITDA AND ADJUSTED EBITDA

Six months ended June 30,

2025

2024

(RMB in million)

Reconciliation of operating profit to EBITDA

     and adjusted EBITDA:

Operating profit

875.8

454.4

Adjustments:

Interest income

(81.9)

(90.6)

Other (gains)/losses, net

(582.5)

3.7

Depreciation of property, plant and equipment

18.8

17.8

Depreciation of right-of-use assets

34.2

36.2

Amortization of intangible assets

53.8

79.9

EBITDA

318.2

501.5

Adjustments:

Share-based compensation

65.9

55.4

Expenditures related to acquisition

2.7

30.7

Adjusted EBITDA

386.9

587.6


CHINA LITERATURE
RECONCILIATIONS OF IFRS TO NON-IFRS RESULTS

Unaudited six months ended June 30, 2025

Adjustments

As

reported

Share-

based

compensation

Net (gains)

from investments

and acquisitions(1)

Amortization

of intangible

assets(2)

Tax effect

Non-IFRS

(RMB in million, unless specified)

Operating profit

875.8

65.9

(502.5)

9.5

–

448.7

Profit for the period

849.6

65.9

(502.5)

9.5

85.2

507.6

Profit attributable to equity

holders of the Company

849.8

65.9

(502.5)

9.5

85.2

507.8

Earnings per share (RMB per

share)

– basic

0.84

0.50

– diluted

0.83

0.50

Operating margin

27.4 %

14.1 %

Net margin

26.6 %

15.9 %

Unaudited six months ended June 30, 2024

Adjustments

As

reported

Share-

based

compensation

Net losses

from investments

and acquisitions(1)

Amortization

of intangible

assets(2)

Tax effect

Non-IFRS

(RMB in million, unless specified)

Operating profit

454.4

55.4

104.7

9.5

–

624.2

Profit for the period

503.9

55.4

104.7

9.5

28.0

701.7

Profit attributable to equity holders of the Company

504.3

55.4

104.7

9.5

28.0

702.1

Earnings per share (RMB per share)

– basic

0.50

0.69

– diluted

0.49

0.69

Operating margin

10.8 %

14.9 %

Net margin

12.0 %

16.7 %

Notes:

(1)  This item mainly includes gains on disposal and deemed disposal, impairment provision and fair value changes arising from our investee companies, the fair value changes of consideration liabilities related to the acquisition of New Classics Media, and the compensation costs for certain employees and former owners related to acquisitions.

(2)  Represents amortization of intangible assets and TV series and film rights resulting from acquisitions.


Matrix-Game 2.0 Launches as a Powerful Open-Source Alternative to Genie 3

SINGAPORE, Aug. 12, 2025 /PRNewswire/ — The SkyWork AI Technology Release Week officially kicked off on August 11. From August 11 to August 15, a new model will be unveiled each day, covering cutting-edge models for core multimodal AI scenarios.

A week ago, DeepMind released a major update to its interactive world model—Genie 3—enabling real-time, long-sequence generation. This advancement has drawn significant attention to world models. However, Genie 3 was not open-sourced, leaving the community to speculate about its implementation.

On August 12, Skywork unveiled an upgraded version of the self-developed Matrix series’ interactive world model—Matrix-Game 2.0. It also delivers interactive, real-time, long-sequence generation in general scenarios. To drive progress in interactive world modeling, Matrix-Game 2.0 has been fully open-sourced, marking the industry’s first open-source solution for real-time, long-sequence, interactive generation in general scenarios.


Matrix-Game 2.0 open source addresses:

  1. Technical report: https://github.com/SkyworkAI/Matrix-Game/blob/main/Matrix-Game-2/assets/pdf/report.pdf
  2. Project homepage: https://matrix-game-v2.github.io/
  3. HuggingFace: https://huggingface.co/Skywork/Matrix-Game-2.0
  4. GitHub: https://github.com/SkyworkAI/Matrix-Game

Matrix-Game 2.0 achieves a breakthrough in real-time generation and long-sequence handling. Compared to its predecessor, the 2.0 version prioritizes low-latency, high-frame-rate performance for extended interactions, enabling stable 25 FPS continuous video generation across complex scenes. Its generation length scales to minute-long sequences, drastically improving temporal coherence and real-world usability.

While delivering a significant boost in inference speed, Matrix-Game 2.0 maintains precise comprehension of physical laws and scene semantics. It enables users to freely explore, manipulate, and construct virtual environments in real time through simple instructions—yielding well-structured, detail-rich, and logically coherent virtual spaces.

With these capabilities, Matrix-Game 2.0 not only breaks down the barriers between content generation and interaction but also unlocks new possibilities for cutting-edge applications such as virtual humans, game engines, and embodied AI. It provides a robust technical foundation for building a universal virtual world.

Currently, Matrix-Game 2.0 boasts three core advantages:

High-frame-rate, real-time long-sequence generation: The model supports fluid movement (forward/backward, left/right) and camera/view rotation. Users can intuitively control characters in the scene via simple commands. The system generates seamless footage in real time at 25 FPS, enabling minute-long interactive sequences in a single session. Character movements are lifelike, smooth, and precisely responsive.

Cross-scenario generalization capability: The model demonstrates exceptional cross-domain adaptability. It is not only suitable for specific task scenarios but also supports simulations of diverse styles and environments—including urban, wilderness, and other spatial types, as well as realistic, oil-painting, and various visual styles.

Enhanced physical consistency: The model demonstrates a deeper understanding of physical rules. Characters generated by the model exhibit physically plausible movements when navigating complex terrains such as steps and obstacles, which improves immersion and controllability.

The open-source release of Matrix-Game for interactive video generation underscores Skywork’s strategic foresight in AI development. This initiative will accelerate development across Skywork’s multi-model AI ecosystem. Moving forward, Skywork remains committed to pioneering and open-sourcing advanced AI solutions. By collaborating with global developers and users, we aim to build next-generation platforms that accelerate the global advancement of AGI.


Matrix-3D Goes Open-Source: A New Benchmark for 3D World Generation

SINGAPORE, Aug. 12, 2025 /PRNewswire/ — The SkyWork AI Technology Release Week officially kicked off on August 11. From August 11 to August 15, a new model will be unveiled each day, covering cutting-edge models for core multimodal AI scenarios.

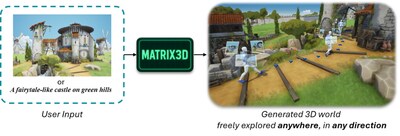
On August 12, the world model Matrix-3D for 3D world generation and exploration was officially open-sourced. Starting from a single input image, it generates high-quality, trajectory-consistent panoramic videos and directly reconstructs navigable 3D spaces. Compared to WorldLabs’ output, Matrix-3D enables exploration across significantly larger virtual environments.


Matrix-3D open source addresses:

  1. GitHub: https://github.com/SkyworkAI/Matrix-3D
  2. HuggingFace: https://huggingface.co/Skywork/Matrix-3D
  3. Technical report: https://github.com/SkyworkAI/Matrix-3D/blob/main/asset/report.pdf
  4. Project homepage: https://matrix-3d.github.io/

By integrating panoramic representation, conditional video generation, and 3D reconstruction modules, Matrix-3D surpasses existing methods in field-of-view range, geometric consistency, and visual quality. It accepts both text and image inputs and generates freely explorable 3D scenes.

Matrix-3D achieves state-of-the-art generation quality on panoramic video benchmark datasets, while also attaining industry-leading performance in camera motion control precision.

World models like Google’s Genie 3 paint a compelling vision of the future. They reveal AI’s evolution beyond mere content generation tools into world simulators—systems capable of constructing and simulating entire environments. As AI technology progresses, these models are poised to become critical infrastructure for understanding our world, shaping tomorrow, and ultimately realizing artificial general intelligence (AGI).

The open-source release of Matrix-3D for 3D world generation and exploration underscores Skywork’s strategic foresight in AI development. This initiative will accelerate development across Skywork’s multi-model AI ecosystem. Moving forward, Skywork remains committed to pioneering and open-sourcing advanced AI solutions. By collaborating with global developers and users, we aim to build next-generation platforms that accelerate the global advancement of AGI.

Demand for Cambridge International Education soars in Southeast Asia and Pacific

  • Cambridge releases June 2025 exam results to over 680,000 students globally – up 9%
  • Over 40,000 Cambridge International AS & A Level results issued to nearly 16,000 students Southeast Asia Pacific today

CAMBRIDGE, England, Aug. 12, 2025 /PRNewswire/ — As the world navigates rapid advancements in technology, manages the growing impact of climate change, and faces geopolitical shifts, more students and families in Southeast Asia and Pacific (SEAP) are turning to an international education as a way of preparing for the complexities of tomorrow. Cambridge International Education (Cambridge), has today begun releasing the results of its June 2025 exam series to over 680,000 students worldwide,  a 9% increase over last year, reflecting this accelerating education trend toward global readiness.

In the SEAP region, more than 165,000 entries were made for Cambridge qualifications this June, a nearly 4% increase compared to June 2024. This growth reflects rising demand in key markets:

  • Malaysia: over 70,500 entries (+2% increase)
  • Indonesia: over 33,000 entries (+6% increase)
  • Vietnam: over 15,500 entries (+4% increase)
  • Thailand: over 18,500 entries (+7% increase)

Linked to the increased number of students, the number of exam entries has risen again this June to nearly 1.7 million – a 7% increase on last year. The growth is not only a testament to the academic quality of Cambridge programmes but also to a broader shift in what families and educators value: education that builds skills to work and study globally, fosters adaptability, and encourages critical engagement with real-world issues.

Across SEAP, Cambridge International AS & A Level results have been released today, opening doors to top universities and future-focused careers. Results from a 2024 Cambridge Student Destinations survey showed that globally, 89% of the 2024 Cambridge International AS & A Level student cohort progressed directly to university after graduating from school, 47% in their own country and 42% overseas.

Cambridge is the largest provider of international education for 14- to 16-year-olds and will issue Cambridge IGCSE and O Level results to over 30,000 students in the SEAP region on 19 August. 

“In a time of uncertainty and transformation, the outlook that an international education provides is not just an advantage, it’s a necessity,” said Rod Smith, Group Managing Director for International Education at Cambridge. “Congratulations to all those receiving Cambridge results this August. We are proud to support a global community of learners who are preparing not only for university and careers, but for life in a rapidly changing world.”

Future-ready skills in high demand

While English, mathematics and science remain the most popular subjects at both Cambridge International AS & A Level and Cambridge IGCSE, one of the clearest indicators of changing educational priorities is the surge in entries for Cambridge International AS & A Level Global Perspectives — up 17% this year. The subject, which encourages students to think critically about global challenges, conduct independent research, and articulate evidence-based arguments, has seen growing uptake across all stages of the Cambridge Pathway. “As AI transforms the job market, and as climate and global issues demand collaborative solutions, it’s no surprise that more schools are seeking subjects that equip their students to think beyond borders,” said Kanjna Paranthaman, Regional Director for SEAP. “Cambridge Global Perspectives exemplifies the skills students need today, curiosity, rigour, and the ability to understand issues from others’ perspectives.”

Demand for international education rising globally

The number of schools worldwide making entries in the June series has grown by 38% over the past five years, with an associated 74% growth in entries. In total, 5507 Cambridge International Schools in 149 countries made exam entries for the June 2025 series.

Cambridge, with more than 160 years of experience in international assessment, now serves nearly two million students annually. Its assessments, including Cambridge Checkpoint for younger learners as well as Cambridge IGCSE, O Level, International AS & A Level and the International Project Qualification are valued by schools and universities worldwide.

About Cambridge

Cambridge International Education is the awarding body of the International Education group at Cambridge University Press & Assessment, part of the University of Cambridge. Our International Education group works with schools worldwide to build an education that shapes knowledge, understanding and skills. Together, we give learners the confidence they need to thrive and make a positive impact in a changing world.

We offer a globally trusted and flexible framework for education from age 3 to 19 (the Cambridge Pathway), informed by research, experience, and listening to educators.

With recognised qualifications (such as Cambridge IGCSE and International AS & A Level), high-quality resources, comprehensive support and valuable insights, we help schools prepare every student for the opportunities and challenges ahead. Together, we help Cambridge learners be ready for the world.

Learn more! Visit www.cambridgeinternational.org

Hainan, China’s Premier Vacation Destination, Unveils New Tourism Experiences


HAIKOU, CHINA – Media OutReach Newswire – 12 August 2025 – Since the beginning of 2025, an overseas promotional campaign themed “Cool Hainan” has been launched on social media platforms like Facebook and X. This campaign showcases a variety of new tourism products, routes, and experiences offered by the Hainan Free Trade Port, reaching over 35 million global netizens to date.

Hainan, China's premier vacation destination, unveils new tourism experiences
Hainan, China’s premier vacation destination, unveils new tourism experiences

Hainan is the only tropical island province in China, blessed with superior natural scenery, rich tourism resources, and unique cultural legacies. The campaign aims to put Hainan in the limelight to attract more visitors.

To date, the “Cool Hainan” campaign has released 56 posts, featuring 116 popular and lesser-known scenic spots, thoughtfully designed routes, and creative packages.

For example, “Celebrating Spring Festival with Intangible Cultural Heritage” in January introduced itineraries for experiencing authentic Chinese New Year celebrations; “Early Spring Hainan Tour” in February highlighted flowers, birds, hot springs, and tropical fruits; “March 3rd Festival” in March showcased folk customs, intangible cultural heritage, and mouthwatering food of the Li and Miao ethnic minorities; “Dreamer’s Paradise” in April highlighted tourism and cultural offerings from the China International Consumer Products Expo held in Hainan; and “Cool Island” from May to July presented educational trips, marine sports, rainforest adventures, and refreshing snacks. These visually engaging posts effectively highlight Hainan’s exceptional tourism resources, targeting audiences from 85 visa-free countries.

Located in southern China, Hainan is the country’s largest Free Trade Port and a sought-after travel destination, boasting 1,944 kilometers of coastline, 4,269 square kilometers of tropical rainforest, and a 3,000-year-old Li culture.

The island is connected by numerous international flight routes, and a high-speed train can circle the island in just 3 hours. Additionally, the Hainan Coastal Scenic Highway and the Hainan Tropical Rainforest National Park Scenic Road link various attractions, while ten signature tourism experiences await visitors, including marine vacations, duty-free shopping, health tourism, and aerospace experiences.

Hashtag: #HainanDepartmentofTourism,Culture,Radio,TV,andSports

The issuer is solely responsible for the content of this announcement.

HUYA Inc. Reports Second Quarter 2025 Unaudited Financial Results

GUANGZHOU, China, Aug. 12, 2025 /PRNewswire/ — HUYA Inc. (“Huya” or the “Company”) (NYSE: HUYA), a leading game-related entertainment and services provider, today announced its unaudited financial results for the second quarter ended June 30, 2025.

Second Quarter 2025 Highlights

  • Total net revenues were RMB1,567.1 million (US$218.8 million) for the second quarter of 2025, compared with RMB1,541.6 million for the same period of 2024.
  • Game-related services, advertising and other revenues were RMB413.9 million (US$57.8 million) for the second quarter of 2025, compared with RMB308.5 million for the same period of 2024.
  • Net loss attributable to HUYA Inc. was RMB5.5 million (US$0.8 million) for the second quarter of 2025, compared with net income attributable to HUYA Inc. of RMB29.6 million for the same period of 2024.
  • Non-GAAP net income attributable to HUYA Inc.[1] was RMB47.5 million (US$6.6 million) for the second quarter of 2025, compared with RMB97.0 million for the same period of 2024.
  • Average MAUs[2] for the second quarter of 2025 was 161.6 million.

Mr. Junhong Huang, Acting Co-Chief Executive Officer and Senior Vice President of Huya, commented, “As we mark the two-year anniversary of Huya’s strategic transformation, we are pleased to report that we are back on a growth trajectory, with topline performance showing continued progress for the second consecutive quarter. Our efforts to expand our business from a pure-play live streaming platform to an all-rounded game-related entertainment and services provider have paid off. Our game-related services, advertising, and other revenues now stand at RMB414 million, representing 26% of total net revenues this quarter.

“By leveraging our cross-platform strategy, we have achieved an average of 162 million monthly active users across Huya’s platforms, and extended our reach even further through the distribution of our content and services on third-party channels. This figure underscores the ecosystem we have cultivated through this strategic transformation in China and overseas. Backed by our streamer network, e-sports infrastructure, AI capabilities, and operational strength, we are unlocking monetization in games—via in-game items and distribution—and growing our global user base as a key driver of future opportunities,” Mr. Huang concluded.

Mr. Raymond Peng Lei, Acting Co-Chief Executive Officer and Chief Financial Officer of Huya, added, “We are pleased to see live streaming revenues beginning to stabilize, with total net revenues returning to a growth trajectory for the second consecutive quarter. Our operating performance also continued to improve, driven by cost structure optimizations and enhanced operational efficiency. As of the end of June 2025, we had repurchased approximately US$75.4 million of Huya ADSs and distributed a special dividend totaling around US$340 million during the quarter. Looking ahead, we remain focused on advancing our strategic expansion initiatives, strengthening industry partnerships, and delivering sustainable long-term value to our shareholders.”

Second Quarter 2025 Financial Results

Total net revenues for the second quarter of 2025 were RMB1,567.1 million (US$218.8 million), compared with RMB1,541.6 million for the same period of 2024.

Live streaming revenues were RMB1,153.2 million (US$161.0 million) for the second quarter of 2025, compared with RMB1,233.1 million for the same period of 2024, primarily due to the continued impact of the macroeconomic and industry environment.

Game-related services, advertising and other revenues were RMB413.9 million (US$57.8 million) for the second quarter of 2025, compared with RMB308.5 million for the same period of 2024. The increase was primarily due to higher revenues from game-related services and advertising, which were mainly attributable to the Company’s deepened cooperation with Tencent and other game companies.

Cost of revenues increased by 2.1% to RMB1,354.8 million (US$189.1 million) for the second quarter of 2025 from RMB1,326.7 million for the same period of 2024, primarily due to increased revenue sharing fees and content costs, partially offset by decreased bandwidth and server custody fees. Revenue sharing fees and content costs, a key component of cost of revenues, increased by 2.6% to RMB1,201.0 million (US$167.7 million) for the second quarter of 2025 from RMB1,170.2 million for the same period of 2024, primarily due to increased broadcaster-related costs, partially offset by lower costs related to licensed e-sports content.

Gross profit was RMB212.3 million (US$29.6 million) for the second quarter of 2025, compared with RMB214.9 million for the same period of 2024. Gross margin was 13.5% for the second quarter of 2025, compared with 13.9% for the same period of 2024, primarily attributable to increased revenue sharing fees and content costs as a percentage of total net revenues.

Research and development expenses decreased by 5.1% to RMB122.2 million (US$17.1 million) for the second quarter of 2025 from RMB128.7 million for the same period of 2024, primarily due to decreased personnel-related expenses and share-based compensation expenses.

Sales and marketing expenses decreased by 6.5% to RMB57.7 million (US$8.1 million) for the second quarter of 2025 from RMB61.7 million for the same period of 2024, primarily due to decreased channel promotion fees. 

General and administrative expenses remained flat year-over-year at RMB63.7 million (US$8.9 million) for the second quarter of 2025.

Other income was RMB7.6 million (US$1.1 million) for the second quarter of 2025, compared with RMB13.2 million for the same period of 2024, primarily attributable to a notable settlement income from disputes in the second quarter of 2024 and lower government subsidies.

Operating loss was RMB23.7 million (US$3.3 million) for the second quarter of 2025, compared with RMB26.0 million for the same period of 2024.

Non-GAAP operating income was RMB0.4 million (US$0.1 million) for the second quarter of 2025, compared with non-GAAP operating loss of RMB2.7 million for the same period of 2024.

Interest income was RMB59.1 million (US$8.2 million) for the second quarter of 2025, compared with RMB102.5 million for the same period of 2024, primarily due to a lower time deposit balance, which was mainly attributable to the special cash dividends paid.

Net loss attributable to HUYA Inc. was RMB5.5 million (US$0.8 million) for the second quarter of 2025, compared with net income attributable to HUYA Inc. of RMB29.6 million for the same period of 2024.

Non-GAAP net income attributable to HUYA Inc. was RMB47.5million (US$6.6 million) for the second quarter of 2025, compared with RMB97.0 million for the same period of 2024.

Basic and diluted net loss per American depositary share (“ADS”) were each RMB0.02 (US$0.00) for the second quarter of 2025. Basic and diluted net income per ADS were each RMB0.13 for the second quarter of 2024. Each ADS represents one Class A ordinary share of the Company.

Non-GAAP basic and diluted net income per ADS were each RMB0.21 (US$0.03) for the second quarter of 2025. Non-GAAP basic and diluted net income per ADS were RMB0.42 and RMB0.41, respectively, for the second quarter of 2024.

As of June 30, 2025, the Company had cash and cash equivalents, short-term deposits and long-term deposits of RMB3,766.4 million (US$525.8 million), compared with RMB6,254.6 million as of March 31, 2025.

Share Repurchase Program

Pursuant to the Company’s up-to-US$100 million share repurchase program authorized in August 2023, which has an extended expiration date of March 31, 2026, the Company had repurchased 22.8 million ADSs as of June 30, 2025, with a total aggregate consideration of US$75.4 million.

Earnings Webinar

The Company’s management will host a Tencent Meeting Webinar at 6:00 a.m. U.S. Eastern Time on August 12, 2025 (6:00 p.m. Beijing/Hong Kong time on August 12, 2025), to review and discuss the Company’s business and financial performance.

For participants who wish to join the webinar, please complete the online registration in advance using the links provided below. Upon registration, participants will receive an email with webinar access information, including meeting ID, meeting link, dial-in numbers, and a unique attendee ID to join the webinar.

Participant Online Registration:

Chinese Mainland[3]: https://meeting.tencent.com/dw/bqbrXw5NuYDH
International:             https://voovmeeting.com/dw/bqbrXw5NuYDH

A live webcast of the webinar will be accessible at https://ir.huya.com, and a replay of the webcast will be available following the session.

[1] “Non-GAAP net income attributable to HUYA Inc.” is defined as net (loss) income attributable to HUYA Inc. excluding share-based compensation expenses, impairment loss of investments, and amortization of intangible assets from business acquisitions, net of income taxes, to the extent applicable. For more information, please refer to the section titled “Use of Non-GAAP Financial Measures” and the table captioned “HUYA Inc. Unaudited Reconciliations of GAAP and Non-GAAP Results” at the end of this press release.

[2] Refers to the average total monthly active users who accessed the Company’s domestic and overseas platforms and services (primarily the domestic Huya Live platform, its global mobile application service platform, its overseas game live streaming platform, and related services), inclusive of users across all devices (mobile, PC and web). Average MAUs for any period is calculated by dividing (i) the sum of total active users for each month during such relevant period, by (ii) the number of months during such relevant period. The Company shifted to total MAU reporting starting from the second quarter of 2025 to provide a more comprehensive view of user activity, in line with its business expansion, cross-platform strategy, and overseas initiatives.

[3] For the purpose of this announcement only, Chinese Mainland excludes the Hong Kong Special Administrative Region, the Macao Special Administrative Region of the People’s Republic of China, and Taiwan.

About HUYA Inc.

HUYA Inc. is a leading game-related entertainment and services provider. Huya delivers dynamic live streaming and video content and a rich array of services spanning games, e-sports, and other interactive entertainment genres to a large, highly engaged community of game enthusiasts. Huya has cultivated a robust entertainment ecosystem powered by AI and other advanced technologies, serving users and partners across the gaming universe, including game companies, e-sports tournament organizers, broadcasters and talent agencies. Leveraging this strong foundation, Huya has also expanded into innovative game-related services, such as game distribution, in-game item sales, advertising and more. Huya continues to extend its footprint in China and abroad, meeting the evolving needs of gamers, content creators, and industry partners worldwide.

Use of Non-GAAP Financial Measures

The unaudited condensed consolidated financial information is prepared in conformity with accounting principles generally accepted in the United States of America (“U.S. GAAP”), except that the consolidated statement of changes in shareholders’ equity, consolidated statements of cash flows, and the detailed notes have not been presented. Huya uses non-GAAP gross profit, non-GAAP operating income (loss), non-GAAP net income attributable to HUYA Inc., non-GAAP net income attributable to ordinary shareholders, non-GAAP basic and diluted net income per ordinary share, and non-GAAP basic and diluted net income per ADS, which are non-GAAP financial measures. Non-GAAP gross profit is gross profit excluding share-based compensation expenses allocated in cost of revenues. Non-GAAP operating income (loss) is operating loss excluding share-based compensation expenses and amortization of intangible assets from business acquisitions. Non-GAAP net income attributable to HUYA Inc. is net income (loss) attributable to HUYA Inc. excluding share-based compensation expenses, impairment loss of investments, and amortization of intangible assets from business acquisitions, net of income taxes, to the extent applicable. Non-GAAP net income attributable to ordinary shareholders is net income (loss) attributable to ordinary shareholders excluding share-based compensation expenses, impairment loss of investments, and amortization of intangible assets from business acquisitions, net of income taxes, to the extent applicable. Non-GAAP basic and diluted net income per ordinary share and per ADS is non-GAAP net income attributable to ordinary shareholders divided by the weighted average number of ordinary shares and ADS used in the calculation of non-GAAP basic and diluted net income per ordinary share and per ADS. The Company believes that separate analysis and exclusion of the impact of (i) share-based compensation expenses, (ii) impairment loss of investments, and (iii) amortization of intangible assets from business acquisitions (net of income taxes), add clarity to the constituent parts of its performance. The Company reviews these non-GAAP financial measures together with GAAP financial measures to obtain a better understanding of its operating performance. It uses the non-GAAP financial measures for planning, forecasting and measuring results against the forecast. The Company believes that non-GAAP financial measures represent useful supplemental information for investors and analysts to assess its operating performance without the effect of (i) share-based compensation expenses, and (ii) amortization of intangible assets from business acquisitions (net of income taxes), which have been and will continue to be significant recurring expenses in its business, and (iii) impairment loss of investments, which may recur when there is observable price change in the future. However, the use of non-GAAP financial measures has material limitations as an analytical tool. One of the limitations of using non-GAAP financial measures is that they do not include all items that impact the Company’s net income (loss) for the period. In addition, because non-GAAP financial measures are not measured in the same manner by all companies, they may not be comparable to other similarly titled measures used by other companies. In light of the foregoing limitations, you should not consider a non-GAAP financial measure in isolation from or as an alternative to the financial measures prepared in accordance with U.S. GAAP.

The presentation of these non-GAAP financial measures is not intended to be considered in isolation from, or as a substitute for, the financial information prepared and presented in accordance with U.S. GAAP. For more information on these non-GAAP financial measures, please see the table captioned “HUYA Inc. Unaudited Reconciliations of GAAP and Non-GAAP Results” at the end of this announcement.

Exchange Rate Information

This announcement contains translations of certain RMB amounts into U.S. dollars at a specified rate solely for the convenience of the reader. Unless otherwise noted, all translations from RMB to U.S. dollars are made at a rate of RMB7.1636 to US$1.00, the noon buying rate in effect on June 30, 2025, in the H.10 statistical release of the Federal Reserve Board. The Company makes no representation that the Renminbi or U.S. dollar amounts referred to in this announcement could have been or could be converted into U.S. dollars or Renminbi, as the case may be, at any particular rate or at all.

Safe Harbor Statement

This announcement contains forward-looking statements. These statements are made under the “safe harbor” provisions of the U.S. Private Securities Litigation Reform Act of 1995. These forward-looking statements can be identified by terminology such as “will,” “expects,” “anticipates,” “future,” “intends,” “plans,” “believes,” “estimates” and similar statements. Among other things, the quotations from management in this announcement, as well as Huya’s strategic and operational plans, contain forward-looking statements. Huya may also make written or oral forward-looking statements in its periodic reports to the U.S. Securities and Exchange Commission (“SEC”), in its annual report to shareholders, in press releases and other written materials and in oral statements made by its officers, directors or employees to third parties. Statements that are not historical facts, including statements about Huya’s beliefs and expectations, are forward-looking statements. Forward-looking statements involve inherent risks and uncertainties. A number of factors could cause actual results to differ materially from those contained in any forward-looking statement, including but not limited to the following: Huya’s goals and strategies; Huya’s future business development, results of operations and financial condition; the expected growth of the live streaming market and game market; the expectation regarding the rate at which to gain active users, especially paying users; Huya’s ability to monetize the user base; Huya’s efforts in complying with applicable data privacy and security regulations; fluctuations in general economic and business conditions in China; the economy in China and elsewhere generally; any regulatory developments in laws, regulations, rules, policies or guidelines applicable to Huya; and assumptions underlying or related to any of the foregoing. Further information regarding these and other risks is included in Huya’s filings with the SEC. All information provided in this press release and in the attachments is as of the date of this press release, and Huya does not undertake any obligation to update any forward-looking statement, except as required under applicable law.

For investor and media inquiries, please contact:

In China:

HUYA Inc.
Investor Relations
Tel: +86-20-2290-7829
E-mail: ir@huya.com 

Piacente Financial Communications
Jenny Cai
Tel: +86-10-6508-0677
E-mail: huya@tpg-ir.com 

In the United States:

Piacente Financial Communications
Brandi Piacente
Tel: +1-212-481-2050
E-mail: huya@tpg-ir.com 


HUYA INC.

UNAUDITED CONDENSED CONSOLIDATED BALANCE SHEETS

(All amounts in thousands, except share, ADS, per share data and per ADS data)

As of December 31,

As of June 30,

2024

2025

2025

RMB

RMB

US$

Assets

Current assets

Cash and cash equivalents

1,188,911

499,305

69,700

Restricted cash

17,031

9,201

1,284

Short-term deposits

4,075,048

3,007,072

419,771

Accounts receivable, net

76,044

128,448

17,931

Prepaid assets and amounts due from related
   parties, net

207,565

324,577

45,309

Prepayments and other current assets, net

523,674

546,239

76,252

Total current assets

6,088,273

4,514,842

630,247

Non-current assets

Long-term deposits

1,470,000

260,000

36,295

Investments

440,790

405,157

56,558

Goodwill

463,796

461,873

64,475

Property and equipment, net

484,008

517,539

72,246

Intangible assets, net

153,190

142,843

19,940

Right-of-use assets, net

339,492

318,876

44,513

Prepayments and other non-current assets

128,262

26,411

3,687

Total non-current assets

3,479,538

2,132,699

297,714

Total assets

9,567,811

6,647,541

927,961

Liabilities and shareholders’ equity

Current liabilities

Accounts payable

66,613

47,121

6,578

Advances from customers and deferred revenue

265,628

242,925

33,911

Income taxes payable

54,594

58,104

8,111

Accrued liabilities and other current liabilities

1,360,949

1,018,664

142,200

Amounts due to related parties

161,529

149,151

20,821

Lease liabilities due within one year

28,581

21,800

3,043

Total current liabilities

1,937,894

1,537,765

214,664

Non-current liabilities

Lease liabilities

20,047

8,939

1,248

Deferred tax liabilities

23,405

21,248

2,966

Deferred revenue

35,786

34,278

4,785

Total non-current liabilities

79,238

64,465

8,999

Total liabilities

2,017,132

1,602,230

223,663


HUYA INC.

UNAUDITED CONDENSED CONSOLIDATED BALANCE SHEETS (CONTINUED)

(All amounts in thousands, except share, ADS, per share data and per ADS data)

As of December 31,

As of June 30,

2024

2025

2025

RMB

RMB

US$

Shareholders’ equity

Class A ordinary shares (US$0.0001 par value;
  750,000,000 shares authorized as of December
  31, 2024 and June 30, 2025, respectively;
  74,845,398 and 71,968,306 shares issued and
  outstanding as of December 31, 2024 and June
  30, 2025, respectively)

52

53

7

Class B ordinary shares (US$0.0001 par value;
  200,000,000 shares authorized as of December
  31, 2024 and June 30, 2025, respectively;
  150,386,517 and 150,386,517 shares issued and
  outstanding as of December 31, 2024 and June
30, 2025, respectively)

98

98

14

Treasury shares

(108,101)

(145,158)

(20,263)

Additional paid-in capital

8,866,492

6,440,422

899,048

Statutory reserves

122,429

122,429

17,090

Accumulated deficit

(2,100,291)

(2,104,905)

(293,833)

Accumulated other comprehensive income

770,000

732,372

102,235

Total shareholders’ equity

7,550,679

5,045,311

704,298

Total liabilities and shareholders’ equity

9,567,811

6,647,541

927,961


HUYA INC.

UNAUDITED CONDENSED CONSOLIDATED STATEMENTS OF OPERATIONS

(All amounts in thousands, except share, ADS, per share data and per ADS data)

Three Months Ended

Six Months Ended

June 30,

2024

March 31,

2025

June 30,

2025

June 30,

2025

June 30,

2024

June 30,

2025

June 30,

2025

RMB

RMB

RMB

US$

RMB

RMB

US$

Net revenues

Live streaming

1,233,064

1,138,151

1,153,232

160,985

2,493,508

2,291,383

319,865

Game-related services, advertising and others

308,518

370,434

413,857

57,772

552,121

784,291

109,483

Total net revenues

1,541,582

1,508,585

1,567,089

218,757

3,045,629

3,075,674

429,348

Cost of revenues(1)

(1,326,710)

(1,320,102)

(1,354,771)

(189,119)

(2,610,212)

(2,674,873)

(373,398)

Gross profit

214,872

188,483

212,318

29,638

435,417

400,801

55,950

Operating expenses(1)

Research and development expenses

(128,710)

(129,525)

(122,156)

(17,052)

(263,816)

(251,681)

(35,133)

Sales and marketing expenses

(61,689)

(60,695)

(57,699)

(8,054)

(137,921)

(118,394)

(16,527)

General and administrative expenses

(63,729)

(61,445)

(63,743)

(8,898)

(123,761)

(125,188)

(17,476)

Total operating expenses

(254,128)

(251,665)

(243,598)

(34,004)

(525,498)

(495,263)

(69,136)

Other income, net

13,219

3,534

7,577

1,058

25,528

11,111

1,551

Operating loss

(26,037)

(59,648)

(23,703)

(3,308)

(64,553)

(83,351)

(11,635)

Interest income

102,523

64,916

59,074

8,246

219,575

123,990

17,308

Impairment loss of investments

(45,079)

–

(30,000)

(4,188)

(45,079)

(30,000)

(4,188)

Foreign currency exchange gains (losses), net

364

(416)

(2,112)

(295)

(2,055)

(2,528)

(353)

Income before income tax expenses

31,771

4,852

3,259

455

107,888

8,111

1,132

Income tax expenses

(2,169)

(3,248)

(7,388)

(1,031)

(7,253)

(10,636)

(1,485)

Income (loss) before loss in equity method
   investments, net of income taxes

29,602

1,604

(4,129)

(576)

100,635

(2,525)

(353)

Loss in equity method investments, net of
   income taxes

–

(677)

(1,362)

(190)

–

(2,039)

(285)

Net income (loss) attributable to HUYA Inc.

29,602

927

(5,491)

(766)

100,635

(4,564)

(638)

Net income (loss) attributable to ordinary
   shareholders

29,602

927

(5,491)

(766)

100,635

(4,564)

(638)


HUYA INC.

UNAUDITED CONDENSED CONSOLIDATED STATEMENTS OF OPERATIONS (CONTINUED)

(All amounts in thousands, except share, ADS, per share data and per ADS data)

Three Months Ended

Six Months Ended

June 30,

2024

March 31,

2025

June 30,

2025

June 30,

2025

June 30,

2024

June 30,

2025

June 30,

2025

RMB

RMB

RMB

US$

RMB

RMB

US$

Net income (loss) per ordinary share

—Basic

0.13

0.00

(0.02)

(0.00)

0.43

(0.02)

(0.00)

—Diluted

0.13

0.00

(0.02)

(0.00)

0.43

(0.02)

(0.00)

Net income (loss) per ADS*

—Basic

0.13

0.00

(0.02)

(0.00)

0.43

(0.02)

(0.00)

—Diluted

0.13

0.00

(0.02)

(0.00)

0.43

(0.02)

(0.00)

Weighted average number of ADS used in
   calculating net income (loss) per ADS

—Basic

231,022,644

229,451,944

227,675,862

227,675,862

232,098,893

228,554,238

228,554,238

—Diluted

234,167,978

231,527,507

227,675,862

227,675,862

235,275,697

228,554,238

228,554,238

*    Each ADS represents one Class A ordinary share.

(1) Share-based compensation was allocated in cost of revenues and operating expenses as follows:


Three Months Ended

Six Months Ended

June 30,

2024

March 31,

2025

June 30,

2025

June 30,

2025

June 30,

2024

June 30,

2025

June 30,

2025

RMB

RMB

RMB

US$

RMB

RMB

US$

Cost of revenues

4,492

3,383

3,707

517

8,777

7,090

990

Research and development expenses

7,873

6,313

6,563

916

15,489

12,876

1,797

Sales and marketing expenses

446

320

394

55

812

714

100

General and administrative expenses

4,573

8,048

7,385

1,031

8,841

15,433

2,154


HUYA INC.

UNAUDITED RECONCILIATIONS OF GAAP AND NON-GAAP RESULTS

(All amounts in thousands, except share, ADS, per share data and per ADS data)

Three Months Ended

Six Months Ended

June 30,

2024

March 31,

2025

June 30,

2025

June 30,

2025

June 30,

2024

June 30,

2025

June 30,

2025

RMB

RMB

RMB

US$

RMB

RMB

US$

Gross profit

214,872

188,483

212,318

29,638

435,417

400,801

55,950

Share-based compensation expenses allocated
   in cost of revenues

4,492

3,383

3,707

517

8,777

7,090

990

Non-GAAP gross profit

219,364

191,866

216,025

30,155

444,194

407,891

56,940

Operating loss

(26,037)

(59,648)

(23,703)

(3,308)

(64,553)

(83,351)

(11,635)

Share-based compensation expenses

17,384

18,064

18,049

2,519

33,919

36,113

5,041

Amortization of intangible assets from
   business acquisitions

5,941

5,996

6,005

838

11,871

12,001

1,675

Non-GAAP operating (loss) income

(2,712)

(35,588)

351

49

(18,763)

(35,237)

(4,919)

Net income (loss) attributable to HUYA Inc.

29,602

927

(5,491)

(766)

100,635

(4,564)

(638)

Impairment loss of investments

45,079

–

30,000

4,188

45,079

30,000

4,188

Share-based compensation expenses

17,384

18,064

18,049

2,519

33,919

36,113

5,041

Amortization of intangible assets from
   business acquisitions, net of income taxes

4,931

4,977

4,984

696

9,853

9,961

1,391

Non-GAAP net income attributable to HUYA Inc.

96,996

23,968

47,542

6,637

189,486

71,510

9,982

Net income (loss) attributable to ordinary
   shareholders

29,602

927

(5,491)

(766)

100,635

(4,564)

(638)

Impairment loss of investments

45,079

–

30,000

4,188

45,079

30,000

4,188

Share-based compensation expenses

17,384

18,064

18,049

2,519

33,919

36,113

5,041

Amortization of intangible assets from
   business acquisitions, net of income taxes

4,931

4,977

4,984

696

9,853

9,961

1,391

Non-GAAP net income attributable to
   ordinary shareholders

96,996

23,968

47,542

6,637

189,486

71,510

9,982

Non-GAAP net income per ordinary share

—Basic

0.42

0.10

0.21

0.03

0.82

0.31

0.04

—Diluted

0.41

0.10

0.21

0.03

0.81

0.31

0.04

Non-GAAP net income per ADS

—Basic

0.42

0.10

0.21

0.03

0.82

0.31

0.04

—Diluted

0.41

0.10

0.21

0.03

0.81

0.31

0.04

Weighted average number of ADS used in
   calculating Non-GAAP net income per
   ADS

—Basic

231,022,644

229,451,944

227,675,862

227,675,862

232,098,893

228,554,238

228,554,238

—Diluted

234,167,978

231,527,507

230,562,291

230,562,291

235,275,697

231,018,054

231,018,054