Home Blog Page 3845

Global Education Leader Recognised: Trio Schools’ Managing Director receives prestigious BW Education 40 Under 40 award for educational innovation in India

BENGALURU, India, Feb. 21, 2025 /PRNewswire/ — Trio Schools’ Managing Director, Mr. Naveen KM has been honoured with the prestigious BW Education 40 under 40 award, in association with Business World, for his contributions to the field of education. The award highlights India’s growing prominence in international education. This recognition from Business World underscores the potential in India’s $100+ billion education sector and rapidly evolving educational landscape.

Business World Education 40 Under 40 award

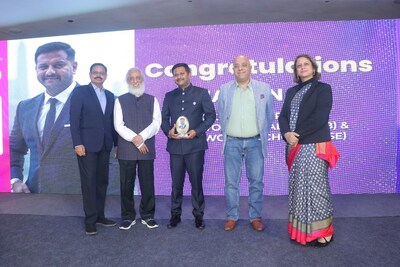
The award was presented by Prof. Anil Sahasrabudhe, Chairman of NAAC and NETF, and Dr. Annurag Batra, Chairman & Editor-in-Chief, BW & exchange4media Group. The award selection followed a comprehensive evaluation by a distinguished jury of education experts such as Dr. Annurag Batra, Lina Ashar, Prof. Punam Sahgal, Dr. Anup Singh, and Rupa Chakravarty.

The BW Education 40 under 40 Summit and Awards ceremony was held in New Delhi on 19 February 2025. The summit brought together key stakeholders, including venture capitalists, entrepreneurs, and education technology professionals.

Mr. Naveen, who is an avid entrepreneur and edupreneur, serves as the Managing Director of award-winning international and Indian educational ventures. The schools prioritise inclusivity and safety, with a strong focus on student happiness and fostering healthy teacher-student relationships.

Under Mr. Naveen’s leadership, Trio Schools has established a significant market presence through multiple successful ventures:

  • Trio World Academy, an authorised IB World School, certified as an “Institution of Happiness” by QS-iGAUGE in association with ASSOCHAM.
  • Trio World School, offering ICSE curriculum, preparing students for global opportunities while staying rooted in Indian cultural values.
  • India4IAS, an institute that offers rigorous training for some of the most challenging Indian public service exams like UPSC and KPSC.
  • Trio Educational Services, an organisation that aims to position India as a global leader in skilled human resources through comprehensive training programmes. In partnership with the Prime Minister’s “Skill India” Programme, 2,500 youth have been trained, with plans to train over 10,000 in the next two years.

Trio Schools’ model successfully combines international curricula with local market understanding, making premium education accessible to India’s growing middle class. The organisation’s growth trajectory aligns with India’s expanding education market, which presents significant opportunities for international investment.

“I am grateful for this incredible honour from BW Education. Our vision is to make international education accessible in India while maintaining global standards,” said Mr. Naveen. “We’ve developed a scalable model that makes IB and Cambridge curricula available to more Indian families, creating a bridge between international education standards and local market needs. This award belongs to the entire TRIO family for their dedication to reimagining education.”

About Trio World Academy

Trio Schools is a group that runs award-winning schools in Bengaluru.

Trio World Academy (TWA) is an authorised IB World school, located in Bengaluru, Karnataka. Established in 2009, it has emerged as a premium international school. It has been recognised as an Institution of Happiness by QS-iGAUGE, the only institution in the state to be granted the honour.

It caters to the educational needs of a vibrant multicultural community, which comprises students from 22+ countries. The teachers of TWA, who come from all over the world, bring with them their unique combination of world knowledge, and expertise. TWA offers IB PYP, Cambridge Secondary 1, IGCSE and IB DP.

Trio World School (TWS) is an ICSE school in Bengaluru, Karnataka. Established in 2014, it has emerged as one of the premium ICSE schools in North Bengaluru. TWS prepares students for global opportunities while staying rooted in Indian cultural values.

The schools instil in their students the core values of Leadership, Discipline, Academic Excellence and Service, preparing them to become the global leaders of the future. TRIO has been chosen “Best School Brand in India” by The Economic Times, New Delhi, in 2016 and has won numerous accolades on both national and international platforms.

For more information, contact: 
Public Relations Officer, Trio World Academy
+91 (80) 40611222


Dr. Sudhakar Rao, Director, ICFAI Group, Hyderabad; Prof. Anil Sahasrabudhe, Chairman, National Assessment and Accreditation Council (NAAC); Mr. Naveen KM, Managing Director, Trio Schools; Dr Annurag Batra, Chairman and Editor-in-Chief, Business World and Ms. Rupa Chakravarty, Principal, Suncity World School, Gurgaon.


Namibox and Hisense Form Strategic Collaboration to Launch the “Parent-Child Learning Big Screen,” Creating a New Ecosystem of “Educational Hardware + Emotional Economy”

SHANGHAI, Feb. 21, 2025 /PRNewswire/ — Jinxin Technology Holding Company (the “Company”) (Nasdaq: NAMI), an innovative provider of digital-content products and services in China, today announced that Namibox, a brand under the Company, has entered into a strategic partnership with Hisense Group (the “Hisense”). The partnership has resulted in the launch of their first collaborative product, the “Parent-Child Learning Big Screen,” which officially went on sale on February 20th. This product, dubbed “a learning tool for kids and a trusted companion for moms,” represents an innovative approach by combining elements of smart hardware, K-9 education, and emotional engagement. It is poised to lead a new wave in the multi-billion-dollar smart educational hardware industry.

Expanding the Learning Space: From “One-Way Output” to “Emotional Symbiosis”

According to the “Chinese Family Education Consumption White Paper” issued by the Ministry of Education, 82.6% of the Chinese families are currently facing “educational device anxiety.Traditional learning devices often rely on a “question bank + video course” model, while standard tablets pose the risk of addiction among children. To address these challenges, Namibox and Hisense have jointly developed the 27-inch movable “Parent-Child Learning Big Screen.” This device goes beyond combining hardware with learning software; it reimagines the family education ecosystem through three key innovations, creating a seamless blend of “education + emotion.”

Space Extension: Equipped with a retractable stand and omnidirectional wheels, the 27-inch big screen easily adapts to a variety of home learning scenarios. Whether children are attending online classes in the living room, engaging in parent-child fitness routines, learning math with weighing tools in the kitchen, or enjoying bilingual reading in the bedroom, this versatile device supports it all. By catering to modern family dynamics, where the living room often doubles as a study area, the screen transforms traditional learning hardware from a single-use device into a multi-functional, interactive tool that fosters immersive family learning experiences.

Role Reconstruction: The device transforms parents’ roles from “overseers” to “teammates.” Its movable, multifunctional design enables transitions between learning mode and family mode, allowing parents and children to learn, read, exercise, and play together. This redefinition of family space not only enhances the functionality of the home but also deepens emotional connections, positioning the learning screen as a pivotal “third anchor” in the household, alongside the stove and television.

Content Upgrade: Namibox leverages cutting-edge AI, AR, and digital human technologies to develop an advanced digital educational content engine. This engine delivers a rich array of K9 educational materials, including synchronized learning content infused with AI and digital human elements. These innovations breathe new life into traditional digital textbooks, online courses, and exercises, creating a dynamic, closed -loop system of learning, practicing, and testing. The intelligent and interactive design significantly boosts students’ engagement, interest, and autonomy.

Technological Excellence: Hardware Innovation Meets Eye Protection

The “Parent-Child Learning Big Screen” incorporates Hisense’s flagship TV picture quality technology, setting a new benchmark for display quality in educational devices. Its IPS paper-like eye-protection screen, combined with Hisense’s 7-layer eye-protection process certified by TÜV Rheinland, ensures optimal visual comfort and health for users.

A standout feature of the device is its dual-system intelligent switching design. In “Learning Mode,” entertainment apps are automatically blocked, while “Family Mode” unlocks entertainment and audio-visual functionalities. This concept of “education not opposing human nature, entertainment not losing control” meets the core demands of parents who want effective learning tools without sacrificing leisure and family bonding.

A Game-Changer in the Billion-Dollar Smart Educational Hardware Market

According to IDC, the Chinese smart educational hardware market is projected to exceed RMB100 billion by 2024, despite a product homogenization rate as high as 76%. The “catfish effect” brought by this cross-industry collaboration between Namibox and Hisense has drawn significant industry attention. The Company believes that the “Parent-Child Learning Big Screen” could catalyze a “living room education economy,” paving the way for future business opportunities such as family education consulting and personalized tutoring, powered by behavior data collected through parent-child collaboration. This strategic partnership represents more than just a complementary alignment of strengths; it is a bold exploration of the future ecosystem for smart hardware. By combining technological innovation with educational depth, Namibox and Hisense are unlocking new possibilities for the smart educational hardware industry.

About Jinxin Technology Holding Company

Headquartered in Shanghai, China, Jinxin Technology Holding Company is an innovative provider of digital-content products and services in China. Leveraging the powerful digital content generation engine powered by advanced AI/AR/VR/digital human technologies, the Company is committed to offering users high-quality digital content services through both its own platform and the content distribution channels of its strong partners. The Company currently target K-9 students in China, with core expertise in providing them digital and integrated educational contents, and plan to further expand service offerings to provide premium and engaging digital contents to other age groups. The Company collaborates with leading textbook publishers in China and provides digital version of mainstream textbooks used in primary schools and middle schools. The Company’s AI-generated content technology enables comprehensive digital contents to deliver an interactive, intelligent and entertaining learning experience. The Company distributes digital contents primarily through (i) its flagship learning app, Namibox, (ii) telecom and broadcast operators and (iii) third-party devices with our contents embedded.

For more information, please visit the Company’s website at https://ir.namibox.com.

Safe Harbor Statements

This press release contains statements that constitute “forward-looking” statements. These statements are made under the “safe harbor” provisions of the U.S. Private Securities Litigation Reform Act of 1995. Statements that are not historical facts, including but not limited to statements about the Company’s beliefs, plans and expectations, are forward-looking statements. These forward-looking statements can be identified by terminology such as “may,” “will,” “expect,” “anticipate,” “target,” “aim,” “future,” “intend,” “plan,” “believe,” “estimate,” “likely to” or other similar expressions. The Company may also make written or oral forward-looking statements in its periodic reports to the U.S. Securities and Exchange Commission (the “SEC”), in its annual report to shareholders, in press releases and other written materials and in oral statements made by its officers, directors or employees to third parties. Forward-looking statements involve inherent risks and uncertainties. A number of factors could cause actual results to differ materially from those contained in any forward-looking statement. Further information regarding these and other risks, uncertainties or factors is included in the Company’s filings with the SEC. All information provided in this press release is as of the date of this press release, and the Company undertakes no obligation to update any forward-looking statement, except as required under applicable law.

For investor and media inquiries, please contact:

Jinxin Technology Holding Company
Investor Relations Department
Email: ir@namibox.com

NaaS Technology Inc. Announces US$10 Million Share Repurchase Program

BEIJING, Feb. 21, 2025 /PRNewswire/ — NaaS Technology Inc. (Nasdaq: NAAS) (“NaaS” or the “Company”), the first U.S.-listed EV charging service company in China, today announced that its board of directors (the “Board”) has approved a share repurchase program (the “Share Repurchase Program”), effective from February 21, 2025. Pursuant to the Share Repurchase Program, the Company may repurchase up to US$10 million of its American depositary shares (“ADSs”) over the next 12 months through the end of February 2026.

The Company’s proposed repurchases may be made from time to time on the open market at prevailing market prices, in privately negotiated transactions, in block trades and/or through other legally permissible means, depending on market conditions and in accordance with applicable rules and regulations. The Board will review the share repurchase program periodically, and may authorize adjustment of its terms and size.

About NaaS Technology Inc.

NaaS Technology Inc. is the first U.S. listed EV charging service company in China. The Company is a subsidiary of Newlinks Technology Limited, a leading energy digitalization group in China. The Company provides one-stop solutions to energy asset owners comprising charging services, energy solutions and new initiatives, supporting every stage of energy assets’ lifecycle and facilitating energy transition.

Safe Harbor Statement

This press release contains statements of a forward-looking nature. These statements are made under the “safe harbor” provisions of the U.S. Private Securities Litigation Reform Act of 1995. You can identify these forward-looking statements by terminology such as “will,” “expects,” “believes,” “anticipates,” “intends,” “estimates” and similar statements. These forward-looking statements involve known and unknown risks and uncertainties and are based on current expectations, assumptions, estimates and projections about the Company and the industry. All information provided in this press release is as of the date hereof, and the Company undertakes no obligation to update any forward-looking statements to reflect subsequent occurring events or circumstances, or changes in its expectations, except as may be required by law. Although the Company believes that the expectations expressed in these forward-looking statements are reasonable, it cannot assure you that its expectations will turn out to be correct, and investors are cautioned that actual results may differ materially from the anticipated results. A number of factors could cause actual results to differ materially from those contained in any forward-looking statement, including but not limited to the following: NaaS’ goals and strategies; its future business development, financial conditions and results of operations; its ability to continuously develop new technology, services and products and keep up with changes in the industries in which it operates; growth of China’s EV charging industry and EV charging service industry and NaaS’ future business development; demand for and market acceptance of NaaS’ products and services; NaaS’ ability to protect and enforce its intellectual property rights; NaaS’ ability to attract and retain qualified executives and personnel; the COVID-19 pandemic and the effects of government and other measures that have been or will be taken in connection therewith; U.S.-China trade war and its effect on NaaS’ operation, fluctuations of the RMB exchange rate, and NaaS’ ability to obtain adequate financing for its planned capital expenditure requirements; NaaS’ relationships with end-users, customers, suppliers and other business partners; competition in the industry; relevant government policies and regulations related to the industry; and fluctuations in general economic and business conditions in China and globally. Further information regarding these and other risks is included in NaaS’ filings with the SEC.

For investor and media inquiries, please contact:

Investor Relations
NaaS Technology Inc.
E-mail: ir@enaas.com
Media inquiries:
E-mail: pr@enaas.com 

Autoliv Declares Quarterly Dividend

STOCKHOLM, Feb. 21, 2025 /PRNewswire/ — Autoliv, Inc. (NYSE: ALV) (SSE: ALIV.sdb), the worldwide leader in automotive safety systems, today announced that its Board of Directors has declared a quarterly dividend of 70 cents for the first quarter of 2025.

To holders of record on the close of business on Friday, March 7, the dividend will be payable on:

  • Monday, March 24, 2025 to holders of Autoliv common stock listed on the New York Stock Exchange (Common Stock); and
  • Tuesday, March 25, 2025 to holders of Autoliv Swedish Depository Receipts listed on Nasdaq Stockholm (SDRs).

The ex-date will be:

  • Friday, March 7, for holders of Common Stock; and
  • Thursday, March 6, for holders of SDRs.

Inquiries: 

Investors & Analysts: Anders Trapp, Tel +46 (0)8 587 206 71
Investors & Analysts: Henrik Kaar, Tel +46 (0)8 587 206 14

Media: Gabriella Etemad, Tel +46 (0)8 587 206 02

This information is information that Autoliv, Inc. is obliged to make public pursuant to the EU Market Abuse Regulation. The information was submitted for publication, through the contact person set out above, at 11:15 CET on February 21, 2025.

About Autoliv

Autoliv, Inc. (NYSE: ALV; Nasdaq Stockholm: ALIV.sdb) is the worldwide leader in automotive safety systems. Through our group companies, we develop, manufacture and market protective systems, such as airbags, seatbelts, and steering wheels for all major automotive manufacturers in the world as well as mobility safety solutions, such as pedestrian protection, connected safety services and safety solutions for riders of powered two wheelers. At Autoliv, we challenge and re-define the standards of mobility safety to sustainably deliver leading solutions. In 2024, our products saved close to 37,000 lives and reduced more than 600,000 injuries.

We have operations in 25 countries, and we drive innovation, research, and development at our 13 technical centers. Our 65,000 employees are passionate about our vision of Saving More Lives and quality is at the heart of everything we do. Sales in 2024 amounted to $10.4 billion. For more information go to www.autoliv.com

Safe Harbor Statement

This report contains statements that are not historical facts but rather forward-looking statements within the meaning of the Private Securities Litigation Reform Act of 1995. Such forward-looking statements include those that address activities, events or developments that Autoliv, Inc. or its management believes or anticipates may occur in the future. All forward-looking statements are based upon our current expectations, various assumptions and data available from third parties. Our expectations and assumptions are expressed in good faith and we believe there is a reasonable basis for them. However, there can be no assurance that such forward-looking statements will materialize or prove to be correct as forward-looking statements are inherently subject to known and unknown risks, uncertainties and other factors which may cause actual future results, performance or achievements to differ materially from the future results, performance or achievements expressed in or implied by such forward-looking statements. Numerous risks, uncertainties and other factors may cause actual results to differ materially from those set out in the forward-looking statements, including general economic conditions and fluctuations in the global automotive market. For any forward-looking statements contained in this or any other document, we claim the protection of the safe harbor for forward-looking statements contained in the Private Securities Litigation Reform Act of 1995, and we assume no obligation to update publicly or revise any such statements in light of new information or future events, except as required by law. 

This information was brought to you by Cision http://news.cision.com

https://news.cision.com/autoliv/r/autoliv-declares-quarterly-dividend,c4109328

The following files are available for download:


“AI in Action” Career Day Inaugural AI-Focused Recruitment Drive 1,000+ Tech Roles to Attract Top Talent and Address Industry Demands


HONG KONG SAR – Media OutReach Newswire – 21 February 2025 – The Hong Kong Science and Technology Parks Corporation (HKSTP) successfully hosted the “AI in Action” Career Day, attracting over 3,000 visitors. Marking HKSTP’s first-ever AI-focused recruitment initiative, the event delivered a one-stop career platform tailored for young professionals and graduates, connecting them with over 150 AI-specialised companies. Together, these innovators showcased 1,000+ roles in cutting-edge fields including software development, data analytics, and large-scale model algorithms, addressing critical talent demands across the AI ecosystem.

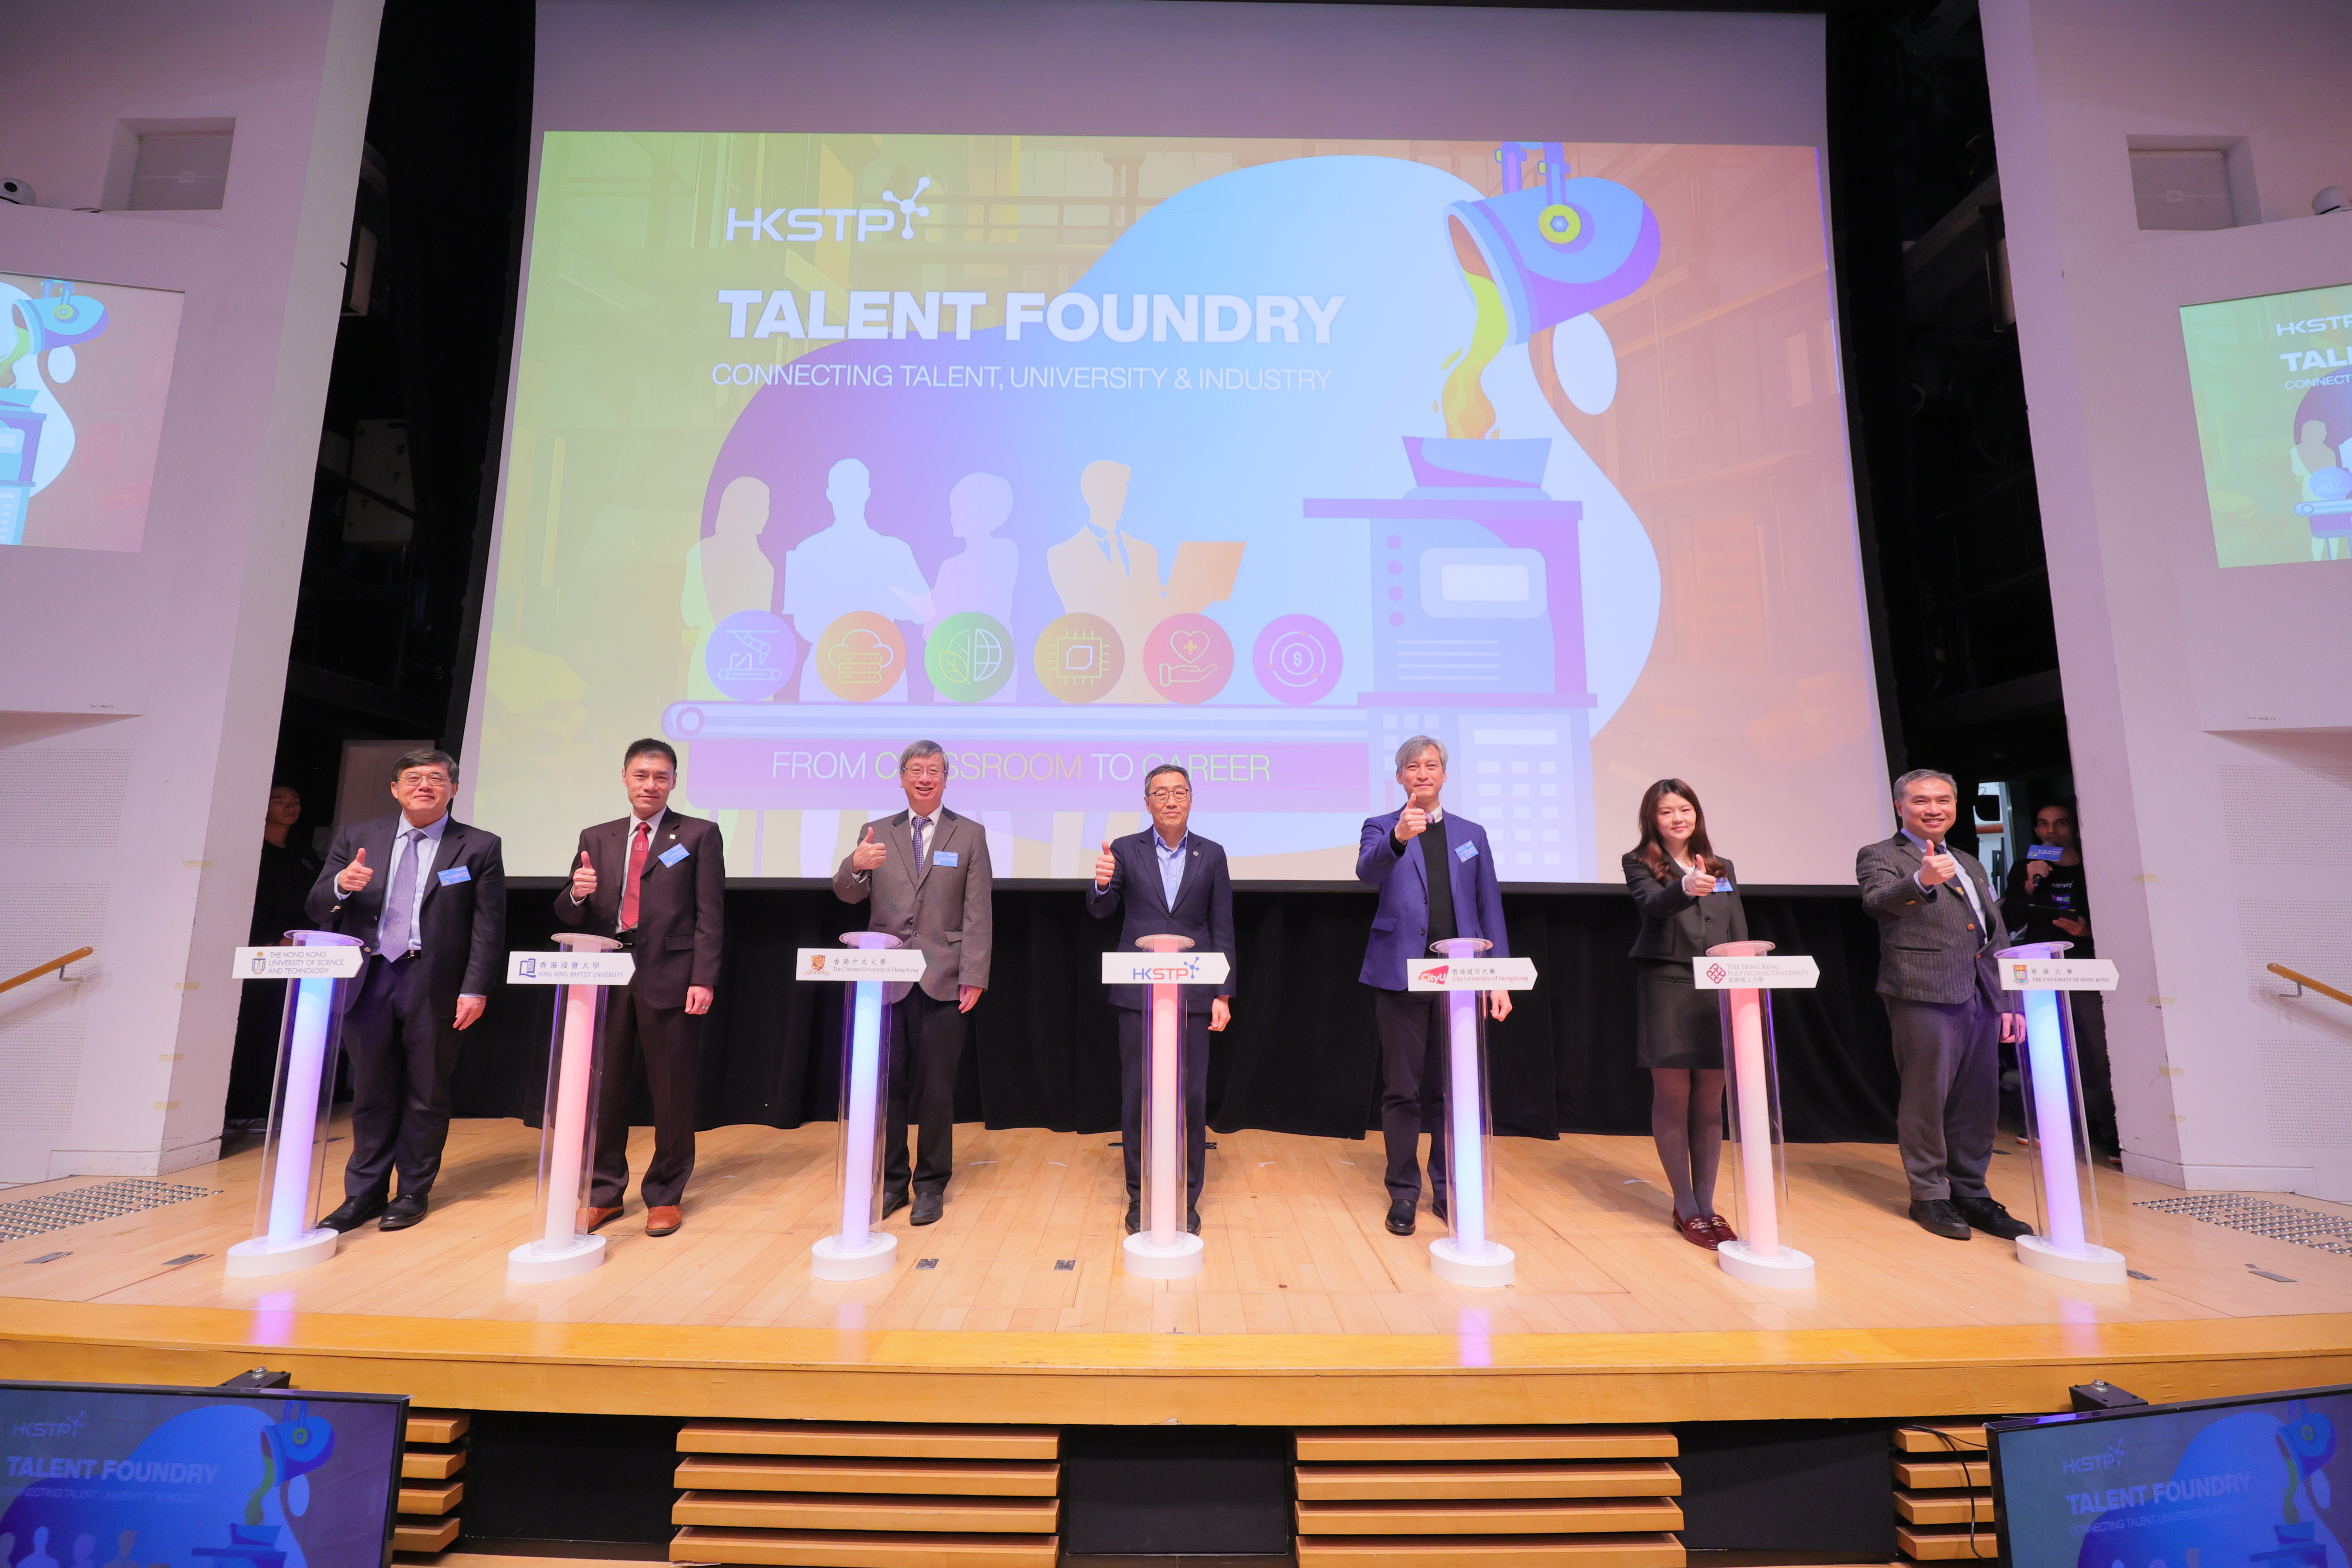
HKSTP launched the 'Talent Foundry' initiative, bringing together deans and associate deans from the engineering and computer science faculties of the Chinese University of Hong Kong, City University of Hong Kong, Hong Kong Baptist University, Hong Kong Polytechnic University, Hong Kong University of Science and Technology, and the University of Hong Kong.
HKSTP launched the ‘Talent Foundry’ initiative, bringing together deans and associate deans from the engineering and computer science faculties of the Chinese University of Hong Kong, City University of Hong Kong, Hong Kong Baptist University, Hong Kong Polytechnic University, Hong Kong University of Science and Technology, and the University of Hong Kong.

Agile Response to Market Needs and Attracting Top AI Talent

The “AI in Action” Career Day was held in a hybrid format (physical and virtual), uniting leading AI enterprises across both platforms. Participants engaged directly with hiring representatives at the venue or explored job vacancies, requirements, and submitted applications via the online “Talent Pool” platform. The event also featured skill-building workshops on jobsearch techniques and personal brand-building, alongside industry insight sessions where participants interacted with experts from global leaders such as NVIDIA, Deloitte AI Institute, and Madhead. These engagements offered deep insights into AI advancements, career pathways, and emerging industry trends.

Mr Albert Wong, CEO of HKSTP, said: “We are delighted by the overwhelming turnout, which underscores the industry’s strong demand for AI talent. In this era of rapid technological evolution, HKSTP is committed to bridging the gap between technological innovation and top talent. Going forward, we will continue to adapt proactively to market dynamics, leveraging thematic recruitment initiatives to address specific talent needs. We look forward to working hand-in-hand with the next generation of innovators and academic institutions to establish Hong Kong as a key global hub for technological innovation.”

Launching the ‘Talent Foundry’ Initiative to Strengthen Collaboration Among Talent, Universities, and Industry

To unlock the potential of Hong Kong’s students and strengthen the local talent pipeline, HKSTP, in collaboration with engineering and computer science faculties from universities in Hong Kong, launched the “Talent Foundry” initiative to bridge the gap between student skills and job market needs, fostering closer ties between academia and the I&T industry.

The official launch brought together deans and associate deans from the Chinese University of Hong Kong, City University of Hong Kong, Hong Kong Baptist University, Hong Kong Polytechnic University, Hong Kong University of Science and Technology, and the University of Hong Kong. Their participation highlights the strong university-industry collaboration fostered by the Talent Foundry initiative.

Talent Foundry connects students and graduates with enterprises and startups in the Science Park ecosystem, creating career pathways and providing professional development to immerse young talent in the vibrant I&T community.

Through this initiative, HKSTP is committed to nurturing talent and driving Hong Kong’s growth as a global innovation hub.

HKSTP Recruits Global Tech Talent and Showcases Hong Kong’s I&T Opportunities Worldwide

Building on the success of the first ‘AI In Action’ Career Day in 2025, plans are underway to explore additional themed recruitment initiatives such as microelectronics, life and health tech, and financial technology aimed at fostering connections between talent and opportunity in innovative ways.

To further expand Hong Kong’s I&T talent base and solidify its position as a global hub for top-tier professionals, an HKSTP delegation will embark on a talent recruitment mission to the United Kingdom in March. The delegation will engage with prestigious universities and research institutions to explore collaborative talent development frameworks, while also connecting directly with students through campus engagements. These interactions will showcase Hong Kong’s dynamic I&T ecosystem, highlighting diverse internships and high-growth career pathways within the city’s thriving innovation landscape.

Hashtag: #HKSTP #AIinAction

The issuer is solely responsible for the content of this announcement.

About Hong Kong Science and Technology Parks Corporation

Hong Kong Science and Technology Parks Corporation (HKSTP) was established in 2001 to create a thriving I&T ecosystem grooming 13 unicorns, more than 15,000 research professionals and over 2,200 technology companies from 26 countries and regions focused on developing healthtech, AI and robotics, fintech and smart city technologies, etc.

Our growing innovation ecosystem offers comprehensive support to attract and nurture talent, accelerate and commercialise innovation for technology ventures, with the I&T journey built around our key locations of Hong Kong Science Park in Pak Shek Kok, InnoCentre in Kowloon Tong and three modern InnoParks in Tai Po, Tseung Kwan O and Yuen Long realising a vision of new industrialisation for Hong Kong, where sectors including advanced manufacturing, micro-electronics and biotechnology are being reimagined.

Hong Kong Science Park Shenzhen Branch in Futian, Shenzhen plays positive roles in connecting the world and the mainland with our proximity, strengthening cross-border exchange to bring advantages in attracting global talent and allowing possibilities for the development of technology companies in seven key areas: Medtech, big data and AI, robotics, new materials, microelectronics, fintech and sustainability, with both dry and wet laboratories, co-working space, conference and exhibition facilities, and more.

Through our R&D infrastructure, startup support and enterprise services, commercialisation and investment expertise, partnership networks and talent traction, HKSTP continues contribute in establishing I&T as a pillar of growth for Hong Kong.

More information about HKSTP is available at .

Key European events in Q1 2025: strategic considerations for traders by global broker Octa


KUALA LUMPUR, MALAYSIA – Media OutReach Newswire – 21 February 2025 – The beginning of 2025 witnessed a complex geopolitical scenario in Europe, with the most prominent events expected to impact financial markets. The intersection of political instability, economic tensions, and global trade dynamics makes it crucial for traders to be vigilant and reactive. Understanding these events is essential to forming well-informed trading strategies. Kar Yong Ang, a financial market analyst at Octa Broker, identifies Europe’s recent key events and highlights the key points to keep an eye on.

Octa

The Russia-Ukraine conflict and market stability
The prolonged conflict between Russia and Ukraine continues to breed uncertainty across European markets. Sanctions and geopolitical tensions have led to supply disruptions in the energy sector, particularly in Germany’s industrial sector. In contrast, exporters in Europe face higher competition from China, degenerating trade imbalances, as well as pressure in the manufacturing sector. Irrespective of the challenges facing European markets, major industries in the region diversified supply chains, accelerating shifts toward alternative sources of energy to neutralize long-term threats.

Donald Trump’s presidential campaign and its global repercussions
European markets are increasingly anxious about Donald Trump’s return to the U.S. presidency. His economic policies, which previously disrupted international trade, are again in the spotlight. European companies, particularly those that operate in renewable energy, have expressed concerns regarding possible tariffs that can slow down investments in wind farms and solar projects. The euro has also shown volatility against the U.S. dollar since investors are unsure of future trade terms.

‘Trump administration’s return is injecting volatility into the markets, particularly in sectors reliant on stable U.S.-EU trade policies, especially after the President started to impose new tariffs. Traders should closely monitor shifts in tariffs and trade rhetoric, as these could drive substantial Forex and commodity price movements’, Kar Yong Ang explains.

Germany’s election and its potential market impact
Germany’s federal election on 23 February 2025 marks a watershed moment for European markets. The outcome of the elections can potentially redefine fiscal and monetary policies while impacting energy reforms, China-Germany relations, and long-term investment plans. Major policy shifts are anticipated, particularly in the area of addressing underinvestment in key industries. Export-based industries are gearing up for potential disruptions, with initial government reports indicating a decline in Germany’s trade volume in 2025 due to increasing global tensions.

France’s national debt crisis and its implications
France’s escalating national debt is a problem for the Eurozone, as rising government borrowing jeopardises investor confidence. As of Q3 2024, France is in the top three countries with the highest governmental debt to GDP (113.8%) and its growth dynamics (+1.4 pp in Q3 24 compared to Q2 24), according to Eurostat. With each rise in debt-to-GDP ratios, concern about the sustainability of fiscal policy is causing sovereign bond investors to tread carefully. France’s financial vulnerability also alarms the Eurozone banking system, which is still heavily exposed to sovereign debt markets.

Kar Yong Ang notes, ‘France’s fiscal trajectory is a crucial determinant for Eurozone stability. Investors should pay close attention to policy announcements regarding debt management, as any sign of strain could reverberate across European financial institutions’.

Banking sector risks and asset class correlations
Geopolitical risk and tighter financial conditions are contributing to compounding threats to the Eurozone banking system. Market volatility is still an issue, and highly leveraged or poorly cashed institutions are particularly vulnerable. The interconnectedness between financial institutions raises systemic threats, so localised instability can translate into broader market consequences.

As geopolitical events unfold, correlations among asset classes are shifting. European equities have held up well, even as global markets contend with volatility. Experts predict that while short-term risks persist, recovery trade opportunities will emerge, particularly in undervalued European equities and commodities.

In Q1 2025, key economic events to look out for were the nature of U.S. trade policy, the Russia-Ukraine conflict, German election results, and French budgetary policies. While all of them presented significant opportunities, they also imposed volatility risks. Traders who monitored these could have adjusted their risk management strategy accordingly. To successfully navigate market volatility, one may apply portfolio diversification. Such an approach allows one to deal in several assets, abandoning volatile ones in times of market turbulence.

___

Disclaimer: Trading involves risks and may not be suitable for all investors. Use your expertise wisely and evaluate all associated risks before making an investment decision.
Hashtag: #Octa

The issuer is solely responsible for the content of this announcement.

Octa

is an international CFD broker that has been providing online trading services worldwide since 2011. It offers commission-free access to financial markets and various services used by clients from 180 countries who have opened more than 52 million trading accounts. To help its clients reach their investment goals, Octa offers free educational webinars, articles, and analytical tools.

The company is involved in a comprehensive network of charitable and humanitarian initiatives, including the improvement of educational infrastructure and short-notice relief projects supporting local communities.

In the APAC region, Octa received the ‘Best Trading Platform Malaysia 2024’ and the ‘Most Reliable Broker Asia 2023’ awards from Brands and Business Magazine and International Global Forex Awards, respectively.

Vipshop Reports Unaudited Fourth Quarter and Full Year 2024 Financial Results

Conference Call to Be Held at 7:00 A.M. U.S. Eastern Time on February 21, 2025

GUANGZHOU, China, Feb. 21, 2025 /PRNewswire/ — Vipshop Holdings Limited (NYSE: VIPS), a leading online discount retailer for brands in China (“Vipshop” or the “Company”), today announced its unaudited financial results for the quarter and full year ended December 31, 2024.

Fourth Quarter and Full Year 2024 Highlights

  • Total net revenues for the fourth quarter of 2024 were RMB33.2 billion (US$4.6 billion), compared with RMB34.7 billion in the prior year period. Total net revenues for the full year of 2024 were RMB108.4 billion (US$14.9 billion), compared with RMB112.9 billion in the prior year.
  • GMV[1] for the fourth quarter of 2024 was RMB66.2 billion, compared with RMB66.4 billion in the prior year period. GMV for the full year of 2024 increased by 0.6% year over year to RMB209.3 billion from RMB208.0 billion in the prior year.
  • Gross profit for the fourth quarter of 2024 was RMB7.6 billion (US$1.0 billion), compared with RMB8.2 billion in the prior year period. Gross profit for the full year of 2024 was RMB25.5 billion (US$3.5 billion), compared with RMB25.7 billion in the prior year.
  • Net income attributable to Vipshop’s shareholders for the fourth quarter of 2024 was RMB2.4 billion (US$335.2 million), compared with RMB3.0 billion in the prior year period. Net income attributable to Vipshop’s shareholders for the full year of 2024 was RMB7.7 billion (US$1.1 billion), compared with RMB8.1 billion in the prior year.
  • Non-GAAP net income attributable to Vipshop’s shareholders[2] for the fourth quarter of 2024 was RMB3.0 billion (US$407.4 million), compared with RMB3.2 billion in the prior year period. Non-GAAP net income attributable to Vipshop’s shareholders for the full year of 2024 was RMB9.0 billion (US$1.2 billion), compared with RMB9.5 billion in the prior year.
  • The number of active customers[3] for the fourth quarter of 2024 was 45.7 million, compared with 48.5 million in the prior year period. The number of active customers for the full year of 2024 was 84.7 million, compared with 87.4 million in the prior year.
  • Total orders[4] for the fourth quarter of 2024 were 217.5 million, compared with 234.3 million in the prior year period. Total orders for the full year of 2024 were 757.5 million, compared with 812.3 million in the prior year.

Mr. Eric Shen, Chairman and Chief Executive Officer of Vipshop, stated, “We delivered results well above our expectations in the fourth quarter, concluding a challenging year. Apparel categories achieved positive growth for both the quarter and full year, as we built upon our merchandising strength to introduce more unique, off-price seasonal offerings that met consumer needs. This helped our total GMV surpass RMB200 billion again in 2024. Super VIPs demonstrated strong momentum with double digit growth and more resilient spending, as they continued to respond to our differentiated value proposition. With the continuity of our strategy, and increased agility and flexibility in our business, we are better positioned going into 2025 and remain confident in our long-term growth trajectory.”

Mr. Mark Wang, Chief Financial Officer of Vipshop, further commented, “We are pleased to have achieved a better balance in our business in the fourth quarter after we reallocated resources to maximize growth while maintaining solid profitability. We believe the swift and disciplined actions taken within our organization have put us on the right track toward returning to sustainable and profitable growth in the foreseeable future. Meanwhile, reflecting our strong profitability and free cash flow, we are committed to consistently delivering value for our shareholders through both share repurchase and cash dividend in 2025.”

Fourth Quarter 2024 Financial Results

REVENUES

Total net revenues for the fourth quarter of 2024 were RMB33.2 billion (US$4.6 billion), compared with RMB34.7 billion in the prior year period.

GROSS PROFIT

Gross profit for the fourth quarter of 2024 was RMB7.6 billion (US$1.0 billion), compared with RMB8.2 billion in the prior year period. Gross margin for the fourth quarter of 2024 was 23.0%, compared with 23.7% in the prior year period.

OPERATING EXPENSES

Total operating expenses for the fourth quarter of 2024 were RMB5.1 billion (US$694.0 million), compared with RMB4.9 billion in the prior year period. As a percentage of total net revenues, total operating expenses for the fourth quarter of 2024 was 15.2%, compared with 14.0% in the prior year period.

  • Fulfillment expenses for the fourth quarter of 2024 decreased by 2.5% year over year to RMB2.46 billion (US$337.2 million) from RMB2.53 billion in the prior year period. As a percentage of total net revenues, fulfillment expenses for the fourth quarter of 2024 was 7.4%, compared with 7.3% in the prior year period.
  • Marketing expenses for the fourth quarter of 2024 increased by 10.3% year over year to RMB930.3 million (US$127.5 million) from RMB843.2 million in the prior year period. As a percentage of total net revenues, marketing expenses for the fourth quarter of 2024 was 2.8%, compared with 2.4% in the prior year period.
  • Technology and content expenses for the fourth quarter of 2024 decreased by 5.5% year over year to RMB469.2 million (US$64.3 million) from RMB496.4 million in the prior year period. As a percentage of total net revenues, technology and content expenses for the fourth quarter of 2024 was 1.4%, which stayed flat as compared with that in the prior year period.
  • General and administrative expenses for the fourth quarter of 2024 increased by 20.0% year over year to RMB1.2 billion (US$165.1 million) from RMB1.0 billion in the prior year period. As a percentage of total net revenues, general and administrative expenses for the fourth quarter of 2024 was 3.6%, compared with 2.9% in the prior year period.

INCOME FROM OPERATIONS

Income from operations for the fourth quarter of 2024 was RMB2.9 billion (US$390.6 million), compared with RMB3.7 billion in the prior year period. Operating margin for the fourth quarter of 2024 was 8.6%, compared with 10.6% in the prior year period.

Non-GAAP income from operations[5] for the fourth quarter of 2024, which excluded share-based compensation expenses, was RMB3.4 billion (US$464.5 million), compared with RMB4.0 billion in the prior year period. Non-GAAP operating margin[6] for the fourth quarter of 2024 was 10.2%, compared with 11.4% in the prior year period.

NET INCOME

Net income attributable to Vipshop’s shareholders for the fourth quarter of 2024 was RMB2.4 billion (US$335.2 million), compared with RMB3.0 billion in the prior year period. Net margin attributable to Vipshop’s shareholders for the fourth quarter of 2024 was 7.4%, compared with 8.5% in the prior year period. Net income attributable to Vipshop’s shareholders per diluted ADS[7] for the fourth quarter of 2024 was RMB4.69 (US$0.64), compared with RMB5.35 in the prior year period.

Non-GAAP net income attributable to Vipshop’s shareholders for the fourth quarter of 2024, which excluded (i) share-based compensation expenses, (ii) impairment loss of investments, (iii) investment loss (gain) and revaluation of investments excluding dividends, (iv) reconciling items on the share of equity method investments, and (v) tax effects on non-GAAP adjustments, was RMB3.0 billion (US$407.4 million), compared with RMB3.2 billion in the prior year period. Non-GAAP net margin attributable to Vipshop’s shareholders[8] for the fourth quarter of 2024 was 9.0%, compared with 9.2% in the prior year period. Non-GAAP net income attributable to Vipshop’s shareholders per diluted ADS[9] for the fourth quarter of 2024 was RMB5.70 (US$0.78), compared with RMB5.79 in the prior year period.

For the quarter ended December 31, 2024, the Company’s weighted average number of ADSs used in computing diluted income per ADS was 521,501,399.

BALANCE SHEET AND CASH FLOW

As of December 31, 2024, the Company had cash and cash equivalents and restricted cash of RMB27.0 billion (US$3.7 billion) and short term investments of RMB1.9 billion (US$256.6 million).

For the quarter ended December 31, 2024, net cash generated from operating activities was RMB8.9 billion (US$1.2 billion), and free cash flow[10], a non-GAAP measurement of liquidity, was as follows:

For the three months ended

Dec 31, 2023

RMB’000

Dec 31, 2024

RMB’000

Dec 31, 2024

US$’000

Net cash generated from operating activities

8,696,378

8,893,726

1,218,435

Reconciling items:

   Net impact from internet financing activities[11]

53,725

107,166

14,682

   Capital expenditures

(1,398,506)

(588,841)

(80,671)

Free cash inflow

7,351,597

8,412,051

1,152,446

Full Year 2024 Financial Results

Total net revenues for the full year of 2024 were RMB108.4 billion (US$14.9 billion), compared with RMB112.9 billion in the prior year.

Gross profit for the full year of 2024 was RMB25.5 billion (US$3.5 billion), compared with RMB25.7 billion in the prior year. Gross margin for the full year of 2024 increased to 23.5% from 22.8% in the prior year.

Income from operations for the full year of 2024 increased by 0.8% year over year to RMB9.2 billion (US$1.3 billion) from RMB9.1 billion in the prior year. Operating margin for the full year increased to 8.5% from 8.1% in the prior year.

Non-GAAP income from operations for the full year of 2024, which excluded share-based compensation expenses, increased by 0.9% year over year to RMB10.7 billion (US$1.5 billion) from RMB10.6 billion in the prior year. Non-GAAP operating margin for the full year of 2024 increased to 9.9% from 9.4% in the prior year.

Net income attributable to Vipshop’s shareholders for the full year of 2024 was RMB7.7 billion (US$1.1 billion), compared with RMB8.1 billion in the prior year. Net margin attributable to Vipshop’s shareholders for the full year of 2024 was 7.1%, compared with 7.2% in the prior year. Net income attributable to Vipshop’s shareholders per diluted ADS for the full year of 2024 was RMB14.35 (US$1.97), compared with RMB14.42 in the prior year.

Non-GAAP net income attributable to Vipshop’s shareholders for the full year of 2024, which excluded (i) share-based compensation expenses, (ii) impairment loss of investments, (iii) investment (gain) loss and revaluation of investments excluding dividends, (iv) reconciling items on the share of equity method investments, and (v) tax effects on non-GAAP adjustments, was RMB9.0 billion (US$1.2 billion), compared with RMB9.5 billion in the prior year. Non-GAAP net margin attributable to Vipshop’s shareholders for the full year of 2024 was 8.3%, compared with 8.4% in the prior year. Non-GAAP net income attributable to Vipshop’s shareholders per diluted ADS for the full year of 2024 was RMB16.75 (US$2.29), compared with RMB16.90 in the prior year.

For the full year of 2024, the Company’s weighted average number of ADSs used in computing diluted earnings per ADS was 539,279,030.

For the full year of 2024, net cash generated from operating activities was RMB9.1 billion (US$1.3 billion), and free cash flow, a non-GAAP measurement of liquidity, was as follows:

For the trailing twelve months ended

Dec 31, 2023

RMB’000

Dec 31, 2024

RMB’000

Dec 31, 2024

US$’000

Net cash generated from operating activities

14,414,513

9,128,983

1,250,666

Reconciling items:

   Net impact from internet financing activities

104,964

55,593

7,616

   Capital expenditures

(5,230,737)

(3,562,586)

(488,072)

Free cash inflow

9,288,740

5,621,990

770,210

Share Repurchase Program

During the quarter ended December 31, 2024, the Company repurchased US$43.3 million of its ADSs under its US$1.0 billion share repurchase program adopted in March 2023. As of the date of this earnings release, the Company has fully utilized the remaining authorized amount of this program. The Company plans to continue share repurchases under its US$1.0 billion share repurchase program announced in August 2024, which will be effective until February 2027.

Declaration of 2024 Dividend

The Company’s board of directors has approved and declared an annual cash dividend for fiscal year 2024 in the amount of US$2.40 per ordinary share, or US$0.48 per ADS, to holders of ordinary shares and holders of ADSs of record as of the close of business on April 11, 2025. The payment date is expected to be on April 25, 2025. Holders of the Company’s ADSs will receive the cash dividends through the depositary, Deutsche Bank Trust Company Americas, subject to the terms of the deposit agreement.

Business Outlook

For the first quarter of 2025, the Company expects its total net revenues to be between RMB26.3 billion and RMB27.6 billion, representing a year-over-year decrease of approximately 5% to 0%. These forecasts reflect the Company’s current and preliminary view on the market and operational conditions, which is subject to change.

Exchange Rate

The Company’s business is primarily conducted in China and the significant majority of revenues generated are denominated in Renminbi. This announcement contains currency translations of Renminbi amounts into U.S. dollars solely for the convenience of the reader. Unless otherwise noted, all translations from Renminbi to U.S. dollars are made at a rate of RMB7.2993 to US$1.00, the effective noon buying rate on December 31, 2024 as set forth in the H.10 statistical release of the Federal Reserve Board. No representation is made that the Renminbi amounts could have been, or could be, converted, realized or settled into U.S. dollars at that rate on December 31, or at any other rate.

Conference Call Information

The Company will hold a conference call on Friday, February 21, 2025 at 7:00 am U.S. Eastern Time, 8:00 pm Beijing Time to discuss the financial results.

All participants wishing to join the conference call must pre-register online using the link provided below.

Registration Link: https://register.vevent.com/register/BI94d605c9b9f44cd984fd6a1dd0f5a6b3 

Once pre-registration has been completed, each participant will receive dial-in numbers and a unique access PIN via email. To join the conference, participants should use the dial-in details followed by the PIN code.

A live webcast of the earnings conference call can be accessed at https://edge.media-server.com/mmc/p/4brks6io. An archived webcast will be available at the Company’s investor relations website at http://ir.vip.com.

About Vipshop Holdings Limited

Vipshop Holdings Limited is a leading online discount retailer for brands in China. Vipshop offers high quality and popular branded products to consumers throughout China at a significant discount to retail prices. Since it was founded in August 2008, the Company has rapidly built a sizeable and growing base of customers and brand partners. For more information, please visit https://ir.vip.com/

Safe Harbor Statement

This announcement contains forward-looking statements. These statements are made under the “safe harbor” provisions of the U.S. Private Securities Litigation Reform Act of 1995. These forward-looking statements can be identified by terminology such as “will,” “expects,” “anticipates,” “future,” “intends,” “plans,” “believes,” “estimates,” and similar statements. Among other things, the business outlook and quotations from management in this announcement, as well as Vipshop’s strategic and operational plans, contain forward-looking statements. Vipshop may also make written or oral forward-looking statements in its periodic reports to the U.S. Securities and Exchange Commission (the “SEC”), in its annual report to shareholders, in press releases and other written materials, and in oral statements made by its officers, directors, or employees to third parties. Statements that are not historical facts, including statements about Vipshop’s beliefs and expectations, are forward-looking statements. Forward-looking statements involve inherent risks and uncertainties. A number of factors could cause actual results to differ materially from those contained in any forward-looking statement, including but not limited to the following: Vipshop’s goals and strategies; Vipshop’s future business development, results of operations and financial condition; the expected growth of the online discount retail market in China; Vipshop’s ability to attract customers and brand partners and further enhance its brand recognition; Vipshop’s expectations regarding needs for and market acceptance of flash sales products and services; competition in the discount retail industry; fluctuations in general economic and business conditions in China and assumptions underlying or related to any of the foregoing. Further information regarding these and other risks is included in Vipshop’s filings with the SEC. All information provided in this press release is as of the date of this press release, and Vipshop does not undertake any obligation to update any forward-looking statement, except as required under applicable law.

Use of Non-GAAP Financial Measures

The condensed consolidated financial information is derived from the Company’s unaudited interim condensed consolidated financial statements prepared in conformity with accounting principles generally accepted in the United States of America (“U.S. GAAP”), except that comparative consolidated statements of income and cash flows for the period presented and the detailed footnote disclosures required by Accounting Standards Codification 270, Interim Reporting (“ASC270”) have been omitted. Vipshop uses non-GAAP net income attributable to Vipshop’s shareholders, non-GAAP net income attributable to Vipshop’s shareholders per diluted ADS, non-GAAP income from operations, non-GAAP operating margin, non-GAAP net margin attributable to Vipshop’s shareholders, and free cash flow, each of which is a non-GAAP financial measure. For the periods presented in this press release, non-GAAP net income attributable to Vipshop’s shareholders is net income attributable to Vipshop’s shareholders excluding (i) share-based compensation expenses, (ii) impairment loss of investments, (iii) investment loss (gain) and revaluation of investments excluding dividends, (iv) reconciling items on the share of equity method investments, and (v) tax effects on non-GAAP adjustments. Non-GAAP net income attributable to Vipshop’s shareholders per diluted ADS is computed using non-GAAP net income attributable to Vipshop’s shareholders divided by weighted average number of diluted ADS outstanding for computing diluted earnings per ADS. Non-GAAP income from operations is income from operations excluding share-based compensation expenses. Non-GAAP operating margin is non-GAAP income from operations as a percentage of total net revenues. Non-GAAP net margin attributable to Vipshop’s shareholders is non-GAAP net income attributable to Vipshop’s shareholders as a percentage of total net revenues. Free cash flow is net cash from operating activities adding back the impact from internet financing activities and less capital expenditures, which include purchase and deposits of property and equipment and land use rights. Impact from internet financing activities added back or deducted from free cash flow contains changes in the balances of financial products, which are primarily consumer financing and supplier financing that the Company provides to customers and suppliers. The Company believes that separate analysis and exclusion of the non-cash impact of (i) share-based compensation expenses, (ii) impairment loss of investments, (iii) investment loss (gain) and revaluation of investments excluding dividends, (iv) reconciling items on the share of equity method investments, and (v) tax effects on non-GAAP adjustments add clarity to the constituent parts of its performance. The Company reviews these non-GAAP financial measures together with GAAP financial measures to obtain a better understanding of its operating performance. It uses these non-GAAP financial measures for planning, forecasting, and measuring results against the forecast. The Company believes that non-GAAP financial measures are useful supplemental information for investors and analysts to assess its operating performance without the effect of (i) share-based compensation expenses, (ii) impairment loss of investments, (iii) investment loss (gain) and revaluation of investments excluding dividends, (iv) reconciling items on the share of equity method investments, and (v) tax effects on non-GAAP adjustments. Free cash flow enables the Company to assess liquidity and cash flow, taking into account the impact from internet financing activities and the financial resources needed for the expansion of fulfillment infrastructure, technology platform, and Shan Shan Outlets. Share-based compensation expenses have been and will continue to be significant recurring expenses in its business. However, the use of non-GAAP financial measures has material limitations as an analytical tool. One of the limitations of using non-GAAP financial measures is that they do not include all items that impact the Company’s net income for the period. In addition, because non-GAAP financial measures are not measured in the same manner by all companies, they may not be comparable to other similar titled measures used by other companies. One of the key limitations of free cash flow is that it does not represent the residual cash flow available for discretionary expenditures.

The presentation of these non-GAAP financial measures is not intended to be considered in isolation from, or as a substitute for, the financial information prepared and presented in accordance with U.S. GAAP. For more information on these non-GAAP financial measures, please see the table captioned “Vipshop Holdings Limited Reconciliations of GAAP and Non-GAAP Results” at the end of this release.

Investor Relations Contact

Tel: +86 (20) 2233-0732
Email: IR@vipshop.com 


[1] “Gross merchandise value (GMV)” is defined as the total Renminbi value of all products and services sold through the Company’s online sales business, online marketplace platform, Shan Shan Outlets, and other offline stores during the given period, including the Company’s websites and mobile apps, third-party websites and mobile apps, Shan Shan Outlets, and other offline stores, which were fulfilled by either the Company or its third-party merchants, regardless of whether or not the goods were delivered or returned. GMV includes shipping charges paid by buyers to sellers. For prudent considerations, the Company does not consider products or services to be sold if the orders were placed and canceled pre-shipment and only included orders that left the Company’s or other third-party vendors’ warehouses.

[2] Non-GAAP net income attributable to Vipshop’s shareholders is a non-GAAP financial measure, which, for the periods presented in this press release, is defined as net income attributable to Vipshop’s shareholders excluding (i) share-based compensation expenses, (ii) impairment loss of investments, (iii) investment loss (gain) and revaluation of investments excluding dividends, (iv) reconciling items on the share of equity method investments, and (v) tax effects on non-GAAP adjustments.

[3] “Active customers” is defined as registered members who have purchased from the Company’s self-operated online sales business or the Company’s online marketplace platforms, excluding those who made their purchases from the Company’s online stores operated at third-party platforms, at least once during the relevant period. Beginning in the fourth quarter of 2023, the Company updated its definition of “active customers” to exclude registered members who make their purchases from the Company’s online stores operated at third-party platforms.

[4] “Total orders” is defined as the total number of orders placed during the given period, including the orders for products and services sold through the Company’s online sales business and on the Company’s online marketplace platforms (excluding, for the avoidance of doubt, orders from the Company’s offline stores and outlets), net of orders returned.

[5] Non-GAAP income from operations is a non-GAAP financial measure, which is defined as income from operations excluding share-based compensation expenses.

[6] Non-GAAP operating margin is a non-GAAP financial measure, which is defined as non-GAAP income from operations as a percentage of total net revenues.

[7] “ADS” means American depositary share, each of which represents 0.2 Class A ordinary share.

[8] Non-GAAP net margin attributable to Vipshop’s shareholders is a non-GAAP financial measure, which is defined as non-GAAP net income attributable to Vipshop’s shareholders, as a percentage of total net revenues.

[9] Non-GAAP net income attributable to Vipshop’s shareholders per diluted ADS is a non-GAAP financial measure, which is defined as non-GAAP net income attributable to Vipshop’s shareholders, divided by the weighted average number of diluted ADSs outstanding for computing diluted earnings per ADS.

[10] Free cash flow is a non-GAAP financial measure, which is defined as net cash from operating activities adding back the impact from internet financing activities and less capital expenditures, which include purchase and deposits of property and equipment and land use rights.

[11] Net impact from internet financing activities represents net cash flow relating to the Company’s financial products, which are primarily consumer financing and supplier financing that the Company provides to its customers and suppliers.


 Vipshop Holdings Limited 

 Unaudited Condensed Consolidated Statements of Income and Comprehensive Income  

 (In thousands, except for share and per share data) 

Three Months Ended

Twelve Months Ended

December 31,2023

December 31,2024

December 31,2024

December 31,2023

December 31,2024

December 31,2024

RMB’000

RMB’000

USD’000

RMB’000

RMB’000

USD’000

Product revenues 

32,435,188

30,889,540

4,231,850

105,613,485

100,734,550

13,800,577

Other revenues (1)

2,239,288

2,334,302

319,798

7,242,535

7,686,282

1,053,016

 Total net revenues 

34,674,476

33,223,842

4,551,648

112,856,020

108,420,832

14,853,593

 Cost of revenues 

(26,441,622)

(25,596,304)

(3,506,679)

(87,135,128)

(82,951,178)

(11,364,265)

 Gross profit 

8,232,854

7,627,538

1,044,969

25,720,892

25,469,654

3,489,328

 Operating expenses: 

 Fulfillment expenses (2) 

(2,525,204)

(2,460,984)

(337,153)

(8,262,004)

(8,346,864)

(1,143,516)

 Marketing expenses 

(843,208)

(930,293)

(127,450)

(3,242,215)

(2,979,654)

(408,211)

 Technology and content expenses 

(496,442)

(469,223)

(64,283)

(1,767,530)

(1,892,434)

(259,262)

 General and administrative expenses 

(1,004,539)

(1,205,101)

(165,098)

(4,146,568)

(3,992,657)

(546,992)

 Total operating expenses 

(4,869,393)

(5,065,601)

(693,984)

(17,418,317)

(17,211,609)

(2,357,981)

 Other operating income 

304,818

289,291

39,633

801,560

915,208

125,383

 Income from operations 

3,668,279

2,851,228

390,618

9,104,135

9,173,253

1,256,730

 Investment (loss) gain and revaluation of investments 

(4,449)

72,649

9,953

(18,054)

148,170

20,299

 Impairment loss of investments 

0

(3,000)

(411)

(19,105)

(61,246)

(8,391)

 Interest expense 

(14,770)

(17,560)

(2,406)

(22,932)

(57,676)

(7,902)

 Interest income 

208,913

227,427

31,157

780,292

809,792

110,941

Exchange gain (loss)

(78,151)

138,633

18,993

162,666

(24,813)

(3,399)

 Income before income tax expense and share of income (loss) of equity method investees 

3,779,822

3,269,377

447,904

9,987,002

9,987,480

1,368,278

 Income tax expenses  

(771,969)

(816,363)

(111,841)

(1,866,004)

(2,315,515)

(317,224)

 Share of income (loss) of equity method investees 

(25,236)

32,799

4,493

80,301

166,980

22,876

 Net income 

2,982,617

2,485,813

340,556

8,201,299

7,838,945

1,073,930

Net income attributable to non-controlling interests

(30,470)

(39,134)

(5,361)

(84,675)

(99,010)

(13,564)

 Net income attributable to Vipshop’s shareholders 

2,952,147

2,446,679

335,195

8,116,624

7,739,935

1,060,366

 Shares used in calculating earnings per share (3): 

 Weighted average number of Class A and Class B ordinary shares: 

 —Basic 

108,441,659

102,688,899

102,688,899

110,695,778

106,074,914

106,074,914

 —Diluted 

110,380,505

104,300,280

104,300,280

112,552,398

107,855,806

107,855,806

 Net earnings per Class A and Class B ordinary share 

 Net income attributable to Vipshop’s shareholders——Basic 

27.22

23.83

3.26

73.32

72.97

10.00

 Net income attributable to Vipshop’s shareholders——Diluted 

26.75

23.46

3.21

72.11

71.76

9.83

 Net earnings per ADS (1 ordinary share equals to 5 ADSs) 

 Net income attributable to Vipshop’s shareholders——Basic 

5.44

4.77

0.65

14.66

14.59

2.00

 Net income attributable to Vipshop’s shareholders——Diluted 

5.35

4.69

0.64

14.42

14.35

1.97

(1) Other revenues primarily consist of product promotion and online advertising revenues, lease income mainly earned from the
Shan Shan Outlets ,fees charged to third-party merchants which the Company provides platform access for sales of their products,
revenue from third-party logistics services, loan facilitation service income and membership fee income.

(1) Other revenues primarily consist of product promotion and online
advertising revenues, lease income mainly earned from the Shan
Shan Outlets ,fees charged to third-party merchants which the
Company provides platform access for sales of their products,
revenue from third-party logistics services, loan facilitation service
income and membership fee income.

(2) Fulfillment expenses include shipping and handling expenses, which amounted RMB 1.8 billion and RMB 1.8 billionin the three
month periods ended December 31,2023 and December 31,2024, respectively.

(2) Fulfillment expenses include shipping and handling expenses,
which amounted RMB 5.8 billion and RMB 5.9 billion  in the twelve month
periods ended December 31,2023 and December 31,2024, respectively.

(3) Authorized share capital is re-classified and re-designated into Class A ordinary shares and Class B ordinary shares, with each
Class A ordinary share being entitled to one vote and each Class B ordinary share being entitled to ten votes on all matters that are
subject to shareholder vote.

(3) Authorized share capital is re-classified and re-designated into
Class A ordinary shares and Class B ordinary shares, with each
Class A ordinary share being entitled to one vote and each Class B
ordinary share being entitled to ten votes on all matters that are
subject to shareholder vote.

Three Months Ended

Twelve Months Ended

December 31,2023

December 31,2024

December 31,2024

December 31,2023

December 31,2024

December 31,2024

RMB’000

RMB’000

USD’000

RMB’000

RMB’000

USD’000

Share-based compensation expenses are included in the 
operating expenses as follows: 

 Fulfillment expenses 

18,586

22,747

3,116

77,926

84,079

11,519

 Marketing expenses 

7,683

8,295

1,136

33,379

31,215

4,276

 Technology and content expenses 

86,591

97,919

13,415

330,197

382,308

52,376

 General and administrative expenses 

171,805

410,126

56,187

1,068,304

1,040,138

142,498

 Total 

284,665

539,087

73,855

1,509,806

1,537,740

210,669


 Vipshop Holdings Limited
 

 Unaudited Condensed Consolidated Balance Sheets
 

 (In thousands, except for share and per share data) 

December 31,2023

December 31,2024

December 31,2024

RMB’000

RMB’000

USD’000

ASSETS

CURRENT ASSETS

Cash and cash equivalents

25,414,729

26,352,161

3,610,231

Restricted cash 

882,637

602,342

82,521

Short term investments

1,983,201

1,872,756

256,567

Accounts receivable, net

778,767

915,158

125,376

Amounts due from related parties,net

553,502

548,145

75,096

Other receivables and prepayments,net

2,298,612

2,473,050

338,806

Loan receivables,net

4,437

6,878

942

Inventories

5,644,713

5,032,069

689,391

Total current assets

37,560,598

37,802,559

5,178,930

NON-CURRENT ASSETS

Property and equipment, net

16,882,100

18,292,771

2,506,099

Deposits for property and equipment

200,739

164,955

22,599

Land use rights, net

10,132,626

10,686,400

1,464,031

Intangible assets, net

332,821

327,844

44,914

Investment in equity method investees

2,155,561

2,002,043

274,279

Other investments

2,916,189

3,355,489

459,700

Other long-term assets

147,669

434,206

59,486

Goodwill

755,213

755,213

103,464

Deferred tax assets, net

685,017

681,029

93,301

Operating lease right-of-use assets

554,061

433,617

59,405

Total non-current assets

34,761,996

37,133,567

5,087,278

TOTAL ASSETS

72,322,594

74,936,126

10,266,208

 LIABILITIES AND  EQUITY  

 CURRENT LIABILITIES 

 Short term loans 

1,425,576

2,399,629

328,748

 Accounts payable 

17,259,395

15,190,560

2,081,098

 Advance from customers  

1,689,881

2,035,184

278,819

 Accrued expenses and other current liabilities  

9,560,449

9,663,421

1,323,882

 Amounts due to related parties  

150,373

104,187

14,274

 Deferred income  

457,594

476,796

65,321

 Operating lease liabilities 

80,868

57,224

7,840

Total current liabilities

30,624,136

29,927,001

4,099,982

 NON-CURRENT LIABILITIES 

Deferred tax liability 

692,492

783,863

107,389

Deferred income-non current 

1,756,949

2,084,038

285,512

 Operating lease liabilities 

689,259

591,995

81,103

Total non-current liabilities

3,138,700

3,459,896

474,004

TOTAL LIABILITIES

33,762,836

33,386,897

4,573,986

EQUITY:

Class A ordinary shares (US$0.0001 par value, 483,489,642
shares authorized,98,877,929 and 100,640,510 shares issued,of
which 92,900,247 and 86,982,144 shares were outstanding as of
December 31,2023 and December 31,2024, respectively) 

62

64

9

Class B ordinary shares (US$0.0001 par value, 16,510,358 shares
authorized, and 15,560,358 and 15,560,358 shares issued and
outstanding as of December 31, 2023 and December 31,2024,
respectively) 

11

11

2

Treasury shares,at cost(5,977,682 and 13,028,013 Class A shares
as of December 31,2023 and December 31,2024, respectively )

(3,624,763)

(7,042,759)

(964,854)

Additional paid-in capital

4,444,755

4,912,703

673,038

Retained earnings

36,836,928

42,906,188

5,878,124

Accumulated other comprehensive loss

(695,589)

(807,394)

(110,613)

Non-controlling interests

1,598,354

1,580,416

216,516

Total shareholders’ equity

38,559,758

41,549,229

5,692,222

TOTAL LIABILITIES AND SHAREHOLDERS’ EQUITY 

72,322,594

74,936,126

10,266,208


 Vipshop Holdings Limited
 

 Reconciliations of GAAP and Non-GAAP Results
 

Three Months Ended

Twelve Months Ended

December 31,2023

December 31,2024

December 31,2024

December 31,2023

December 31,2024

December 31,2024

RMB’000

RMB’000

USD’000

RMB’000

RMB’000

USD’000

 Income from operations 

3,668,279

2,851,228

390,618

9,104,135

9,173,253

1,256,730

 Share-based compensation expenses 

284,665

539,087

73,855

1,509,806

1,537,740

210,669

 Non-GAAP income from operations 

3,952,944

3,390,315

464,473

10,613,941

10,710,993

1,467,399

 Net income attributable to Vipshop’s shareholders 

2,952,147

2,446,679

335,195

8,116,624

7,739,935

1,060,366

 Share-based compensation expenses 

284,665

539,087

73,855

1,509,806

1,537,740

210,669

 Impairment loss of investments 

0

3,000

411

19,105

61,246

8,391

 Investment loss (gain) and revaluation of investments excluding
dividends 

4,449

(72,130)

(9,882)

18,309

(147,651)

(20,228)

 Reconciling items on the share of equity method investments(4) 

27,502

101,478

13,902

7,606

31,753

4,350

 Tax effects on non-GAAP adjustments 

(70,495)

(44,446)

(6,089)

(161,580)

(190,476)

(26,095)

 Non-GAAP net income attributable to Vipshop’s shareholders 

3,198,268

2,973,668

407,392

9,509,870

9,032,547

1,237,453

(4) To exclude the GAAP to non-GAAP reconciling items relating to investment (gain) loss and revaluation of investments on the
share of equity method investments.

 Shares used in calculating earnings per share: 

 Weighted average number of Class A and Class B ordinary shares: 

 —Basic 

108,441,659

102,688,899

102,688,899

110,695,778

106,074,914

106,074,914

 —Diluted 

110,380,505

104,300,280

104,300,280

112,552,398

107,855,806

107,855,806

 Non-GAAP net income per Class A and Class B ordinary share 

 Non-GAAP net income attributable to Vipshop’s shareholders——
Basic 

29.49

28.96

3.97

85.91

85.15

11.67

 Non-GAAP net income attributable to Vipshop’s shareholders——
Diluted 

28.97

28.51

3.91

84.49

83.75

11.47

 Non-GAAP net income per ADS (1 ordinary share equal to 5 ADSs) 

 Non-GAAP net income attributable to Vipshop’s shareholders——
Basic 

5.90

5.79

0.79

17.18

17.03

2.33

 Non-GAAP net income attributable to Vipshop’s shareholders——
Diluted 

5.79

5.70

0.78

16.90

16.75

2.29


Spackman Entertainment Group’s Korean Remake of The Taiwanese Hit YOU ARE THE APPLE OF MY EYE, Produced by Studio Take, Premieres Today in Korea, Ranking #1 In Advance Ticket Reservation Sales for Korean Films

  • Produced by the Group’s wholly-owned indirect subsidiary, Studio Take, the Korean adaptation of the Taiwanese hit YOU ARE THE APPLE OF MY EYE, premieres today, topping advance ticket reservation sales for Korean films
  • Following Studio Take’s A MAN OF REASON (2023), which premiered globally at the 47th Toronto International Film Festival, the addition of YOU ARE THE APPLE OF MY EYE to its portfolio underscores Studio Take’s capability in delivering top quality content

SINGAPORE – Media OutReach Newswire – 21 February 2025 – Spackman Entertainment Group Limited (the “Group“), one of Korea’s leading entertainment production groups founded in 2011 by global media & technology investor Charles Spackman, wishes to announce that the Group’s Korean film adaptation of the Taiwanese hit YOU ARE THE APPLE OF MY EYE, produced by the Group’s wholly‐owned indirect subsidiary, Studio Take Co., Ltd. (“Studio Take“), premieres today at the Korean theatres, ranking #1 in advance ticket reservation sales for Korean films.

According to the Korean Film Council, Studio Take’s film remake of YOU ARE THE APPLE OF MY EYE recorded 8.8% of the advance ticket reservation market with an estimated total of KRW 250 million (USD 174,260[1]) in advance sales.[2]

The coming of age romance film relates the story of a group of friends who attend the same high school, having a crush on the same girl.

Spackman Equities Group Inc. (TSXV: SQG), which is listed on the TSX Venture Exchange in Canada, is one of the major investors of the film.

The 2011 original work of YOU ARE THE APPLE OF MY EYE became a breakout hit in Taiwan, Hong Kong and Singapore for Taiwanese novelist and filmmaker, Giddens Ko, and Taiwanese actor, Kai Ko. The Taiwanese film enjoyed huge box office success even in Korea with an average review score of 9.14 on Naver Movie. Subsequently, a Japanese film remake of the same name directed by Yasuo Hasegawa, was released in 2018.

The Korean remake of YOU ARE THE APPLE OF MY EYE is produced by Studio Take’s Song Dae-chan, whose track record comprises A MAN OF REASON (2023), which premiered globally at the 47th Toronto International Film Festival, BROKER (2022), which was selected to compete for the Palme d’Or at the 2022 Cannes Film Festival, musical film THE BOX, which opened #1 at the Korean box office on the first day of its wide release, and art film STONE SKIPPING (2020), which was screened at the 23rd Busan International Film Festival. The Korean romantic film marks the directorial debut of Cho Young-myoung and stars Jung Jin-young, who is a former leader of boy group B1A4 and known for his acting in K-dramas POLICE UNIVERSITY (2021) and LOVE IN THE MOONLIGHT (2016), and Dahyun, who is a member of girl group TWICE, one of the most successful K-pop groups of all time, and a global ambassador for the brand Michael Kors.

Son Jeong-Hyuk of MSteam Entertainment Co., Ltd., a wholly-owned subsidiary of the Group’s associated company, Spackman Media Group Limited, also stars in the film. Previously, he also starred in the Disney+ music K-drama, SOUNDTRACK #2 (2023).

The Group believes that Studio Take’s steady flow of film projects, which has been consistently invited to various top local and international film festivals, underscores Studio Take’s capability in delivering top quality content to contribute positively to the Group’s film production performance.


[1] 1KRW: 0.0007USD

Hashtag: #SpackmanEntertainmentGroup

The issuer is solely responsible for the content of this announcement.

About Spackman Entertainment Group Limited

Spackman Entertainment Group Limited (“SEGL” or the “Company“), and together with its subsidiaries, (the “Group“), is one of Korea’s leading entertainment production groups. SEGL is primarily engaged in the independent development, production, presentation, and financing of theatrical motion pictures in Korea.

The Company was founded in 2011 by renowned media and technology investor Charles Spackman who served as the Company’s Executive Chairman until 2017. For the past two decades, Mr. Charles Spackman has been a powerhouse in the Korean entertainment industry starting in the early 2000’s with the pioneering success of Sidus Pictures, the largest movie production company at the time and the first to be listed in Korea. Mr. Spackman is also the Founder, Chairman and Chief Executive Officer of the global investment firm, Spackman Group. For more information, please visit charlesspackman.com and spackman-group.com/charles-spackman.

Since its founding, SEGL had produced more than 30 major motion pictures including a number of the highest grossing and award-winning films in Korea, namely #ALIVE (2020), CRAZY ROMANCE (2019), DEFAULT (2018), MASTER (2016), THE PRIESTS (2015), SNOWPIERCER (2013), COLD EYES (2013) and ALL ABOUT MY WIFE (2012).

Our films are theatrically distributed and released in Korea and overseas markets, as well as for subsequent post-theatrical worldwide release in other forms of media, including online streaming, cable TV, broadcast TV, IPTV, video-on-demand, and home video/DVD, etc. Generally, we release our motion pictures into wide-theatrical exhibition initially in Korea, and then in overseas and ancillary markets.

The Group also invests into and produces Korean television dramas. In addition to our content business, we also own equity stakes in entertainment-related companies and film funds that can financially and strategically complement our existing core operations. SEGL is listed on the Catalist of the Singapore Exchange Securities Trading Limited under the ticker 40E.

Production Labels

SEGL owns a 100% equity interest in Studio Take Co., Ltd. (“Studio Take“) which produced STONE SKIPPING (2020) and THE BOX (2021). One of its films, A MAN OF REASON (2023), premiered in the US at the 42nd Hawaii International Film Festival. The film was also invited to the 47th Toronto International Film Festival, the largest film festival in North America, and the 55th Sitges Film Festival, one of the world’s top three genre film festivals. Produced by Studio Take, the Korean adaptation of the Taiwanese hit YOU ARE THE APPLE OF MY EYE premiered at the Korean theatres on 21 February 2025. The romance film remake originally premiered at the 29th Busan International Film Festival in October 2024. Studio Take shall also release an upcoming film, THE GUEST, which is at the post-production stage and scheduled to be released in the second half of 2025 or in 2026.

The Company owns a 20% equity interest in The Makers Studio Co. Ltd., which plans to produce and release four upcoming films, the first of which will be THE ISLAND OF THE GHOST’S WAIL, a comedy horror film.

Talent Representation

The Company holds an effective shareholding interest of 43.88% in Spackman Media Group Limited (“SMGL“). SMGL, a company incorporated in Hong Kong, together with its subsidiaries, is collectively one of the largest entertainment talent agencies in Korea in terms of the number of artists under management, including some of the top names in the Korean entertainment industry. SMGL operates its talent management business through renowned agencies such as MSteam Entertainment Co., Ltd., SBD Entertainment Inc., UAA&CO Inc. and Play Content Co., Ltd. Through these full-service talent agencies in Korea, SMGL represents and guides the professional careers of a leading roster of award-winning actors/actresses in the practice areas of motion pictures, television, commercial endorsements, and branded entertainment. SMGL leverages its unparalleled portfolio of artists as a platform to develop, produce, finance and own the highest quality of entertainment content projects, including theatrical motion pictures, variety shows and TV dramas. This platform also creates and derives opportunities for SMGL to make strategic investments in development stage businesses that can collaborate with SMGL artists. SMGL is an associated company of the Company. For more information, please visit spackmanmediagroup.com.

For more details, please visit spackmanentertainmentgroup.com.