SHANGHAI, May 15, 2026 /PRNewswire/ — JBD has announced that it has completed a major upgrade of its MicroLED microdisplay mass-production architecture, shifting from a 4-inch-based manufacturing architecture to a 12-inch reconstructed wafer platform. The milestone marks a step-change in manufacturing efficiency, cost competitiveness, and large-scale supply readiness.
In the early days of the industry, competition in MicroLED microdisplays revolved largely around performance metrics such as brightness, form factor, and power consumption. As the technology roadmap matures and demand for high-performance displays in AR/AI smart glasses continues to accelerate, manufacturing capability is emerging as the decisive variable for the industry’s next phase of development. Achieving scalable, cost-efficient production without compromising quality has become the new frontier of technological competition.
Yield and cost have long been central constraints on the broad adoption of MicroLED microdisplays. The prevailing wafer-to-wafer bonding approach offers high throughput, but it also presents a fundamental structural challenge: advanced silicon backplanes have fully transitioned to the 12-inch generation, while MicroLED epitaxial wafers, constrained by material systems and process complexity, have remained predominantly 4-inch. This wafer-size mismatch has become a key factor limiting cost efficiency and substrate utilization.
A common industry practice today is to dice 12-inch silicon backplanes to match smaller epitaxial wafers. Under this approach, however, the theoretical utilization ceiling for backplane wafers is only 77%, making it difficult to fully capture the value of advanced-node silicon backplanes. Given the substantially higher cost per unit area of silicon backplanes compared with epitaxial materials, any underutilization directly translates into higher device cost and constrains the economics of scaled production.
Many MicroLED companies have proposed using 8-inch wafer flows for mass production of MicroLED microdisplays. However, this approach presents two critical flaws. First, geometric analysis shows that 56% of the backplane area remains unutilized due to the mismatch between wafer sizes. Second, experimental data consistently reveals low wafer yields during the bonding and substrate removal stages—a persistent problem that remains unsolved to this day. Consequently, JBD has decided to forgo the 8-inch approach entirely and leap directly to 12-inch wafer flows.
Against this backdrop, JBD has integrated its “die-to-carrier-to-wafer” bonding scheme into its volume production architecture. Under this process, small-format epitaxial wafers are diced into individual dies, followed by pre-bond inspection and sorting to identify and remove defective chips at an early stage. Qualified dies are then reconstituted onto a temporary 12-inch carrier substrate with high placement accuracy and uniformity, creating a reconstructed epitaxial wafer for subsequent wafer-level bonding with a matching 12-inch silicon backplane.
This approach enables significantly more efficient utilization of silicon backplane wafers, mitigates the impact of epitaxial defects before they are carried into finished devices, reduces variability in downstream processing, and materially improves yield. More importantly, it combines the proven process maturity of small-format epitaxy with the scale advantages of advanced 12-inch backplanes. This provides a practical pathway to upgrade the manufacturing system before native 12-inch epitaxy becomes commercially viable at scale. It also establishes a more stable manufacturing foundation for high-precision hybrid bonding. As pixel pitches continue to shrink, MicroLED microdisplays will increasingly depend on advanced-node silicon backplanes.
JBD has now addressed the key technical and process bottlenecks associated with 12-inch wafer reconstitution and established a validated process architecture. End-to-end validation has been completed on its pilot line, where wafer-reconstitution yield has exceeded 98%, and the company is now accelerating the transfer of this architecture to volume production. “The 12-inch wafer reconstitution solution overcomes a key bottleneck in large-format mass production for the MicroLED microdisplay industry and achieves an optimal balance between efficiency and cost,” said Dr. Qiming Li, CEO of JBD. “Thanks to JBD’s engineers and technologists, after years of innovative study, we are now confident that 12-inch reconstitution will be the ultimate solution for MicroLED mass production. It marks the beginning of a new stage of scaled manufacturing for MicroLED microdisplays. Beyond MicroLED mass production, the new 12-inch platform will likely open many new opportunities in the computing with light. JBD believes in light.”
The transition from 4-inch to 12-inch wafers marks a critical step in the maturation of MicroLED microdisplay manufacturing toward application-ready, scaled production. With this architectural upgrade, JBD is reinforcing its large-scale supply capability while providing a more dependable manufacturing foundation for the global commercialization of AR smart devices at scale.
About the Company
Founded in 2015, the Company—known in the industry through its JBD technology brand—stands at the forefront of technological innovation in MicroLED microdisplay technology. Renowned for delivering some of the smallest, brightest, and most energy-efficient microdisplay panels, the Company is a global pioneer in advanced display solutions. The Company’s product portfolio extends well beyond AR near-eye displays, encompassing ultra-compact MicroLED displays, projection solutions, and optical modules—enabling a wide spectrum of consumer, automotive, and commercial applications. Driven by an unwavering commitment to excellence and innovation, the Company continues to expand the boundaries of application and deliver reliable, system-level solutions that help shape a brighter, more vibrant digital world.
Mission Enlighten the human perspective with MicroLED.
Vision To become a global leader of near-eye display solutions, reshaping the human-AI interaction experience and gatewaying humanity to the digital world through MicroLED.
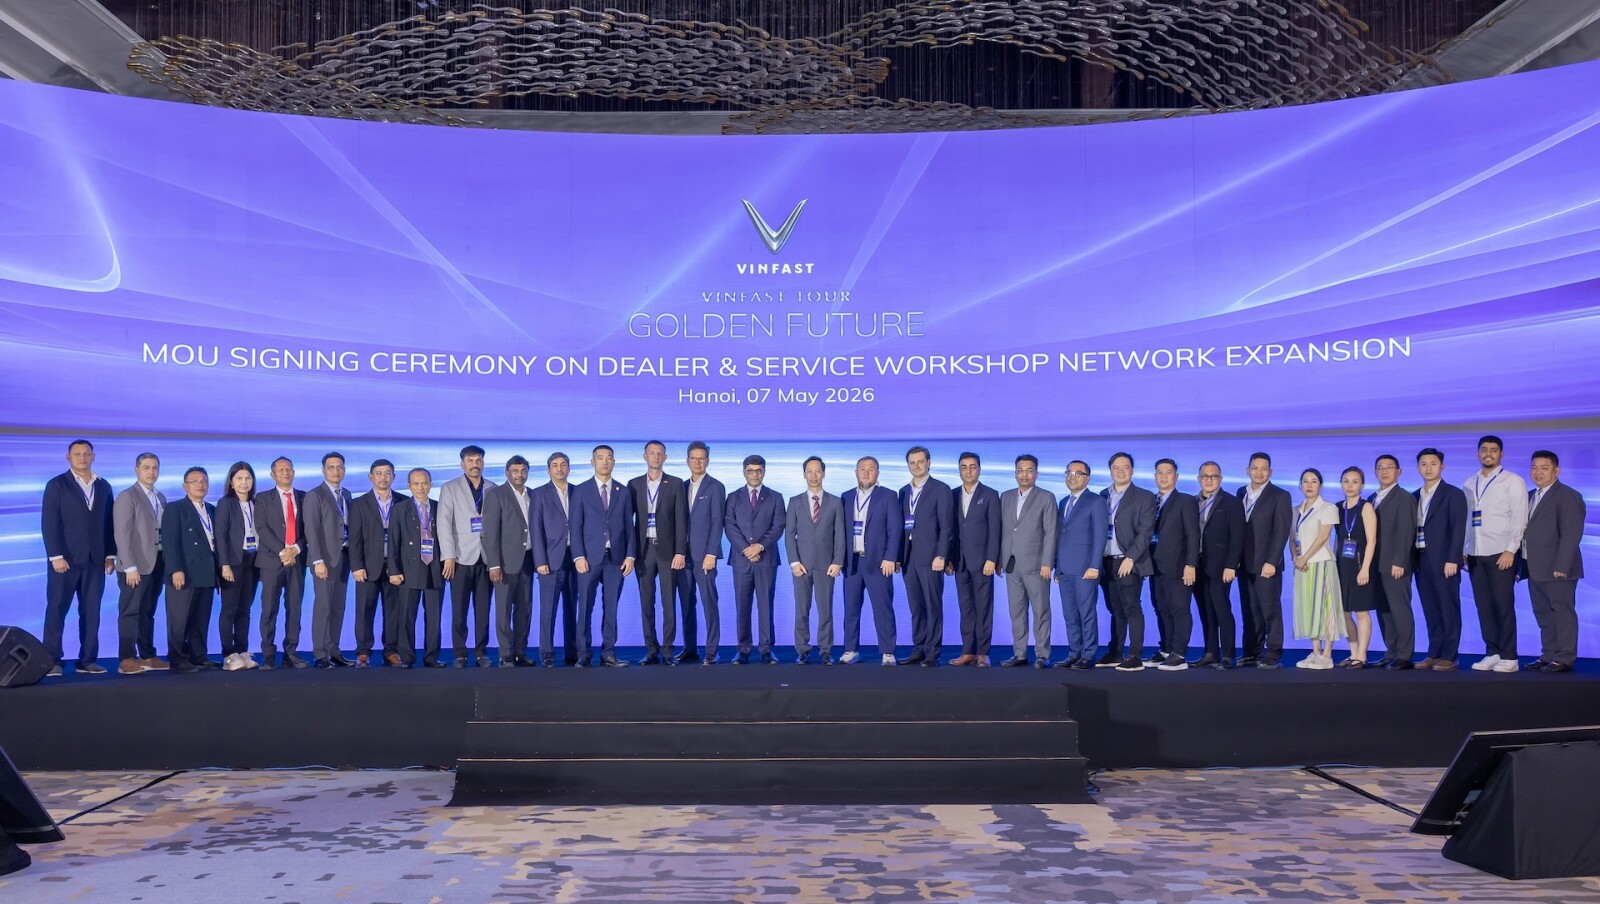
HANOI, VIETNAM – Media OutReach Newswire – 15 May 2026 – As part of the VinFast Global Business Conference held from May 4 to May 10, 2026, VinFast announced the signing of Memoranda of Understanding (MOUs) with 29 aftersales partners at the 2026 Global Business Conference. Organized by VinFast, the event marked the first time more than 200 investors and partners who have accompanied and will accompany VinFast across North America, Europe, the Middle East, India, Indonesia, the Philippines, and Kazakhstan have gathered together, representing another milestone in the company’s strategy to expand its global service network.
VinFast leaders and 29 after-sales partners at the Memorandum of Understanding signing ceremony held as part of the VinFast Global Business Conference.
Under the MOUs, international partners are expected to establish EV service workshops that meet VinFast’s global standards in their respective markets. VinFast will ensure uniform, high-quality service through globally-standardized technician training and certification programs, consistent operating procedures and quality control systems, as well as a parts supply network targeting delivery of common spare parts within 24 hours in key markets.
The new agreements are part of VinFast’s long-term strategy to develop a comprehensive EV ecosystem aligned with its international standards, covering aftersales services, charging infrastructure, and customer support. This expansion is expected to further accelerate the transition to electric mobility while ensuring VinFast customers receive support throughout the entire product lifecycle.
VinFast’s international strategy is built on the operational foundation and aftersales capabilities it has already proven in Vietnam. By the end of 2025, VinFast had developed nearly 400 service workshops nationwide, bringing its total global network to nearly 800 facilities.
Building on this foundation, VinFast aims to expand to more than 1,100 service workshops globally in 2026, spanning North America, Europe, the Middle East, and Asia. The network will be deployed through multiple models, including dealerships serving retail customers, fleet and transportation business clients, and third-party local service workshop partners.
At the same time, VinFast is implementing a range of customer support policies, including repair time commitments in Vietnam, replacement vehicle support in international markets, as well as battery inspection, software updates, and technical support throughout the ownership experience.
As part of the conference, international partners also visited VinFast’s manufacturing complex and the broader Vingroup ecosystem to gain deeper insights into VinFast’s production capabilities, operational scale, and global growth strategy.
Mr. Bui Viet Hung, Deputy CEO of Global Aftersales of VinFast, said: “Our goal is not simply to expand the network, but to build a customer-centric aftersales ecosystem that delivers an outstanding experience on a global scale. Through partnerships with experienced local operators and the application of VinFast’s global standards, we aim to provide aftersales services that are exceptional, responsive, and reliable. We also aspire to bring Vietnam’s five-star service culture and spirit of dedication to the world, creating a unique experience for international customers. That is VinFast’s long-term commitment to the transition to electric mobility.”
In addition to expanding its aftersales operations, VinFast continues to develop an integrated EV ecosystem that includes products, services, and charging infrastructure through partnerships with strategic partners such as V-Green and local charging infrastructure operators. Through this partner network, VinFast aims to develop a system of more than 1.5 million charging ports globally, helping expand access to charging infrastructure and deliver a seamless, convenient EV ownership experience for customers in international markets.
Hashtag: #VinFast
The issuer is solely responsible for the content of this announcement.
About VinFast
VinFast (NASDAQ: VFS), a subsidiary of Vingroup JSC, one of Vietnam’s largest conglomerates, is a pure-play electric vehicle manufacturer with the mission of making electric mobility more accessible to everyone. VinFast’s current product portfolio includes a wide range of electric SUVs, electric motorcycles, electric bicycles, and electric buses.
VinFast is entering its next phase of growth by rapidly expanding its global distribution and dealer network while strengthening manufacturing capabilities, with a focus on key markets in North America, Europe, the Middle East, and Asia.
The New Laos National Stadium (also known as Lao National Stadium KM16) is a multi-use stadium in Vientiane, Laos that was built in 2009. (Photo by Football Stadium Gallery)
Laos has requested Vietnam’s support in sports development and athlete training as the country prepares to host the 36th Southeast Asian (SEA) Games in 2031 as this is the country’s second time staging the regional multi-sport event after first hosting the 25th SEA Games in Vientiane in 2009.
The request came during a bilateral meeting on 13 May in Vientiane between Lao Education and Sports Minister Thongsalith Mangnomek and Vietnamese Culture, Sports and Tourism Minister Lam Thi Phuong Thanh, where both sides reviewed existing cooperation in sports and education and discussed the road ahead for the regional event.
Among the key requests, Laos asked Vietnam to help renovate the National Sports Training Center, a facility originally constructed with Vietnamese assistance in 2009 that has since fallen into disrepair, as well as support the development of a new Sports Science Center to boost athlete performance ahead of 2031.
Laos also called on Vietnam to maintain long-term sports scholarships and short- to medium-term training programs, along with equipment, coaching, and technical support for Lao athletes, coaches, and officials. Support for para-athletes competing in athletics and weightlifting was also raised.
On the practical side, the proposal envisions Vietnamese experts being deployed to conduct training in Laos, while 35 to 60 Lao athletes would attend training camps in Vietnam each year, a figure set to rise to between 70 and 100 annually in 2029–2030 as final preparations for the Games intensify.
Both sides also explored broader collaboration covering student football competitions, sports management training, and initiatives to promote public participation in physical activity and traditional sports.
Lao officials described the cooperation as a core part of the country’s wider effort to strengthen its sports sector and ensure it is ready to stage one of Southeast Asia’s most prominent sporting events.
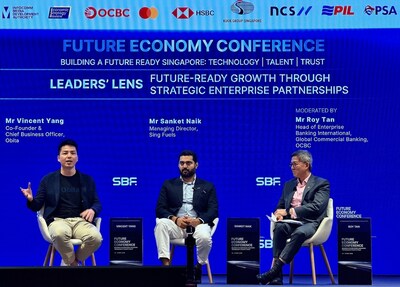
SINGAPORE, May 15, 2026 /PRNewswire/ — On May 13, 2026, Vincent YANG, Co-founder and Chief Business Officer of Obita, attended Future Economy Conference 2026, hosted by the Singapore Business Federation (SBF), and joined the Leaders’ Lens: Future-Ready Growth Through Strategic Enterprise Partnerships session. The conversation was moderated by Mr Roy Tan, Head of Enterprise Banking International, Global Commercial Banking, OCBC, with speakers exchanging views on key topics including enterprise internationalisation, the value of strategic partnerships, and cross-border business development.
Future Economy Conference is an important annual platform hosted by SBF for the business community, bringing together business executives, industry representatives, and policy stakeholders to discuss business growth, cross-border collaboration, and pathways for sustainable development. Leaders’ Lens is a high-level dialogue segment designed for business decision-makers, focusing on practical topics such as market shifts, business transformation, and internationalisation strategies, while sharing frontline business judgement and practical thinking.
During the session, Obita shared its observations on enterprise internationalisation. In Obita’s view, different markets come with different business value, operating conditions, and investment requirements. Companies need to assess the right operating depth and investment pace for each market. In the early stage, they can take a light-touch approach to test market demand quickly. As business opportunities become more concrete, they may move into a medium-depth model by working with local partners to integrate into the ecosystem, build market trust, and advance business execution. For core strategic markets, companies may enter a heavy-lift stage, with deeper localisation across compliance, operations, team structures, and long-term investment.
When expanding partner networks, companies should also place different emphasis at different stages. At the market-testing stage, they need precise market entry points and feedback. Once the business moves toward execution, local resources and implementation capabilities become more important. At the deep operating stage, companies need stable governance structures and long-term ecosystem collaboration. Well-structured strategic partnerships can help companies better manage the pace of international expansion, reduce trial-and-error costs, and strengthen the stability of cross-market operations.
When Mr Roy Tan asked about Singapore’s value as a hub, Obita noted that Singapore not only has a mature financial system and regulatory environment, but also helps internationalising companies build business credibility and connect efficiently with regional resources and global opportunities. This makes Singapore a strong base for companies building cross-market operations and a global ecosystem.
Flexibly adjusting market expansion strategies and the pace of resource investment is key to steady global growth. For Obita, participating in Future Economy Conference 2026 was an opportunity to share experience and further connect with Singapore’s business ecosystem.
About Obita
Obita is a global payment service provider for enterprises, focused on delivering controllable, trustworthy, and efficient financial solutions that help businesses manage global collections, cross-border payouts, and fund operations with greater ease.
Powered by financial technology, Obita is committed to providing enterprises with more efficient settlement experiences, more stable payment workflows, clearer fund management, and broader capabilities across global collections, payouts, and fund operations — supporting sustained business growth in an increasingly connected world.
West Vancouver, British Columbia – Newsfile Corp. – May 14, 2026 – Surge Battery Metals Inc. (TSXV: NILI) (OTCQX: NILIF) (FSE: DJ5) (the “Company” or “Surge“) is pleased to announce that Nevada North Lithium, LLC (“NNL”), the joint venture formed by Surge and Evolution Mining Limited (“Evolution”), has reported an updated Mineral Resource Estimate (“MRE”) for the Nevada North Lithium Project (“NNLP”) containing 10.5 Mt of Lithium Carbonate Equivalent (LCE) grading 3,007 ppm Li Measured and Indicated which includes 6.7Mt LCE @ 3,820 ppm Li highlighting significant scalability potential from the Preliminary Economic Assessment (PEA) mine plan that consumes only 3.6Mt @ 4016 ppm Li.
Following a targeted infill and step-out drilling campaign comprising nine drill holes, the updated MRE demonstrates an 87% conversion of the PEA mine pit into higher-confidence Measured and Indicated (M&I) resource categories. This ratio of boreholes to resource highlights the clear continuity of the deposit and firmly establishes NNLP as one of the leading lithium clay deposits in North America.
Highlights of the Updated Mineral Resource Estimate:
Initial High-Grade M&I Resource Established: The Project now hosts a Measured and Indicated Resource of 657.5 million tonnes grading 3,007 ppm Li, containing 10.5 million tonnes of Lithium Carbonate Equivalent (LCE).
High Conversion: The recent drilling successfully converted approximately 87% of the original PEA mine pit into the M&I category, securing the foundation of the deposit.
High-Grade Expansion: The drill program successfully defined significant new volumes of higher-grade M&I resource outside the boundaries of the original PEA mine pit, providing optimization and scalability opportunities for the in-process Pre-Feasibility Study (PFS) as the PEA mine plan consumes only 3.6Mt @ 4016 ppm Li.
Significant Inferred Expansion: Excluding the totals attributed to Measured and Indicated classifications, the Inferred Resource still hosts 271.3 million tonnes grading 2,160 ppm Li, containing 3.1 million tonnes of LCE, pushing the mineralized footprint well beyond the boundaries of the 2025 Preliminary Economic Assessment (PEA).
Near-Surface Mine Plan Upside: Opportunities exist to further optimize early-year mine sequencing, particularly where the high-grade upper clay horizon sits near the surface.
Specific Gravity (SG) Sampling: The SG dataset includes 512 measurements across the tuff and mineralized units. Statistical evaluation indicates that the upper clays have a median bulk density of 1.65 t/m3, while non-mineralized materials (tuffs) have a low bulk density of 1.39 t/m3. These values have been incorporated into the updated block model, and these revisions will influence future mine-planning scenarios once completed.
Mr. Greg Reimer, President, Chief Executive Officer and Director of Surge, commented, “This resource update is a watershed moment for Surge and our joint venture partners at Evolution Mining. Delivering over 10.5 million tonnes of LCE into the Measured and Indicated category at grades exceeding 3,000 ppm Li underscores the significance of the NNLP deposit. This MRE highlights the sheer scalability of the NNLP with the PEA mine plan only using 3.6Mt of the M&I resource. The primary objective of this MRE update was to de-risk the resource for the Pre-Feasibility Study, and the geological data has emphatically delivered.”
Updated Mineral Resource Estimate Statement
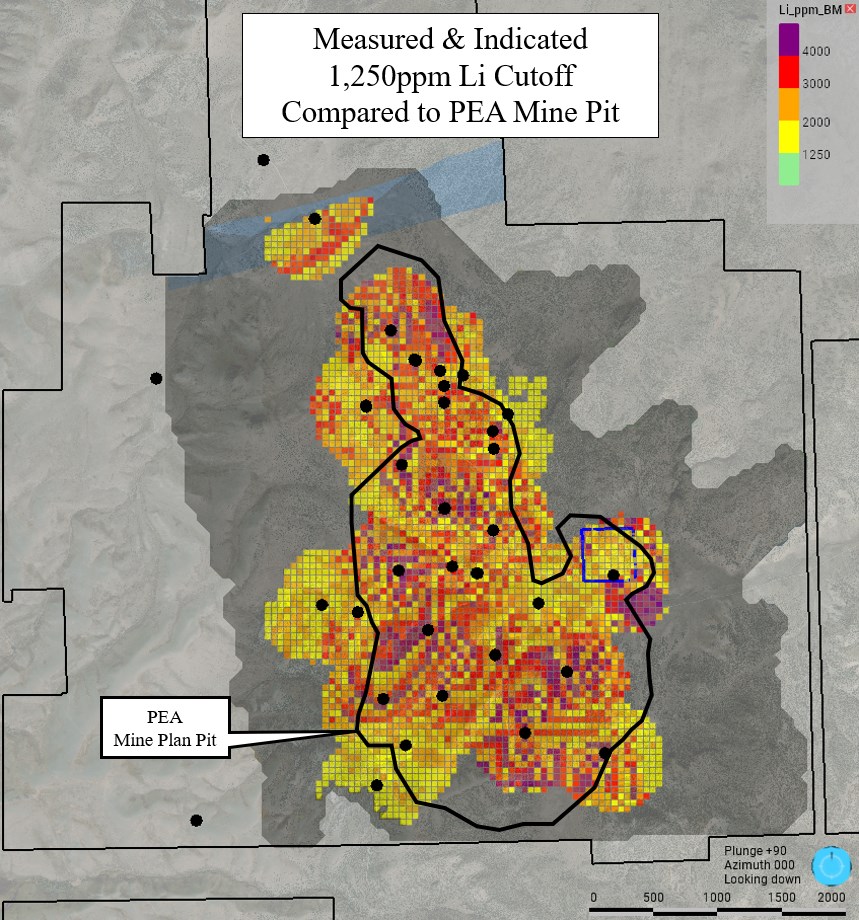
The MRE was prepared by RESPEC Company, LLC (“RESPEC”), an independent mining and engineering consulting firm, in accordance with Canadian Institute of Mining, Metallurgy and Petroleum (“CIM“) Definition Standards – For Mineral Resources and Mineral Reserves adopted by the CIM May 19, 2014, and in accordance with National Instrument 43-101 – Standards of Disclosure for Mineral Projects (“NI 43-101“). The resource is constrained within an optimized pit shell based on a $20,000/t LCE price, utilizing a cut-off grade of 1,250 ppm Li.
Table 1. 2026 NNLP Measured Resource in bold and sensitivity to different cutoff grades.
Category
Tonnes (Mt)
Grade (Li ppm)
Lithium (Mt)
LCE (Mt)
Measured
210.8
3,150
0.66
3.53
Indicated
446.7
2,940
1.31
6.98
Total M&I
657.4
3,007
1.97
10.51
Inferred
271.3
2,160
0.59
3.11
Table 2. 2026 NNLP Measured Resource in bold and sensitivity to different cutoff grades.
Cutoff (Li ppm)
Tonnes (Mt)
Grade (Li ppm)
Lithium (Mt)
LCE (Mt)
1,000
214.8
3,100
0.67
3.55
1,250
210.8
3,150
0.66
3.53
1,500
199.3
3,240
0.65
3.43
1,750
187.2
3,340
0.63
3.33
2,000
174.4
3,450
0.60
3.20
3,000
119.5
3,890
0.47
2.48
4,000
44.6
4,510
0.20
1.07
Table 3. 2026 NNLP Indicated Resource in bold and sensitivity to different cutoff grades.
Cutoff (Li ppm)
Tonnes (Mt)
Grade (Li ppm)
Lithium (Mt)
LCE (Mt)
1,000
456.9
2,890
1.32
7.03
1,250
446.7
2,940
1.31
6.98
1,500
419.1
3,030
1.27
6.77
1,750
389.6
3,140
1.22
6.51
2,000
357.5
3,250
1.16
6.19
3,000
209.3
3,780
0.79
4.21
4,000
64.0
4,390
0.28
1.50
Table 4. 2026 NNLP Inferred Resource in bold and sensitivity to different cutoff grades.
Cutoff (Li ppm)
Tonnes (Mt)
Grade (Li ppm)
Lithium (Mt)
LCE (Mt)
1,000
294.4
2,080
0.61
3.26
1,250
271.3
2,160
0.59
3.12
1,500
221.7
2,330
0.52
2.75
1,750
171.1
2,540
0.44
2.32
2,000
129.6
2,760
0.36
1.90
3,000
38.6
3,560
0.14
0.74
4,000
6.0
4,420
0.03
0.14
All Table Notes:
The effective date of the NNLP mineral resource estimate is May 1, 2026.
The mineral resource estimate was prepared by RESPEC in metric tonnes under the supervision of Mr. Jeff Bickel in accordance with CIM “Estimation of Mineral Resource and Mineral Reserves Best Practices” guidelines and reported in compliance with NI 43-101.
Resources are constrained by an optimized pit shell. Block grades were interpolated using the ID2 method in Hexagon MinePlan™ 3D software.
The NNLP mineral resource cut-off grade of 1,250 ppm Li was selected based on input provided by Surge and reviewed by the QP. Operating assumptions used to establish reasonable prospects for eventual economic extraction include a US$82.43/t operating cost, an average recovery of 84.9% Li, and a US$20,000/t LCE price. Blocks outside the optimized pit shell do not meet criteria for reasonable prospects for eventual economic extraction.
A Li to Li2CO3 factor of 5.323 was used.
Mineral resources are not mineral reserves and do not have demonstrated economic viability. An inferred mineral resource has lower confidence than a measured or indicated mineral resource and must not be converted to a mineral reserve. Additional drilling is required to improve the confidence level of inferred mineral resources.
The new drilling combines for an aggregate total of 5451.5 meters across 37 drillholes, underpinning the entire MRE. RESPEC was supplied with three-dimensional geological shapes generated by NNL which included mineralized clay lithologies hosting lithium. Mineral resources were estimated by RESPEC as follows:
Evaluated the drill data statistically within relevant clay lithologies, using them as domains;
Coded a block model with the domains using the provided geological wireframe solids;
Analyzed the mineralization geostatistically by domain to aid in the establishment of estimation and classification parameters; and
Interpolated lithium grades into a block model comprised of 50(east-west) x 50(north-south) x 5(vertical)-meter blocks using the clay lithology domains to explicitly constrain the grade estimation.
Resource Expansion Opportunities
While this MRE update successfully locked in the core of the PFS mine plan, the geological model highlights several immediate avenues for future resource expansion and grade optimization:
Tighter Drill Spacing Upside: Geostatistical modeling indicates that in areas with lower drill density, the grade estimates are conservatively constrained by larger search radiuses. We anticipate that future infill drilling in these peripheral zones will naturally pull up the average grade, mirroring the success of our recent infill campaign.
High-Grade Footprint Expansion: Future targeted drilling will aim to fill localized gaps within the deposit, specifically targeting the expansion of the >3,000ppm Li footprint to the north.
Volumetric Increases: The integration of recent, high-resolution topographic surveys has identified shallow areas of increased volumetric potential, particularly to the northeast, providing further tonnage upside beyond the current block model.
Next Steps
With the MRE complete, the block model has been formally handed over to Independent Mining Consultants (IMC) to finalize the PFS mine plan and production schedule. Engineering deliverables from Fluor, including the Heat and Material Balance (HMB) and Process Flow Diagrams (PFDs), have successfully defined a highly efficient and robust flowsheet. The Metallurgical Testing Program with Kemetco is advancing rapidly, keeping the Company on track to deliver the comprehensive Pre-Feasibility Study in Q4 2026.
Technical Report
Under NI 43-101, Section 4.2(1)(j), Surge must file a technical report regarding the updated MRE within forty-five (45) days of the date of this news release.
Qualified Person as Defined Under National Instrument 43-101
The MRE was prepared for Nevada North Lithium, LLC by independent Qualified Persons (“QPs”) as defined under NI 43-101. The independent QPs were Mr. Jeff Bickel, C.P.G., and Mr. Nathan Forsythe, C.P.G., of RESPEC in Reno, Nevada. Both QPs have reviewed and approved the technical information in this news release that is derived from the upcoming Technical Report.
Mr. Bickel and Mr. Forsythe have reviewed the sampling, assaying, and security procedures used by Surge at Nevada North, and it is their opinion that they follow industry standard procedures and are adequate for the estimation of the current MRE and for use in preparing the Technical Report.
Mr. Bickel and Mr. Forsythe completed an audit of the database and verified data underpinning the MRE. Mr. Forsythe visited the project site on November 4 and 5, 2025.
Nevada North Lithium exploration activities are supervised by Mr. Alan J. Morris, C.P.G., Geological Advisor to the Company. Mr. Morris is a qualified person as defined under NI 43-101. Mr. Morris has reviewed and approved the technical contents of this news release.
About Surge Battery Metals Inc.
Surge Battery Metals Inc., a Canadian-based mineral exploration company, is at the forefront of securing the supply of domestic lithium through its active engagement in the Nevada North Lithium Project. The project focuses on development of high-grade lithium energy metals in Nevada, USA, a crucial element for powering battery electric storage and electric vehicles. With a primary listing on the TSX Venture Exchange in Canada and a listing on the OTCQX Market in the USA, Surge Battery Metals Inc. is strategically positioned as a key player in advancing lithium exploration.
About Evolution Mining Limited
Evolution Mining is a leading, globally relevant gold miner. Evolution operates six mines, comprising five wholly-owned mines – Cowal in New South Wales, Ernest Henry and Mt Rawdon in Queensland, Mungari in Western Australia, and Red Lake in Ontario, Canada, and an 80% share in Northparkes in New South Wales.
About Nevada North Lithium, LLC
Nevada North Lithium, LLC, jointly owned by Surge Battery Metals Inc (70.54%) and Evolution Mining Limited (29.46%), owns the Nevada North Lithium Project southeast of Jackpot, Nevada about 73 km north-northeast of Wells, Elko County. The first three rounds of drilling at the project identified a strongly mineralized zone of lithium bearing clays occupying a strike length of more than 4,300 meters and a known width of greater than 1,500 meters. Highly anomalous soil values and geophysical surveys suggest there is potential for the clay horizons to be much greater in extent. As disclosed in the Company’s Preliminary Economic Assessment dated May 19, 2025 (PEA), completed jointly by M3 Engineering & Technology Corp. and Independent Mining Consultants (see the Company’s news release dated July 24, 2025 for further information regarding the PEA), the Nevada North Lithium Project reported an after-tax NPV8% US $9.17 Billion and after-tax IRR of 22.8% at $24,000/t LCE and an OPEX of US $5,243/t LCE. The Project now has a pit-constrained Measured & Indicated Resource containing an estimated 10.51 Mt of Lithium Carbonate Equivalent (LCE) grading 3007 ppm Li at a 1,250-ppm cutoff.
On behalf of the Board of Directors “Greg Reimer” Greg Reimer, Director, President & CEO
Neither the TSX Venture Exchange nor its Regulation Services Provider (as that term is defined in the policies of the TSX Venture Exchange) accepts responsibility for the adequacy or accuracy of this release.
This document may contain certain “Forward-Looking Statements” within the meaning of the United States Private Securities Litigation Reform Act of 1995 and applicable Canadian securities laws. When used in this news release, the words “anticipate”, “believe”, “estimate”, “expect”, “target”, “plan” or “planned”, “possible”, “potential”, “forecast”, “intend”, “may”, “schedule” and similar words or expressions identify forward-looking statements or information. These forward-looking statements or information may relate to future prices of commodities including lithium and nickel, the accuracy of mineral or resource exploration activity, reserves or resources, regulatory or government requirements or approvals including approvals of title and mining rights or licenses and environmental, local community or indigenous community approvals, the reliability of third party information, continued access to mineral properties or infrastructure or water, changes in laws, rules and regulations including in the United States, Nevada or California or any other jurisdiction which may impact upon the Company or its properties or the commercial exploitation of those properties, currency risks including the exchange rate of USD$ for Cdn$ or other currencies, fluctuations in the market for lithium related products, changes in exploration costs and government royalties, export policies or taxes in the United States or any other jurisdiction and other factors or information. The Company’s current plans, expectations, and intentions with respect to development of its business and of its Nevada properties may be impacted by economic uncertainties arising out of any pandemic or by the impact of current financial and other market conditions (including US government subsidies or incentives) on its ability to secure further financing or funding of its Nevada properties. Such statements represent the Company’s current views with respect to future events and are necessarily based upon several assumptions and estimates that, while considered reasonable by the Company, are inherently subject to significant business, economic, competitive, political, environmental (including endangered species, habitat preservation and water-related risks) and social risks, contingencies, and uncertainties. Many factors, both known and unknown, could cause results, performance, or achievements to be materially different from the results, performance or achievements that are or may be expressed or implied by such forward-looking statements. The Company does not intend, and does not assume any obligation, to update these forward-looking statements or information to reflect changes in assumptions or changes in circumstances or any other events affecting such statements and information other than as required by applicable laws, rules, and regulations.
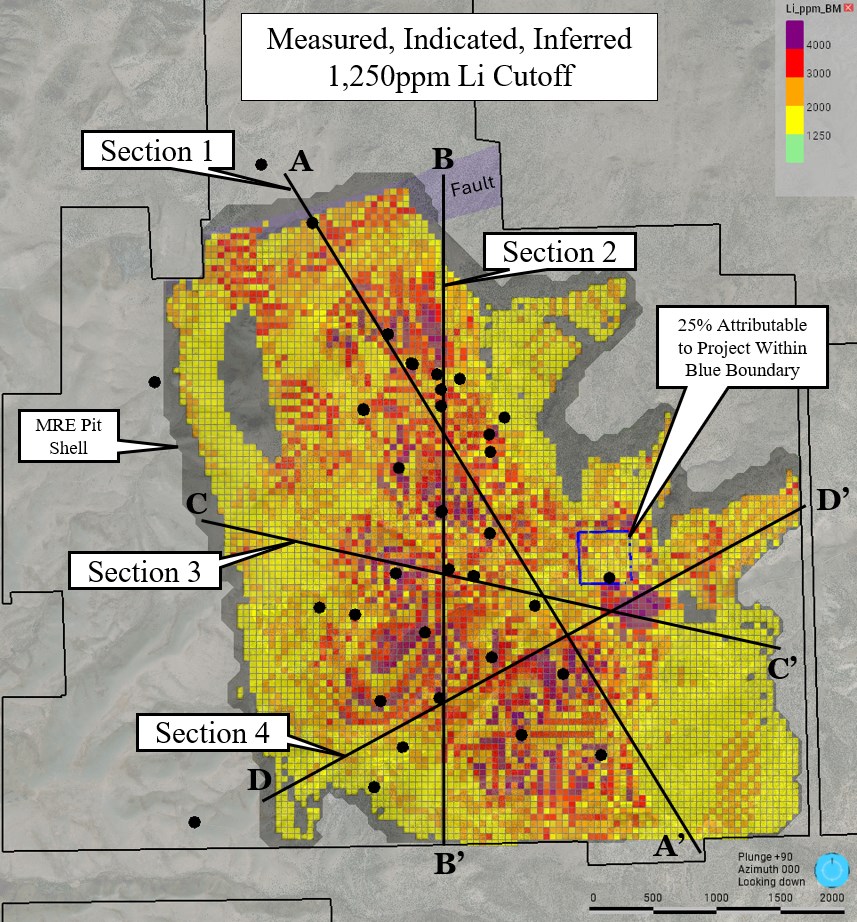
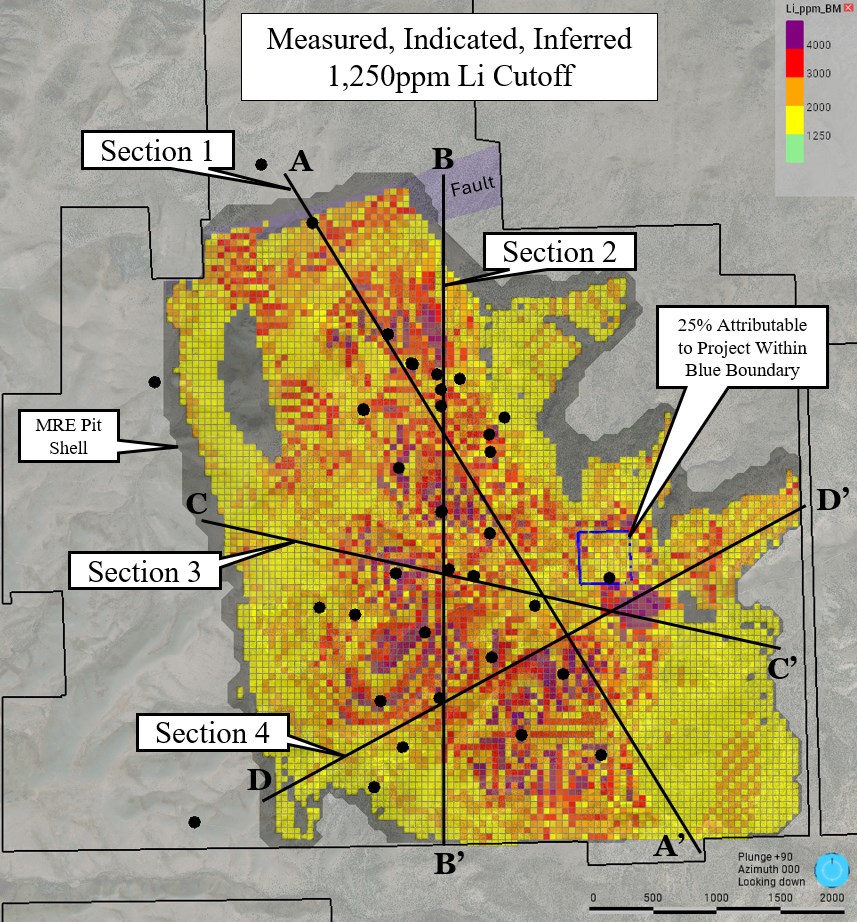
Figure 1: Plan view showing the Upgraded MRE at the NNLP with a 1,250ppm Li cutoff. The $20,000 LCE pit area is shown in dark gray. Four section lines indicate the location of the cross sections below.
Figure 2: Section 1 cross section looking ENE at pit-constrained blocks of the Upgraded block model. The blue dashed line indicates the historical PEA mine plan pit boundary.
Figure 3: Section 2 cross section looking E at pit-constrained blocks of the Upgraded block model. Note the significant expansion of high-grade mineralization on the southern half of this section, well outside the boundaries of the historical PEA Mine Plan Pit.
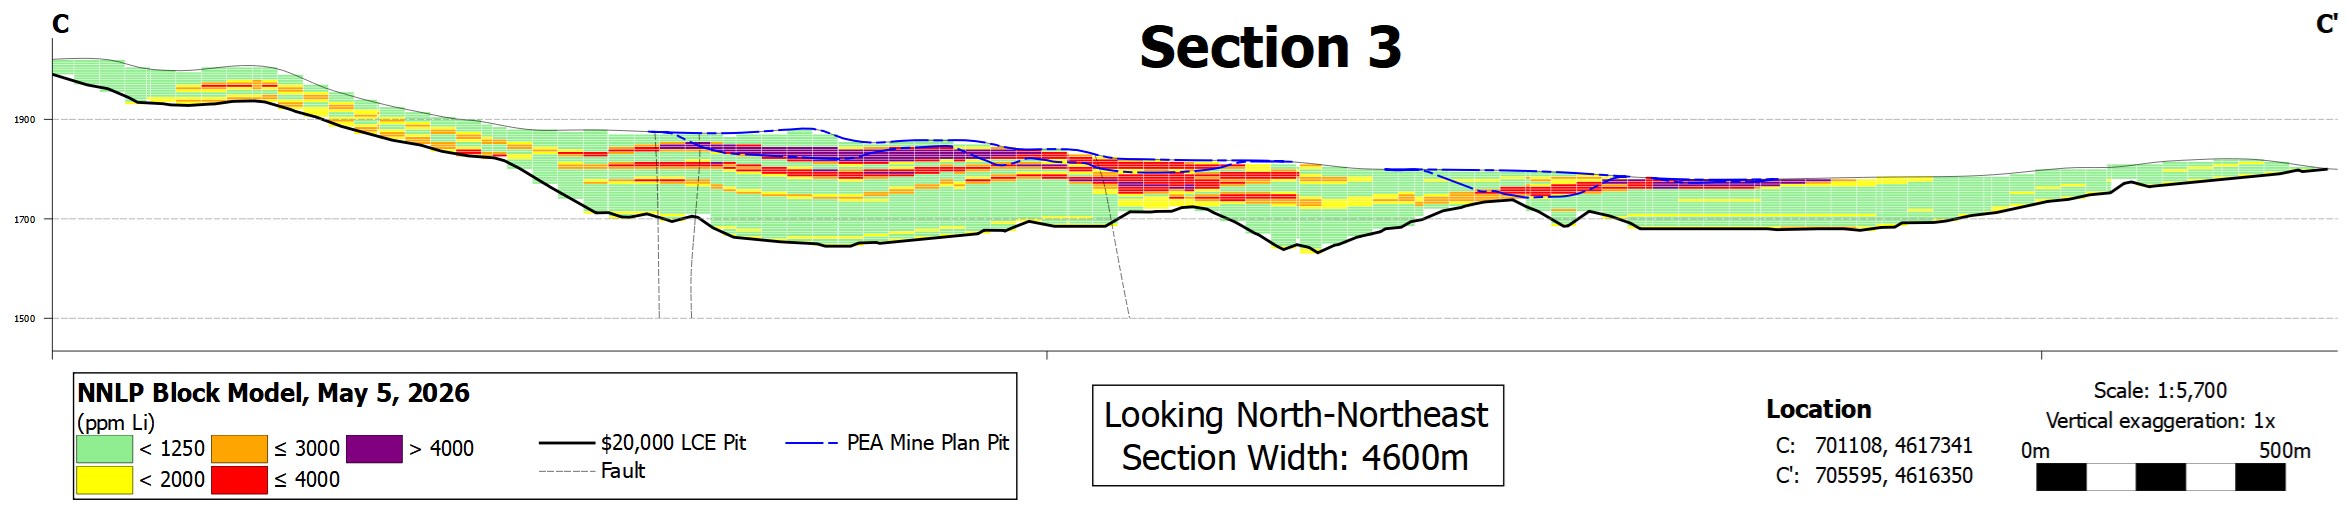
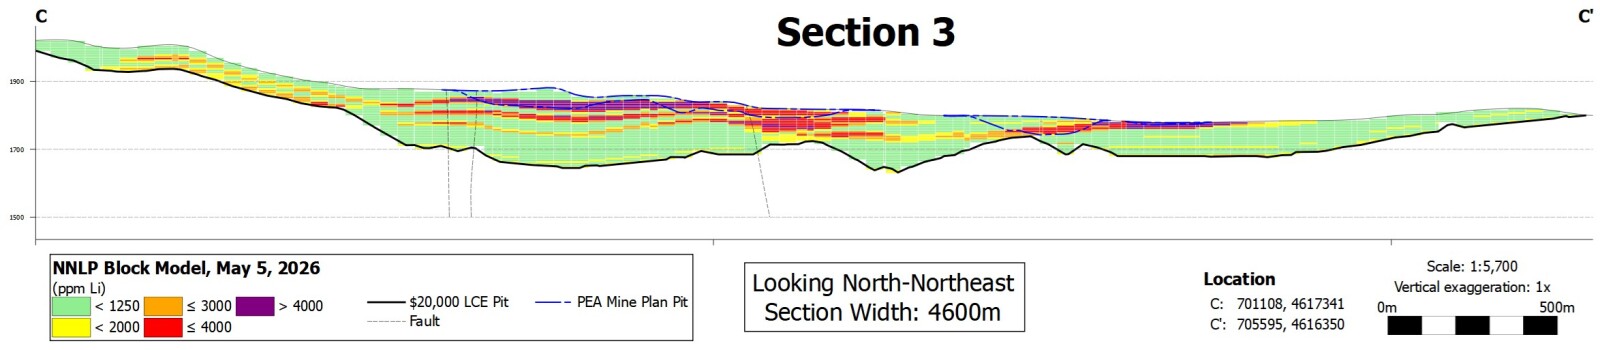
Figure 4: Section 3 cross section looking NNE at pit-constrained blocks of the Upgraded block model. Note the continuous high-grade blocks located immediately below the historical PEA Mine Plan Pit boundary, highlighting high-grade vertical expansion opportunities.
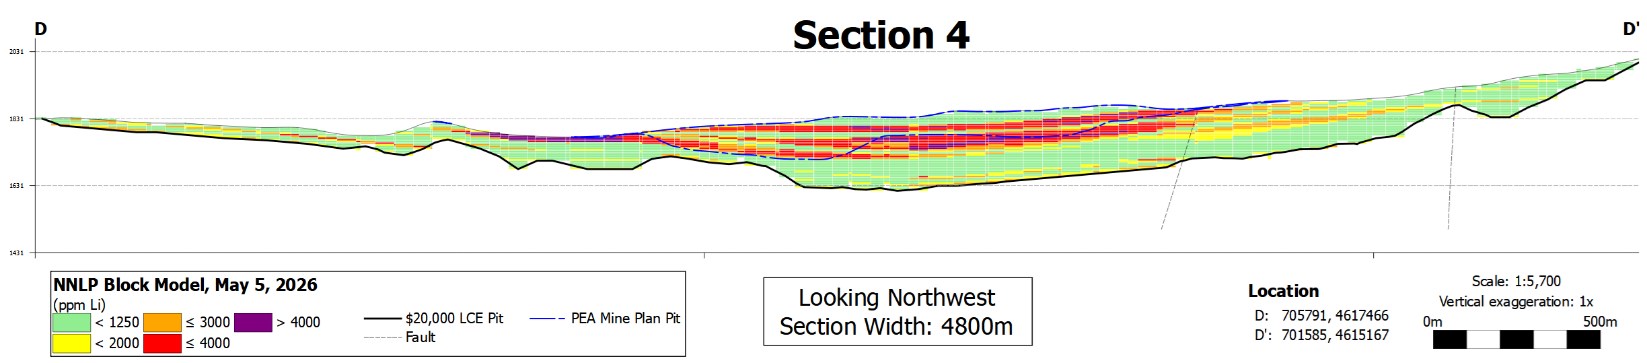
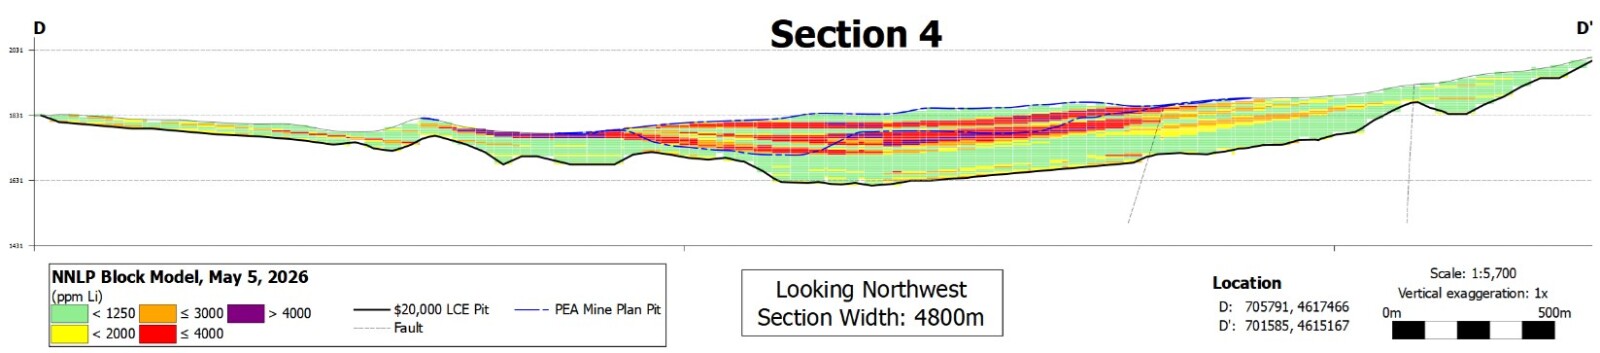
Figure 5: Section 4 cross section looking NW at pit-constrained blocks of the Upgraded block model. Note the high-grade mineralization extending beneath the historical PEA Mine Plan Pit in the center of the section, plus the high-grade blocks in the topographic low to the southwest, demonstrating significant expansion opportunities both near surface and at depth.
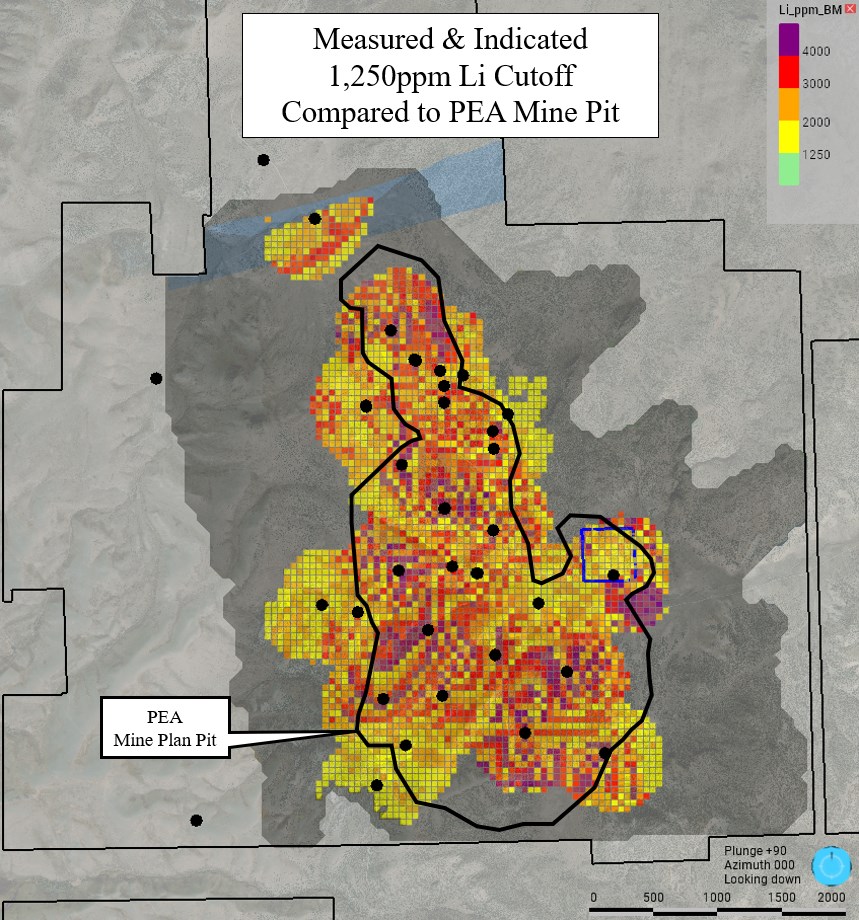
Figure 6: Plan view showing Measured & Indicated Blocks above 1,250ppm Li Cutoff. The $20,000 LCE pit area is shown in dark gray, and the PEA Mine Plan Pit outlined in black. In addition to converting approximately 87% of the PEA Mine Plan Pit to M&I, there is a significant lateral expansion of M&I blocks outside the historical pit boundary both laterally and at depth below the pit shell (as detailed in the cross sections of Figures 2-5).
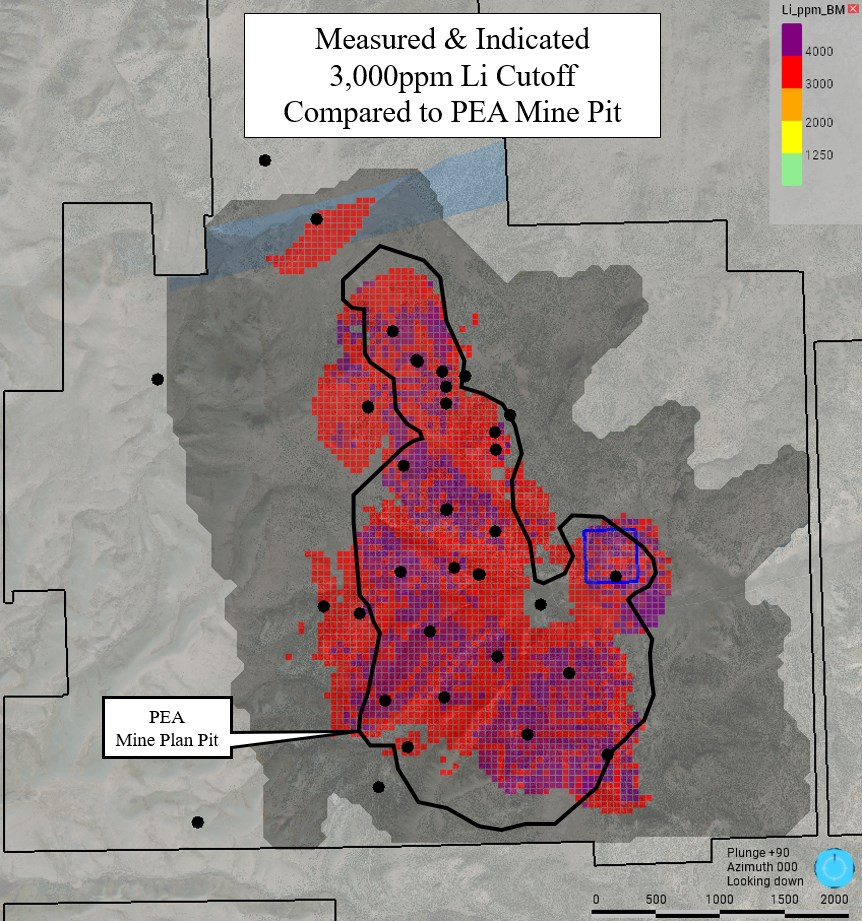
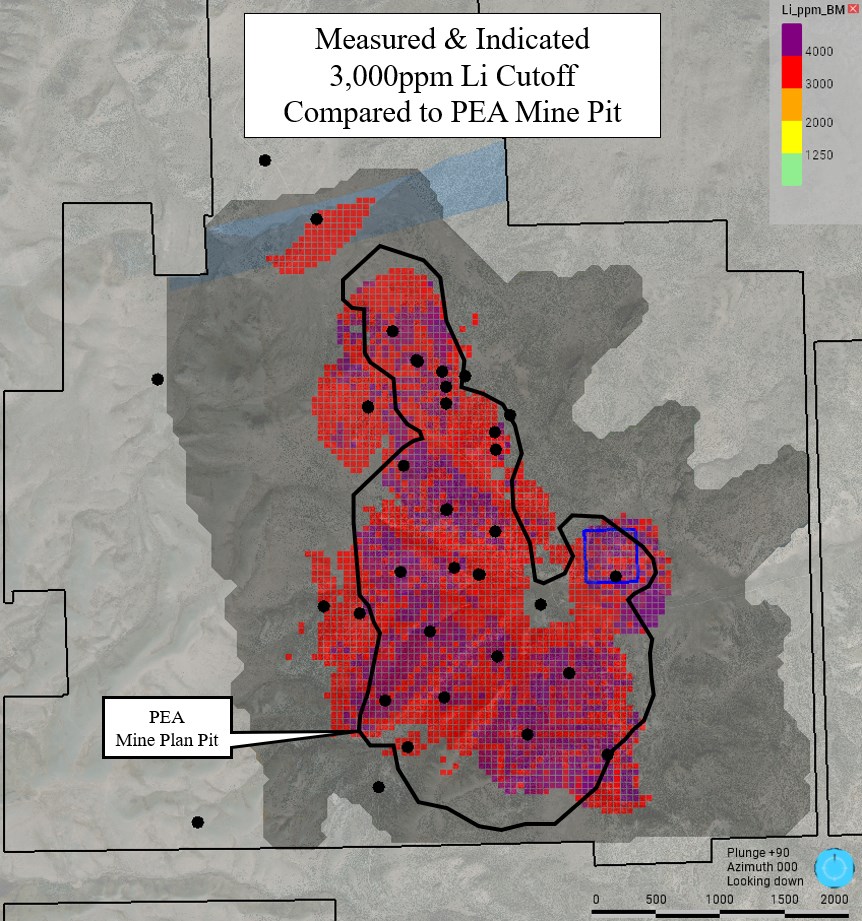
Figure 7: Plan view showing Measured & Indicated Classifications generated from the Upgraded MRE at the NNLP with a 3,000ppm Li cutoff. The $20,000 LCE pit area is shown in dark gray, and the PEA Mine Plan Pit outlined in black. This high-grade view clearly illustrates the robust lateral continuity of the >3000ppm M&I resource extending well beyond the historical PEA limits, alongside the significant depth potential demonstrated in the previous cross sections (Figures 2-5).
Today’s biggest stars express individuality and confidence with natural diamonds
NEW YORK, US – Media OutReach Newswire – 15 May 2026 – The 2026 Met Gala celebrating “Costume Art” took place May 4th at the Metropolitan Museum of Art in New York City, bringing together leading figures from across the globe for an unforgettable evening. These tastemakers showcased the most classic, refined and distinctive diamond jewelry looks of the season. Below, A Diamond is Forever highlights the standout trends from the event.
Desert diamonds
Desert diamonds emerged as a striking throughline on the Met Gala carpet, with a range of hues in distinctive settings taking focus.
Rihanna led the trend in a pair of exceptionally rare old Moghul Golconda fancy brown-yellow diamond earrings by Glenn Spiro, featuring two pear-shaped natural diamonds totaling 51.9 carats. Doja Cat offset her all nude look with a pair of large Leviev Diamonds floral-shaped earrings while Paloma Elsesser made a statement in a 29.5-carat diamond necklace by Bernard James, centered around a 15-carat fancy light yellow pear-shaped natural diamond. Cara Delevingne wore a De Beers London Forces of Nature High Jewelry ring, featuring marquise yellow diamonds set as eyes, while Emma Chamberlain opted for yellow and white diamond earrings by Chopard, underscoring the continued allure of warm diamond hues.
Magnificent Diamond Earrings
A wide variety of captivating silhouettes defined the natural diamond earrings on the Met Gala carpet. Zoë Kravitz delivered a modern twist with oversized diamond flower earrings by Jessica McCormack. Chase Sui Wonders opted for Jean Schlumberger by Tiffany & Co. Sea Fan earrings, bringing an element of sculptural artistry to the look. Gracie Abrams selected gently dangling Chanel earrings, adding understated fluidity, while Connor Storrie selected simple hoop earrings from Tiffany & Co., reinforcing the clean and enduring appeal of natural diamonds.
Standout Diamond Moments
Natural diamonds appeared in personal, unconventional and eye-catching ways, offering moments of surprise and awe. Power couple Beyoncé and Jay-Z embodied this trend with Beyoncé wearing Chopard’s Queen of Kalahari necklace, named after the rare 342-carat diamond that provided 23 stones for Chopard’s Garden of Kalahari collection. Jay-Z contributed to the narrative with a vintage diamond brooch by Briony Raymond worn at the collar as an unexpected placement that underscored the piece’s versatility. Isha Ambani made the styling of diamonds an art form in itself, wearing her own diamond jewelry featuring approximately 150 carats of old mine-cut diamonds, including a three-strand necklace and chandelier earrings, while also incorporating diamonds sewn directly into the bodice of her sari to represent significant moments in her life.
Together, these looks highlighted a shift toward natural diamonds as vessels of personal expression, styled with intention, individuality, and a sense of the unexpected.
Air Corporate data reveals 9 in 10 founders incorporated in Hong Kong do so remotely, driven by a 20% surge in Middle Eastern entrepreneurs seeking cost-effective operational alternatives to Dubai.
HONG KONG SAR – Media OutReach Newswire – 15 May 2026 – Air Corporate registered a 40.5% increase in Hong Kong incorporations in 2025, with the first quarter of 2026 already up 48% year-over-year. This data indicates that Hong Kong is reasserting itself as the leading Asian jurisdiction for company formation, fueled by a new wave of remote founders from the Middle East, North Africa, and Europe.
The prevailing narrative over the past five years suggested that Singapore was eclipsing Hong Kong; however, recent incorporation volumes challenge this. According to city-wide official figures cited by Vivian, Founder of Air Corporate, approximately 195,000 companies were registered in Hong Kong in 2025, compared to around 77,000 in Singapore.
“There was a lot of fuss about Singapore taking over Hong Kong as preferred jurisdiction over the last few years, but for 2025 alone, around 195,000 companies were formed in HK, vs around 77,000 for Singapore,” said Vivian. While city-wide registrations rose roughly 35% in 2025, incorporations at Air Corporate specifically grew by 40.5%. Vivian added, “With a 35% increase in the number of companies registered in 2025, Hong Kong is definitely back in the game as the top jurisdiction to start a company.”
The reality of Hong Kong company formation is increasingly global, lean, and founder-led. Nine in ten founders incorporated in Hong Kong with Air Corporate do not live there.
Key demographic and operational insights from Air Corporate’s client base include:
Approximately 90% of founders operate remotely from abroad, while 10% or less are based in Hong Kong.
Entrepreneurs aged 35 to 44 represent the largest age cohort at 38%, demonstrating that Hong Kong attracts founders in their prime career years rather than just younger digital nomads.
Serial entrepreneurs make up 60% of Air Corporate’s client mix, utilizing Hong Kong as an operational base for multiple companies, while first-time founders account for the remaining 40%.
A total of 89% of new companies are launched by solo founders (58%) or small teams of two to five individuals (31%).
Mainland China, Hong Kong, Turkey, India, the UAE, Australia, France, and Morocco rank among the top source markets for these founders.
Furthermore, 73% of new Hong Kong incorporations are directly tied to physical goods trade with China. This consists of e-commerce and dropshipping businesses (38%) and the trading of goods (35%). The recovery of in-person trade flows, including events, such as the Canton Fair and various industrial fairs, is pulling foreign founders back into the Greater China orbit and establishing Hong Kong as the natural entry point and financial layer over the world’s largest manufacturing base.
Air Corporate’s data recorded a 20% year-over-year growth in founders originating from the Middle East. This shift highlights a reverse migration where founders previously incorporated in Dubai are now choosing Hong Kong. Based on Vivian’s observations, founders often arrive in Dubai expecting fast incorporation and low costs, but discover that incorporation and maintenance are significantly more expensive than in Hong Kong, and banking remains difficult. Consequently, many founders move to Hong Kong after 12 to 24 months in the UAE, a trend accelerated by the Hong Kong government’s strategic outreach to the region.
For lean, remote-first businesses, speed-to-market is a critical factor. A founder located anywhere in the world can incorporate in Hong Kong and open a working bank account in approximately 7 days using digital banking partners. Currently, 90% of Air Corporate’s clients utilize these digital banking partners.
“Hong Kong and Singapore are the only places in Asia where you can set up your company, get a corporate account, and be in business in less than a week,” concluded Vivian.
Air Corporate is a service provider facilitating company formation and incorporation in Hong Kong for serial entrepreneurs, first-time founders, and remote-first business owners operating globally.
Media Inquiries To learn more about Hong Kong company formation, visit Air Corporate’s website or contact their team directly.
Hashtag: #AirCorporate
The issuer is solely responsible for the content of this announcement.
Capturing a New Gold Era by Transforming Market Volatility into Potential Option Premium Income
HONG KONG, May 15, 2026 /PRNewswire/ — Mirae Asset Global Investments (Hong Kong) Limited (“Mirae Asset (Hong Kong)”), through its Global X ETFs brand, is pleased to announce the launch of the Global X Gold Covered Call Active ETF (the “Fund”, Stock Codes: 3533/41533).
As Hong Kong continues to develop into an international gold trading hub and global demand for gold as a safe-haven asset remains strong, gold is entering a new phase of structural growth. The Fund is a synthetic strategy exchange-traded fund (ETF) that, through total return swaps, invests in gold futures and/or ETFs tracking gold prices, combined with a covered call strategy to generate option premium income. It offers investors an innovative solution to enhance income potential beyond traditional physical gold allocation.
Key Features
First of its kind in Hong Kong[1]– the first ETF to implement a gold covered call strategy, providing a new tool for gold allocation
Target monthly distributions[2] – aims to generate potential income through covered call strategies, providing a source of regular cash flow (distributions are not guaranteed and may be paid out of capital)
Competitive fee structure – a single management fee of 0.75%[3] per annum, among the lowest in its category
The Global X Gold Covered Call Active ETF was listed today on the Hong Kong Exchanges and Clearing Limited (HKEX) with an initial listing price of USD 10 per unit, and a board lot size of 50 units.
Ms. Judy Chu, Chief Executive Officer of Mirae Asset Global Investments (Hong Kong), said:
“Amid persistent macroeconomic uncertainty, rising geopolitical risks, and increased market volatility, gold continues to demonstrate its long-term strategic value. At the same time, investor demand for gold-related instruments is evolving from pure price exposure to income generation and volatility management. The launch of the Global X Gold Covered Call Active ETF is a direct response to this trend, offering a more flexible tool for gold allocation.”
Covered Call Strategy Characteristics
Favorable in volatile markets – option premiums typically rise during periods of higher market volatility, supporting potential income generation
Downside cushioning – premium income may partially offset declines in underlying gold prices
Limited upside potential – selling call options may cap upside gains, while retaining the benefit of premium income
About Mirae Asset Global Investments Group
Mirae Asset Global Investments (“Mirae Asset”) manages assets exceeding USD 377 billion. The firm offers a wide range of investment products, including mutual funds, exchange-traded funds (ETFs), and alternative investments. Mirae Asset operates 25 offices worldwide and employs over 1,000 professionals, including more than 260 investment specialists.[4]
Mirae Asset’s global ETF platform comprises over 738 ETFs, providing high-quality, cost-efficient investment solutions designed to capture emerging global investment themes and disruptive technologies. The firm manages approximately USD 234 billion in ETF assets, with listings across Australia, Brazil, Canada, Colombia, Hong Kong, India, Japan, Korea, Vietnam, Europe, and the United States.[4]
About Global X ETFs
Founded in 2008, Global X ETFs has been committed to providing innovative and intelligent investment solutions for over a decade. The firm offers 475 ETF strategies, with assets under management exceeding USD 155 billion. Global X is widely recognized for its thematic growth, income, and international market ETFs and is a member of the Mirae Asset Financial Group.[4]
[2] Distributions and option premium income are not guaranteed, and such distributions or income do not represent a positive return. Investors should not make investment decisions solely based on the above information. Investors should refer to the Fund’s offering documents (including the Product Key Facts Statement) for further details, including risk factors. Investment involves risks, and past performance is not indicative of future performance.
[3] As the Fund is newly established, this figure is an estimate and represents the cumulative ongoing charges over a 12–month period, expressed as a percentage of the estimated average net asset value of the listed class of shares during the same period. This figure may differ from the actual charges incurred during the Fund’s operation and may vary from year to year.
Please note that the ongoing charges figure does not include costs associated with financial derivative instruments (including swaps) entered into by the Fund. As the Fund adopts a single management fee structure, the estimated ongoing charges will be equal to the management fee, capped at 0.75% of the average net asset value of the Fund’s listed class of shares. Any ongoing charges exceeding this cap will be borne by the Manager and will not be charged to the Fund. For further details, please refer to the Product Key Facts Statement and the Fund Prospectus.


 https://vinfastauto.com






 https://adiamondisforever.com/
 https://www.linkedin.com/company/debeersgroup/
 http://www.twitter.com/DeBeersGroup
 https://www.facebook.com/profile.php?id=61571905725935
 https://www.instagram.com/adiamondisforeverhk/