Home Blog Page 578

OceanaGold Delivers Strong First Quarter with $255M of Free Cash Flow

(All financial figures in United States dollars unless otherwise stated)

  • Produced 130,100 ounces of gold and 3,200 tonnes of copper, in line with the full year plan.
  • Delivered record revenue, record operating cash flow, and increased the cash balance by 30%.
  • Progressed growth projects and returned $77 million to shareholders through share repurchases.

VANCOUVER, BC, May 6, 2026 /PRNewswire/ — OceanaGold Corporation (TSX: OGC) (NYSE: OGC) (“OceanaGold” or the “Company”) reported its operational and financial results for the three months ended March 31, 2026. The consolidated financial statements and Management’s Discussion and Analysis (“MD&A”) are available at www.oceanagold.com.

First Quarter Highlights

  • Safely and responsibly produced 130,100 ounces of gold and 3,200 tonnes of copper, as per plan.
  • All-In Sustaining Cost (“AISC”)† of $2,094 per ounce.
  • Record quarterly revenue of $715 million at a record average realized gold price of $4,894 per ounce.
  • EBITDA Margin† of 58%, net profit1 of $228 million and EPS of $1.01.
  • Record Operating Cash Flow of $382 million, generating strong Free Cash Flow† of $255 million.
  • Cash balance increased by 30% to $620 million. No debt, with revolving credit facility undrawn.
  • Completed $77 million in share repurchases, in line with the $350 million buyback program for 2026.
  • Released updated NI 43-101 technical reports for Haile, Macraes and Didipio, demonstrating a stable production profile and longer mine lives at each of the assets.
  • Confirmed continuity and extension of a newly defined southern high-grade zone at Wharekirauponga, with the portal now constructed and decline development underway.
  • Listed on the New York Stock Exchange (“NYSE”) on April 7, 2026.

Gerard Bond, President and CEO of OceanaGold, said “We have started 2026 strongly, delivering results broadly in line with our expectations, while continuing to execute on our growth and capital allocation priorities. Record Operating Cash Flow delivered a near-record $255M in Free Cash Flow in the quarter, growing our cash balance by 30% even after returning capital to shareholders through our dividends and buyback programs. Our NYSE listing in April further broadens our investor base, and we released encouraging exploration results at Wharekirauponga that highlight the quality and upside potential of this high‑grade orebody. Together, these first quarter achievements demonstrate our focus on execution and position us well to continue delivering on our plans and creating value for shareholders in 2026.”

† See “Non-IFRS Financial Information” 
1 Attributable to the shareholders of the Company.

Results Overview

Q1 2026

Q4 2025

Q1 2025

Gold Produced1

  Haile

koz

41.6

55.6

51.6

  Macraes

koz

51.5

55.8

28.4

  Waihi

koz

16.6

22.2

16.8

  Didipio

koz

20.4

23.8

20.6

Total gold produced1

koz

130.1

157.4

117.4

Gold Sales

  Haile

koz

47.3

50.3

57.2

  Macraes

koz

47.9

53.7

23.7

  Waihi

koz

17.6

21.1

15.9

  Didipio

koz

22.6

20.6

17.8

Total Gold sales

koz

135.4

145.7

114.6

Average Gold Price

$/oz

4,894

4,227

2,858

Copper Produced1 – Didipio

kt

3.2

3.2

3.4

Copper Sales1 – Didipio

kt

3.3

2.9

3.2

Average Copper Price

$/lb

6.10

5.35

4.27

Silver Produced

koz

130.7

136.2

162.7

Cash Costs†

  Haile

$/oz

1,779

1,529

715

  Macraes

$/oz

970

885

1,369

  Waihi

$/oz

1,556

1,584

1,445

  Didipio

$/oz

748

883

871

Consolidated Cash Costs†

$/oz

1,292

1,207

976

AISC†

  Haile

$/oz

2,637

2,295

1,551

  Macraes

$/oz

1,506

1,286

2,313

  Waihi

$/oz

2,155

2,068

2,019

  Didipio

$/oz

1,298

1,422

1,130

Consolidated AISC†

$/oz

2,094

1,761

1,796

Free Cash Flow†

$M

255.2

259.4

68.8

Net profit2

$M

228.4

327.7

99.7

Adjusted net profit†2

$M

229.5

201.7

100.7

EBITDA†

$M

416.7

543.2

192.0

Adjusted EBITDA†

$M

417.8

374.0

193.0

Earnings per share – diluted2

$/share

$1.01

$1.42

$0.42

Adjusted earnings per share – diluted†2   

$/share

$1.01

$0.88

$0.42

1 Production is reported on a 100% basis as all operations are controlled by OceanaGold.

2 Attributable to the shareholders of the Company.

† See “Non-IFRS Financial Information”

Dividend

OceanaGold has declared a $0.09 per share dividend payable in June 2026. Shareholders of record at the close of business in each jurisdiction on May 20, 2026 (the “Record Date”) will be entitled to receive payment of the dividend on June 19, 2026. The dividend payment applies to holders of record of the Company’s common shares traded on the TSX and the NYSE.

Declaration of Dividend    

Wednesday May 6, 2026

Record Date

Wednesday May 20, 2026

Dividend Payment Date

Friday June 19, 2026

Dividends are payable in United States dollars. Shareholders in other jurisdictions can elect to participate in Computershare’s international payments service if they want to receive dividends in an alternative currency. This dividend qualifies as an ‘eligible dividend’ for Canadian income tax purposes.

Share Buyback

In the first quarter, the Company completed $77 million of share repurchases. In February, the Company announced its intention to apply up to $350 million towards share buybacks in 2026, in addition to a tripling of the dividend.

Management Update

The Company announces that after 17 years, Liang Tang, EVP General Counsel & Company Secretary, advised of her intent to leave OceanaGold to spend more time with her family. The Company thanks Ms. Tang for her dedication, professionalism, poise, clear-thinking, advice and the many contributions she has made over her long and valued service.

Elizabeth Thampy has been appointed as OceanaGold’s new EVP General Counsel & Company Secretary.  With over a decade of experience in gold mining with other similar sized companies and several years at one of Canada’s largest law firms, Ms. Thampy brings a wealth of industry knowledge and a strong track record in securities law, corporate governance, risk management, and mergers & acquisitions. She joined OceanaGold on April 16, 2026.

Conference Call and Webcast:

Senior management will host a conference call and webcast to discuss the quarterly results on Thursday, May 7, 2026 at 10:00 am EDT (7:00 am PDT). To participate in the conference call, please use one of the following methods:

If you are unable to attend the call, a recording will be made available on the Company’s website.

About OceanaGold  

OceanaGold is a global intermediate gold and copper producer committed to safely and responsibly maximizing the generation of Free Cash Flow from our operations and delivering strong returns for our shareholders. We have a portfolio of four operating mines: the wholly-owned Haile Gold Mine in the United States of America; the wholly-owned Macraes and Waihi operations in New Zealand; and the 80%-owned Didipio Mine in the Philippines.

Cautionary Statement for Public Release 

This news release contains certain “forward-looking statements” and “forward-looking information” (collectively, “forward-looking statements”) within the meaning of applicable Canadian and United States securities laws which may include, but are not limited to, statements with respect to: the Company’s planned production, cost and capital Guidance for 2026; the future financial and operating performance of the Company and its mining projects and the anticipated benefits therefor; anticipated results and developments in the operations of OceanaGold in future periods; the development, expansion and operation of the Company’s mining projects; anticipated production levels and mine lives; the estimation, realization and classification of Mineral Reserves and Mineral Resources; costs of production; estimates of growth capital, sustaining capital, operating and exploration expenditures; costs and timing of the development of new deposits and mines; the timing, cost and outcome of development, construction and expansion activities; costs and timing of future exploration and drilling programs, including the Company’s site and regional exploration programs; water management initiatives and strategies and tailings management initiatives at the Company’s operations; the adequacy of current financial resources and cash reserves; requirements for additional capital; governmental regulation of mining operations and exploration operations; the timing and receipt of required permits, certifications, approvals, consents and renewals under applicable legislation; the amount of and timing for anticipated purchases under the Normal Course Issuer Bid program; compliance with applicable environmental, social, health and safety and other regulatory requirements; geotechnical and operational conditions; social licence to operate and stakeholder relationships; competition for mineral properties; the availability and terms of financing; foreign operations and political, economic and regulatory conditions in the jurisdictions in which the Company operates; expectations regarding the impacts of the U.S.-Iran international conflict on the Company’s operations, including with respect to prices for and delivery costs of certain consumable items; governmental regulation of mining operations and exploration operations; fluctuations in commodity prices, including gold, copper and silver, and foreign exchange rates; the expected inclusion of Waihi and Didipio in the Company’s hedging program; anticipated environmental risks; title disputes or claims; changes in laws, taxation and accounting standards; and the timing and possible outcome of pending legal proceedings, regulatory matters and other disputes. All statements in this news release that address events or developments that the Company expects to occur in the future are forward-looking statements. Forward-looking statements are statements that are not historical facts and are generally, although not always, identified by words such as “may”, “plans”, “expects”, “projects”, “is expected”, “scheduled”, “potential”, “estimates”, “forecasts”, “intends”, “targets”, “aims”, “anticipates” or “believes” or variations (including negative variations) of such words and phrases, or may be identified by statements to the effect that certain actions, events or results “may”, “could”, “would”, “should”, “might” or “will” be taken, occur or be achieved.

Forward-looking statements involve known and unknown risks, uncertainties and other factors which may cause the actual results, performance or achievements of the Company to be materially different from any future results, performance or achievements expressed or implied by the forward-looking statements. Such risks include, among others: the risk of not achieving the Company’s production estimates, forecasts or 2026 Guidance; inaccuracy of Mineral Reserves, Mineral Resources and operating and capital cost estimates; the actual results of current and future production, development and/or exploration activities; possible variations of ore grade, metallurgy or recovery rates; changes in mine plans, project parameters or assumptions as plans continue to be refined; delays in, or inability to complete, development or construction or expansion activities or to re-commence or sustain operations as planned; failures or underperformance of plant, equipment, infrastructure or processes; geotechnical risks or events, including open pit wall stability, crown pillar failure, land subsidence and tailings dam failures; scarcity in and disruption of global supply chain and/or increases in prices, including as a result of international conflicts, such as the recent U.S.-Iran conflict; challenges associated with effective water management; environmental, health and safety and climate-related risks; risks related to community acceptance, stakeholder engagement and social licence to operate; competition for mineral properties and other growth opportunities; legal and regulatory challenges to current and future permits, certifications, approvals or licences; adverse judicial, regulatory or governmental decisions; delays in, or inability to obtain, financing or governmental approvals on acceptable terms; changes in laws, regulations, taxation regimes, regulated accounting standards or their interpretation or application; the risks associated with operating in foreign jurisdictions, including political instability, changes in policy or law, civil unrest or conflict; fluctuations in the prices of gold, copper and silver; general business, economic and market conditions (including changes in global, national or regional financial, credit, currency or securities markets); changes or developments in global, national or regional political and social conditions; fluctuations in foreign exchange rates, including the value of the U.S. dollar relative to the Canadian dollar, the New Zealand dollar or the Philippine peso; trade policies and tensions, including tariffs; inflationary pressure; labour availability, retention and turnover; accidents, labour disputes and other operational risks of the mining industry; limitations of insurance coverage or uninsured risks; the conclusions of economic evaluations, studies and models; information technology, artificial intelligence and cybersecurity risks; and those other factors identified and described in more detail in the section entitled “Risk Factors” contained in the Company’s most recent Annual Information Form and the Company’s other filings with Canadian securities regulators and the U.S. Securities and Exchange Commission, which are available under the Company’s profile on SEDAR+ at sedarplus.ca and sec.gov, respectively, and on the Company’s website at oceanagold.com. The list is not exhaustive of the factors that may affect the Company’s forward-looking statements.

The Company’s forward-looking statements are based on the applicable assumptions and factors Management considers reasonable as of the date hereof, based on the information available to Management at such time. These assumptions and factors include, but are not limited to, assumptions and factors related to the Company’s ability to carry on current and future operations, including: exploration and development activities; the timing, extent, duration and economic viability of such operations; the accuracy and reliability of estimates, projections, forecasts, studies and assessments; the Company’s ability to meet or achieve Guidance, estimates, projections and forecasts; the availability and cost of inputs; the price and market for outputs, including gold, copper and silver; foreign exchange rates; taxation levels; the timely receipt of necessary permits, certifications, approvals or licences; the ability to meet current and future obligations; the ability to obtain timely financing on reasonable terms when required; the current and future social, economic and political conditions; and other assumptions and factors generally associated with the mining industry.

The Company’s forward-looking statements are based on the opinions and estimates of Management and reflect their current expectations regarding future events and operating performance and speak only as of the date hereof. The Company does not assume any obligation to update forward-looking statements if circumstances or Management’s beliefs, expectations or opinions should change other than as required by applicable laws. There can be no assurance that forward-looking statements will prove to be accurate, and actual results, performance or achievements could differ materially from those expressed in, or implied by, these forward-looking statements. Accordingly, no assurance can be given that any events anticipated by the forward-looking statements will transpire or occur, or if any of them do, what benefits or liabilities the Company will derive therefrom. For the reasons set forth above, undue reliance should not be placed on forward-looking statements.

Non-IFRS Financial Information

Adjusted Net Profit/(Loss) and Adjusted Earnings/(Loss) per share

These are used by Management to measure the underlying operating performance of the Company. Management believes these measures provide information that is useful to investors because they are important indicators of the strength of the Company’s operations and the performance of its core business. Accordingly, such measures are intended to provide additional information and should not be considered in isolation as a substitute for measures of performance prepared in accordance with IFRS. Adjusted Net Profit/(Loss) is calculated as Net Profit/(Loss) less the impact of impairment expenses and reversals, write-downs, foreign exchange (gains)/losses, gain on sale of assets and listing costs.

The following table provides a reconciliation of Adjusted Net Profit/(Loss) and Adjusted Earnings/(Loss) per share:

$M, except per share amounts

Q1 2026

Q4 2025

Q1 2025

Net profit1

228.4

327.7

99.7

Foreign exchange loss (gain)

0.1

(1.9)

0.8

Impairment reversal

—

(176.2)

—

NYSE listing costs

1.0

0.9

—

Write-down of assets

—

8.0

0.2

Tax expense on impairment reversal

—

43.2

—

Adjusted net profit1

229.5

201.7

100.7

Weighted average number of common shares – fully diluted   

226.6

230.2

238.3

Adjusted earnings per share

1.01

0.88

0.42

1 Attributable to the shareholders of the Company.

EBITDA, Adjusted EBITDA and Adjusted EBITDA Margin

Management believes that Adjusted EBITDA is a valuable indicator of its ability to generate liquidity by producing operating cash flows to fund working capital needs, service debt obligations and fund capital expenditures. EBITDA is defined as earnings before interest, tax, depreciation and amortization. Adjusted EBITDA is calculated as EBITDA less the impact of impairment expenses and reversals, write-downs, gains/losses on disposal of assets, listing costs, foreign exchange gains/losses and other non-recurring costs. Adjusted EBITDA Margin is calculated as Adjusted EBITDA divided by revenue.

The following table provides a reconciliation of EBITDA, Adjusted EBITDA and Adjusted EBITDA Margin:

$M

Q1 2026

Q4 2025

Q1 2025

Net profit

235.4

333.8

101.2

Depreciation and amortization

84.0

81.1

53.7

Net interest (income) expense and finance costs   

(1.0)

—

1.8

Income tax expense on earnings

98.3

128.3

35.3

EBITDA

416.7

543.2

192.0

Foreign exchange loss (gain)

0.1

(1.9)

0.8

Impairment reversal

—

(176.2)

—

NYSE listing costs

1.0

0.9

—

Write-down of assets

—

8.0

0.2

Adjusted EBITDA

417.8

374.0

193.0

Revenue

714.5

652.4

359.9

Adjusted EBITDA Margin

58 %

57 %

54 %

Cash Costs and AISC

Cash Costs are a common financial performance measure in the gold mining industry; however, it has no standard meaning under IFRS. Management uses this measure to monitor the performance of the Company’s mining operations and its ability to generate positive cash flows, both on an individual site basis and an overall company basis. Cash Costs include mine site operating costs plus indirect taxes and selling cost net of by-product allocations and are then divided by ounces sold. In calculating Cash Costs, the Company includes the value of cash-settled stock-based compensation in the year of vesting. Cash Costs are reduced by copper and silver by-product cost allocations that are considered incidental to the gold production process, thereby allowing Management and other stakeholders to assess the net costs of gold production. The measure is not necessarily indicative of cash flow from operations under IFRS or operating costs presented under IFRS.

Management believes that the AISC measure provides additional insight into the costs of producing gold by capturing all of the expenditures required for the discovery, development and sustaining of gold production and allows the Company to assess its ability to support capital expenditures to sustain future production from the generation of operating cash flows, both on an individual site basis and an overall company basis, while maintaining current production levels. Management believes that, in addition to conventional measures prepared in accordance with IFRS, certain investors use this information to evaluate the Company’s performance and ability to generate cash flow per ounce sold. AISC is calculated as the sum of Cash Costs, capital expenditures and exploration costs that are sustaining in nature and corporate G&A costs. AISC is divided by ounces sold to arrive at AISC per ounce.

 The following table provides a reconciliation of consolidated Cash Costs and AISC:

$M, except per oz amounts

Q1 2026

Q4 2025

Q1 2025

Cost of sales, excl. depreciation and amortization

226.8

231.3

142.9

Indirect taxes

9.0

8.5

4.8

Selling costs

3.7

3.8

2.8

Non-cash stock-based compensation adjustments2   

(9.0)

(26.8)

(3.4)

By-product allocation

(55.6)

(40.9)

(35.3)

Total Cash Costs (net)

174.9

175.9

111.8

Sustaining capital and leases

40.3

53.3

26.8

Deferred stripping and capitalized mining

45.9

26.5

55.3

Corporate general & administration3

19.9

(1.6)

10.4

Onsite exploration and drilling

3.2

0.3

1.6

Total AISC

284.2

254.4

205.9

Gold sales (koz)

135.4

145.7

114.6

Cash Costs ($/oz)

1,292

1,207

976

AISC ($/oz)1

2,094

1,761

1,796

1

Excludes the Additional Government Share related to the FTAA at Didipio of $22.1 million for the first quarter of 2026 and $2.9 million for the fourth quarter of 2025, as it is considered in the nature of an income tax.

2

Reflects the adjustment in AISC to stock-based compensation settled in cash over the year of vesting. Total Cash Costs include cash settled stock-based expenses of $6.7 million for the first quarter of 2026, $0.9 million for the fourth quarter of 2025 and $0.2 million for the first quarter of 2025.

3

Corporate general & administration includes $7.4 million in cash settled stock-based compensation for the first quarter of 2026, $3.2 million for the fourth quarter of 2025 and $1.3 million for the first quarter of 2025.

The following tables provide a reconciliation of Cash Costs and AISC for each operation:

Haile

$M, except per oz amounts

Q1 2026

Q4 2025

Q1 2025

Cash costs of sales1

79.8

83.5

45.6

By-product allocation

(1.2)

(1.0)

(1.9)

Inventory adjustments

5.4

(5.8)

(3.0)

Freight, treatment and refining charges

0.2

0.1

0.2

Total Cash Costs (net)

84.2

76.8

40.9

Sustaining capital and leases

18.7

23.0

10.4

Deferred stripping and capitalized mining   

21.2

15.2

36.4

Onsite exploration and drilling

0.9

—

0.8

Total AISC

125.0

115.0

88.5

Gold sales (koz)

47.3

50.2

57.2

Cash Costs ($/oz)

1,779

1,529

715

AISC ($/oz)

2,637

2,295

1,551

1 Reflects the inclusion of cash settled stock-based compensation over the year of vesting.

Macraes

$M, except per oz amounts

Q1 2026

Q4 2025

Q1 2025

Cash costs of sales1

45.1

49.8

39.2

By-product allocation

(0.1)

(0.2)

(0.1)

Royalties

6.7

7.8

0.7

Inventory adjustments

(5.9)

(10.5)

(7.6)

Freight, treatment and refining charges

0.6

0.6

0.2

Total Cash Costs (net)

46.4

47.5

32.4

Sustaining capital and leases

8.6

16.6

9.4

Deferred stripping and capitalized mining  

15.8

3.8

12.3

Onsite exploration and drilling

1.2

1.0

0.6

Total AISC

72.0

68.9

54.7

Gold sales (koz)

47.9

53.7

23.7

Cash Costs ($/oz)

970

885

1,369

AISC ($/oz)

1,506

1,286

2,313

1 Reflects the inclusion of cash settled stock-based compensation over the year of vesting.

Waihi

$M, except per oz amounts

Q1 2026

Q4 2025

Q1 2025

Cash costs of sales1

34.2

40.2

26.8

By-product allocation

(6.3)

(4.1)

(2.1)

Royalties

2.8

3.4

0.5

Inventory adjustments

(3.4)

(6.2)

(2.3)

Add: Freight, treatment and refining charges  

0.1

0.1

0.1

Total Cash Costs (net)

27.4

33.4

23.0

Sustaining capital and leases

4.9

6.8

4.3

Deferred stripping and capitalized mining

4.7

3.4

4.7

Onsite exploration and drilling

1.1

(0.1)

0.2

Total AISC

38.1

43.5

32.2

Gold sales (koz)

17.6

21.1

15.9

Cash Costs ($/oz)

1,556

1,584

1,445

AISC ($/oz)

2,155

2,068

2,019

1 Reflects the inclusion of cash settled stock-based compensation over the year of vesting.

Didipio

$M, except per oz amounts

Q1 2026

Q4 2025

Q1 2025

Cash costs of sales1

41.1

42.9

32.1

By-product allocation

(48.0)

(35.6)

(31.2)

Royalties

3.5

2.5

1.6

Indirect taxes

8.3

6.6

4.7

Inventory adjustments

7.8

(2.9)

4.5

Freight, treatment and refining charges

4.2

4.7

3.8

Total Cash Costs (net)

16.9

18.2

15.5

Sustaining capital and leases

8.1

6.9

2.7

Deferred stripping and capitalized mining  

4.2

4.1

1.9

General & administration2

0.1

0.7

0.1

Onsite exploration and drilling

—

(0.3)

—

Total AISC

29.3

29.6

20.2

Gold sales (koz)

22.6

20.6

17.8

Cash Costs ($/oz)

748

883

871

AISC1 ($/oz)

1,298

1,422

1,130

1

Beginning in the first quarter of 2025, Didipio’s AISC calculation includes local corporate G&A costs.

2

Excludes the Additional Government Share related to the FTAA at Didipio of $22.1 million and $2.9 million for the first quarter of 2026 and fourth quarter of 2025, respectively, as it is considered in the nature of an income tax. 

Net Cash/(Debt)

Net Cash/(Debt) has been calculated as total debt plus cash and cash equivalents. Management believes this is a useful indicator to be used in conjunction with other liquidity and leverage ratios to assess the Company’s financial health.

The following table provides a reconciliation of Net Cash/(Debt):

$M

March 31, 2026

December 31,
2025

Amounts drawn under the revolving credit facility  

—

—

Total debt

—

—

Cash and cash equivalents

620.1

476.5

Net Cash

620.1

476.5

Operating Cash Flow before working capital movements

Operating Cash Flow before working capital movements is calculated as the cash flows provided by operating activities adjusted for changes in working capital. The following table provides a reconciliation of Operating Cash Flow before working capital movements:

$M, except per share amounts

Q1 2026

Q4 2025

Q1 2025

Cash provided by operating activities

381.5

358.2

171.6

Changes in working capital

(46.9)

(79.6)

25.2

Cash flows provided by operating activities before changes in working  
capital

334.6

278.6

196.8

Free Cash Flow

Free Cash Flow is calculated as cash flows from operating activities, less cash flow used in investing activities. Management believes Free Cash Flow is a useful indicator of the Company’s ability to generate cash flow and operate net of all expenditures, prior to any financing cash flows. The following table provides a reconciliation of Free Cash Flow:

$M, except per share amounts

Q1 2026

Q4 2025

Q1 2025

Cash flows provided by Operating Activities  

381.5

358.2

171.6

Cash flows used in Investing Activities

(126.3)

(98.8)

(102.8)

Free Cash Flow

255.2

259.4

68.8

 For further information please contact: Investor Relations: Rebecca Henare, Vice President, Investor Relations, Tel: +1 604-678-4095, ir@oceanagold.com; Valerie Burns, Manager, Investor Relations, Tel: +1 604-235-0742, ir@oceanagold.com; Media Relations: Louise Burgess, Vice President, Communications, Tel: +1 604-403-2019, info@oceanagold.com

Logo – https://laotiantimes.com/wp-content/uploads/2026/05/oceanagold_corporation_oceanagold_delivers_strong_first_quarter.jpg 

Artprice News: The Lyon Biennale 2026 redefines the driving forces of international contemporary art

PARIS, May 7, 2026 /PRNewswire/ — In autumn 2026, in the wake of the Venice Biennale, the Lyon Biennale of Contemporary Art establishes itself as one of the major events on the international artistic calendar.

18th Lyon Biennale Contemporary Art - 2026
18th Lyon Biennale Contemporary Art – 2026

As France’s leading contemporary art event, each edition brings together nearly 300,000 visitors and generates more than 2.7 million encounters with artworks in public space, affirming a unique model in which artistic production, dissemination, territorial engagement and international reach converge on a large scale.

More than an exhibition, the Lyon Biennale now constitutes an international platform of influence, situated at the intersection of artistic scenes, institutions, collectors, foundations, professionals and global economic dynamics.

18th Lyon Biennale of Contemporary Art
Passer d’un rêve à l’autre / To pass from one dream to another
Lyon, France | September 19 – December 13, 2026
https://www.labiennaledelyon.com/en

Download Press Kit: https://www.labiennaledelyon.com/en/espace-presse-art

After Venice, Lyon: a new centre of gravity for the global art scene

The 18th Lyon Biennale of Contemporary Art will take place at the heart of autumn 2026, at a strategic moment within the international contemporary art calendar. It extends, shifts and reactivates the major artistic conversations initiated in Venice, grounding them within a singular territory: Lyon, a city of passages, exchanges and transformations.

Within this urban, historical and economic geography, the Biennale transforms Lyon into a full-scale space for experimentation, where artworks engage in dialogue with heritage, industrial, museum and public sites.

Catherine Nichols: an international curatorial voice on the rise

The 18th edition is entrusted to Catherine Nichols, a Berlin-based curator, writer and art historian. She was recently appointed Artistic Director of Manifesta, within the framework of a new co-directorship model that will come into effect from October 2026 onward.

With Passer d’un rêve à l’autre, Catherine Nichols develops an ambitious project centred on the notion of “poetic economy,” inspired by Robert Filliou. Here, the economy is not approached merely as a financial system: it becomes a sensitive infrastructure composed of relationships, flows, narratives, visible and invisible labour, and material as well as immaterial values.

Rooted in Lyon’s history — a city shaped by commerce, circulation, silk production, industry and confluences — this reflection takes on both a local and profoundly global dimension.

An expanded artistic cartography: new scenes, new narratives

Bringing together more than 70 international artists, this edition is distinguished by a strong openness toward artistic scenes still insufficiently represented in Europe, particularly from Australia and New Zealand, and spanning more than thirty nationalities. These territories engage in dialogue with the French and European scenes within a framework that brings together major figures, established artists and emerging voices.

The Biennale thus constructs an expanded artistic cartography in which questions of value, care, heritage, production and transformation run across practices, generations and geographies.

Artists – (full list to be completed in June)

Akwasi Bediako Afrane, Lara Almarcegui, Joël Andrianomearisoa, Serwah Attafuah, Béatrice Balcou, Eva Barto, Lucy Beech, Rossella Biscotti, Barbara Breitenfellner, Yuriyal Eric Bridgeman, Sara Sejin Chang (Sara van der Heide), Fiona Clark, Lua Coderch, Léa Collet, June Crespo, cyan, Edith Dekyndt, Huong Dodinh, Yana Nafysa Dombrowsky-M’baye, Mikala Dwyer, Robert Filliou, Florian Fouché, Rose Frigière, Angela Goh, Birke Gorm, Nuria Güell, Alice Guy, Oda Haliti, Archana Hande, Matthew Harris, Timo Hogan, Ngahina Hohaia, Jelena Jureša, Lucia Kagramanyan, Kirtika Kain, Mikhail Karikis, Ndayé Kouagou, Perrine Lacroix, Maureen Lander, Ida Lawrence, James Lewis, LYL Radio, Kokou Ferdinand Makouvia, Nicholas Mangan, Angelica Mesiti, Hana Miletić, Hayley Millar Baker, Jazz Money, Mai Nguyen-Long, Manfred Paul, Thea Anamara Perkins, Susan Philipsz, Laure Prouvost, raumlaborberlin, Miguel Rothschild, Selma Selman, Erwan Séné, Igor Šimić, Sriwhana Spong, Tina Stefanou, Mette Sterre, Michael Stevenson, Pol Taburet, Huda Takriti, Tsuneko Taniuchi, Ashleigh Taupaki, Minh Lan Tran, Thu-Van Tran, Álvaro Urbano, Kaylene Whiskey, Luke Willis Thompson, Candrani Yulis.

Exhibition venues

  • macLYON – Museum of Contemporary Art
  • Les Grandes Locos
  • Museum of Textiles and Decorative Arts
  • Traboules of the Croix-Rousse slopes – free access
  • Garden of the Museum of Fine Arts – free access
  • IAC – Institute of Contemporary Art / Frac Rhône-Alpes
  • Musée des Confluences
  • Bullukian Foundation – free access
  • LPA Saint-Antoine car park – free access
  • Metro line B station – Gare Part-Dieu

An international platform for production and influence

The Lyon Biennale is simultaneously a site for the production of new works, an international professional hub and a space for reflection on contemporary transformations. It is embedded within a global network, notably through the International Biennial Association, and each edition welcomes artists, curators, institutions, foundations, partners and art market actors.

Through its artistic projects, professional programmes, international collaborations, mediation initiatives and participatory projects, the Lyon Biennale asserts a singular model: a leading event open to the widest possible audience and fully engaged with the issues of its time.

Key dates

  • September 16–18, 2026: Press Days
  • September 17–18, 2026: Professional Days
  • September 18, 2026: Preview / Opening
  • September 19, 2026: Public Opening
  • December 13, 2026: Closing Date

About the Lyon Biennale

For more than forty years, the Lyon Biennale has organised two major events on the cultural scene in France and internationally: the Biennale of Contemporary Art and the Dance Biennale.

As the institution responsible for the conception, programming and implementation of these two events, the Lyon Biennale is today recognised as one of the major international events dedicated to contemporary creation. It enjoys strong recognition among professionals, the press and audiences alike.

Its commitment is based on four core missions: an ethical mission, through the development of a sensitive relationship to the world via visual arts and dance; a social mission, through openness to all audiences and the creation of social bonds; an economic mission, through its contribution to the visibility and attractiveness of the territory; and a CSR mission, through a socially responsible approach toward all its stakeholders.

Creativity, excellence, rigour, solidarity, social diversity and inclusivity lie at the heart of the Lyon Biennale project.

Governance

  • President: Laurent Bayle
  • Chief Executive Officer: Cécile Bourgeat
  • Artistic Director of the Lyon Biennale of Contemporary Art: Isabelle Bertolotti
  • Curator: Catherine Nichols

The 2026 Lyon Biennale embodies a unique model and has established itself as a must-attend event on the international scene. Twenty-six years after their first collaboration, Artprice by Artmarket and La Demeure du Chaos are partnering with the 18th Lyon Biennale.

A must-attend event on the international Art calendar, the Lyon Biennale has established itself, following in Venice’s footsteps, as much more than an exhibition: a platform of influence where artists, institutions, collectors, foundations, and key players in the global Art Market converge.

Twenty-six years after “Partage d’Exotisme”- the legendary 2000 Biennial curated by Jean-Hubert Martin, which served as a follow-up to his famous 1989 exhibition “Les Magiciens de la Terre” at the Centre Georges Pompidou and caused a sensation in the West. This Biennial brought together Artprice by Artmarket and La Demeure du Chaos as patrons for the first time. In 2026, they will once again join the Lyon Contemporary Art Biennial as committed partners for its 18th edition.

Thierry Ehrmann, founder of Artprice, president of Artmarket, and visual artist for over four decades, creator of La Demeure du Chaos – officially recognized on March 20, 2025 as a “Total Work of Art” by Minister of Culture Rachida Dati, applauds the significance of this Biennale of Contemporary Art, which engages with the geographical and economic characteristics of the city of Lyon.

It is in this spirit that the two entities are joining forces to support the work of Selma Selman, an artist who employs performance, painting, photography, and video to embody the struggles of her community, questioning the value of labor, objects, and bodies. She extracts the hidden poetry from industrial materials – and reminds us that beauty, too, is born of Chaos.

https://www.artprice.com/artprice-news

Contact: econometrics@artprice.com

Catherine Nichols, Isabelle Bertolotti - Photo: Blandine Soulage
Catherine Nichols, Isabelle Bertolotti – Photo: Blandine Soulage


Recon Receives NASDAQ Notification Regarding Minimum Bid Requirements

BEIJING, May 7, 2026 /PRNewswire/ — Recon Technology, Ltd (NASDAQ: RCON) (“Recon” or the “Company”) today announced that on May 4, 2026, it received a letter from The Nasdaq Stock Market LLC (“Nasdaq”), notifying the Company that it is currently not in compliance with the minimum bid price requirement set forth under Nasdaq Listing Rule 5550(a)(2). It resulted from the fact that the closing bid price of the Company’s ordinary shares was below $1.00 per share for a period of 30 consecutive business days. This press release is issued pursuant to Nasdaq Listing Rule 5810(b), which requires prompt disclosure of receipt of a deficiency notification. The notification has no immediate effect on the listing of the Company’s ordinary shares, which will continue to trade uninterrupted on Nasdaq under the ticker “RCON”.

Pursuant to Nasdaq Listing Rule 5810(c)(3)(A), the Company has a compliance period of 180 calendar days, or until November 2, 2026 (the “Compliance Period”), to regain compliance with Nasdaq’s minimum bid price requirement. If at any time during the Compliance Period, the closing bid price per share of the Company’s ordinary shares is at least $1.00 for a minimum of 10 consecutive business days, Nasdaq will provide the Company a written confirmation of compliance and the matter will be closed.

In the event the Company does not regain compliance with the minimum bid price requirement by November 2, 2026, the Company may be eligible for an additional 180 calendar day grace period.

About Recon Technology, Ltd (“RCON”)

Recon Technology, Ltd (NASDAQ: RCON) is the People’s Republic of China’s first NASDAQ-listed non-state owned oil and gas field service company. Recon supplies China’s largest oil exploration companies, Sinopec (NYSE: SNP) and The China National Petroleum Corporation (“CNPC”), with advanced automated technologies, efficient gathering and transportation equipment and reservoir stimulation measure for increasing petroleum extraction levels, reducing impurities and lowering production costs. Through the years, RCON has taken leading positions within several segmented markets of the oil and gas filed service industry. RCON also has developed stable long-term cooperation relationship with its major clients. For additional information please visit: http://www.recon.cn/.

Forward-Looking Statements

Recon includes “forward-looking statements” within the meaning of the federal securities laws throughout this press release. A reader can identify forward-looking statements because they are not limited to historical fact or they use words such as “scheduled,” “may,” “will,” “could,” “should,” “would,” “expect,” “believe,” “anticipate,” “project,” “plan,” “estimate,” “forecast,” “goal,” “objective,” “committed,” “intend,” “continue,” or “will likely result,” and similar expressions that concern Recon’s strategy, plans, intentions or beliefs about future occurrences or results. Forward-looking statements are subject to risks, uncertainties and other factors that may change at any time and may cause actual results to differ materially from those that Recon expected. Many of these statements are derived from Recon’s operating budgets and forecasts, which are based on many detailed assumptions that Recon believes are reasonable, or are based on various assumptions about certain plans, activities or events which we expect will or may occur in the future. However, it is very difficult to predict the effect of known factors, and Recon cannot anticipate all factors that could affect actual results that may be important to an investor. All forward-looking information should be evaluated in the context of these risks, uncertainties and other factors, including those factors disclosed under “Risk Factors” in Recon’s most recent Annual Report on Form 20-F and any subsequent half-year financial filings on Form 6-K filed with the Securities and Exchange Commission. All forward-looking statements are qualified in their entirety by the cautionary statements that Recon makes from time to time in its SEC filings and public communications. Recon cannot assure the reader that it will realize the results or developments Recon anticipates, or, even if substantially realized, that they will result in the consequences or affect Recon or its operations in the way Recon expects. Forward-looking statements speak only as of the date made. Recon undertakes no obligation to update or revise any forward-looking statements to reflect events or circumstances arising after the date on which they were made, except as otherwise required by law. As a result of these risks and uncertainties, readers are cautioned not to place undue reliance on any forward-looking statements included herein or that may be made elsewhere from time to time by, or on behalf of, Recon.


Global Millennial Capital Raises USD 100 Million to Fund New-Age Technology Leaders in Underpenetrated Mid-Cap Segments

GMCL’s IPO Opportunities Fund targets investments in AI, decentralized finance technologies, and new-age energy solutions in companies with a market capitalization between USD 5 billion and USD 20 billion

BOSTON, May 7, 2026 /PRNewswire/ — Global Millennial Capital Ltd. (GMCL) has announced the final closure of its inaugural IPO Opportunities Fund at USD 100 million, raised through a private placement offering to institutional and professional investors. The fund is designed to provide exposure to late-stage, technology-driven companies approaching potential liquidity events, with a particular focus on mid-cap businesses typically valued between USD 5 billion and USD 20 billion. These segments are increasingly attractive as technology adoption accelerates, yet capital allocation remains less concentrated compared to large-cap markets.

Global Millennial Capital Raises USD 100 Million to Fund New-Age Technology Leaders in Underpenetrated Mid-Cap Segments

The launch of the fund reflects a broader structural shift in global capital markets. Technology companies are remaining private for longer periods while achieving greater scale, revenue visibility, and operational maturity before entering the public markets. This dynamic has created a distinct opportunity for investors to access high-quality companies at a stage where risk is more defined than early-stage investing, while still retaining meaningful upside potential.

According to Andreea Danila, Head of Investment and Research at Global Millennial Capital, the expansion of mid-cap technology businesses is particularly evident at the intersection of artificial intelligence, decentralized finance technologies, new age energy solutions, and data. These companies, while often overlooked by both large-cap allocators and early-stage investors, are increasingly positioned at critical inflection points in their growth trajectories. The fund’s strategy is therefore focused on identifying and supporting such businesses during the final stages of value creation ahead of an IPO or strategic transaction.

The fund’s sector focus reflects areas where technology is driving systemic change across both financial services and the real economy. Key themes include artificial intelligence, decentralized finance, cybersecurity, enterprise software, and next-generation energy infrastructure. These sectors are increasingly interconnected, with advances in data, automation, and digital infrastructure reshaping how capital is allocated, how services are delivered, and how value is created.

The investor base of the GMCL IPO Opportunities Fund reflects global capital flows into technology and innovation. Participants include family offices and institutional investors from Saudi Arabia, Kuwait, and Qatar, alongside existing GMCL investors and international wealth management partners. The fund is designed to provide diversified exposure across geographies and business models.

Global Millennial Capital’s investment team brings experience across venture capital, private equity, and capital markets, with particular expertise in managing investments through the transition from private to public ownership. This includes structuring late-stage investments, assessing IPO readiness, and navigating liquidity pathways, including both public listings and strategic exits.

Important Information
The Fund is registered as a private investment fund under the laws of the British Virgin Islands. Registration by the British Virgin Islands Financial Services Commission (the “FSC”) does not constitute approval or endorsement of the Fund by the FSC.

This press release is for informational purposes only and does not constitute an offer to sell or a solicitation of an offer to buy any interests in the Fund or any other security. Any such offer or solicitation will be made only pursuant to the Fund’s confidential offering documents, which should be reviewed in their entirety, including the risk factors described therein.

Interests in the Fund are offered on a private placement basis only to a limited number of investors who meet applicable eligibility requirements, including professional or sophisticated investors, and are subject to restrictions on transfer and resale.

No invitation is made to the public to subscribe for interests in the Fund. The Fund is closed to new investors.

This press release is not directed at, and should not be distributed to or relied upon by, any person in any jurisdiction where such distribution or use would be contrary to applicable law or regulation. Interests in the Fund have not been and will not be registered under the U.S. Securities Act of 1933, as amended, or any applicable state securities laws, and may not be offered or sold in the United States except pursuant to an exemption from, or in a transaction not subject to, such registration requirements.

Certain statements in this release may constitute forward-looking statements. These statements are based on current expectations and assumptions and involve known and unknown risks and uncertainties. Actual results may differ materially. No representation or warranty is made as to the accuracy or completeness of such statements.

Past performance is not indicative of future results. There can be no assurance that the Fund will achieve its investment objectives or that investors will receive a return of their capital.

About Global Millennial Capital Ltd.
Global Millennial Capital Ltd. is a venture capital firm registered with the British Virgin Islands Financial Services Commission and headquartered in Boston, United States, with a global mandate to invest across transformative technology sectors. GMCL focuses on research-driven IPO and growth-stage investments in high-potential companies spanning artificial intelligence, decentralized finance, blockchain, software, fintech, cybersecurity, next-generation energy, and other emerging technologies shaping the future economy.

Disclaimer

Global Millennial Capital Ltd. is affiliated with the GMCL IPO Opportunities Fund (the “Fund”), which is registered as a private investment fund under the laws of the British Virgin Islands. Registration of the Fund by the British Virgin Islands Financial Services Commission does not constitute approval or endorsement of the Fund.

No part of this article is intended to constitute, or may be relied upon as, investment advice, an investment recommendation, an offer to sell, or a solicitation of any offer to buy any security or adopt any investment strategy. Any investment in the Fund will be made solely on the basis of the Fund’s confidential offering documents.

Global Millennial Capital Ltd. is not registered as an investment adviser under the U.S. Investment Advisers Act of 1940, as amended.

AeC Receives Frost & Sullivan’s 2026 Brazilian Customer Experience Management Company of the Year Recognition

Recognized for its visionary innovation and disciplined growth, delivering exceptional customer satisfaction and operational excellence in Brazil’s evolving landscape.

SAN ANTONIO, May 7, 2026 /PRNewswire/ — Frost & Sullivan is pleased to announce that AeC has been given the 2026 Brazilian Company of the Year Recognition in the customer experience management industry for its outstanding achievements in innovation, strategy execution, and customer impact. This recognition highlights AeC’s consistent leadership in driving measurable outcomes, strengthening its market position, and delivering customer-centric innovation in an evolving competitive landscape.

Guided by a long-term growth strategy focused on innovation, resilience, and customer trust, AeC has shown its ability to adapt and lead in a rapidly evolving landscape. The company’s strategic agility and sustained investment in AI-driven solutions have enabled it to scale effectively across Brazil. By prioritizing proprietary technologies tailored to local market needs, AeC ensures agility, cost efficiency, and high-impact service delivery.

Innovation remains central to AeC’s approach. Its suite of AI-driven solutions, including the TeIA platform and AI copilot capabilities, addresses the full spectrum of customer experience management needs, offering enhanced security, real-time fraud prevention, and intelligent automation. These capabilities empower organizations to improve operational efficiency while maintaining a strong human-centric approach to customer engagement. “AeC has emerged as the more solid and consistent market participant in this environment. While many competitors struggled with market contraction and operational inefficiencies, AeC tripled its revenue over four years and increased its market share year over year, from 6.2 percent in 2018 to 17.9 percent in 2024,” states Sebastian Menutti, Industry Director, Customer Experience at Frost & Sullivan.

AeC’s unwavering commitment to customer experience strengthens its position in the market. By combining advanced analytics with a human-centered delivery model, the company enhances agility, ensures cost efficiency, and consistently delivers high levels of customer satisfaction. Its ability to serve both traditional enterprises and digital-native companies—now representing a significant portion of its revenue—demonstrates its adaptability and market relevance.
“Receiving this recognition for the fifth consecutive year is a source of great pride and a clear signal of the consistency behind our journey. It highlights our belief that technology, when combined with human warmth, is what truly transforms customer experience at scale.” Said Raphael Duailibi, CEO at AeC.”

Frost & Sullivan commends AeC for setting a high standard in competitive strategy, execution, and market responsiveness. The company’s vision, innovation pipeline, and customer-first culture are shaping the future of customer experience management and driving tangible results at scale.

Each year, Frost & Sullivan presents the Company of the Year Recognition to a company that demonstrates outstanding strategy development and implementation, resulting in measurable improvements in market share, customer satisfaction, and competitive positioning. It recognizes forward-thinking organizations that are reshaping their industries through innovation and growth excellence.

Frost & Sullivan Best Practices Recognition

Frost & Sullivan’s Best Practices Recognitions honor companies across regional and global markets that exhibit exceptional achievement and consistent excellence in areas such as leadership, technological innovation, customer experience, and strategic product development. Each recognition is the result of a rigorous analytical process in which Frost & Sullivan industry experts benchmark performance through comprehensive interviews, deep-dive analysis, and extensive secondary research. The goal is to identify true best-in-class organizations that are driving transformative growth and setting new industry standards.

Contact us: Start the discussion.

Contact
comercial@aec.com.br 

Camila Tinajero
E: camila.tinajero@frost.com

About AeC

AeC is Brazil’s leading provider of customer experience (CX) and business process outsourcing (BPO) solutions, distinguished by its consistent growth, innovation, and customer-centric execution. With more than 56,000 employees and nearly 30 operating units across eight states, the company combines advanced technology with a uniquely human approach. AeC serves over 80 clients, including the ten largest contractors in the industry and leading brands across banking, telecommunications, fintech, and digital-native sectors. Recognized by Frost & Sullivan as Company of the Year for the fifth consecutive time, AeC has grown its revenue 3.5x over the past four years, underscoring its ability to translate innovation into sustained value creation for clients while expanding access to first-time employment and driving inclusive growth.

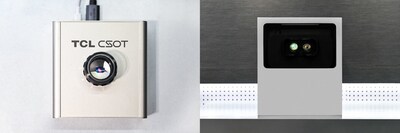
TCL CSOT Showcases APEX Pixel Full-Path Innovation Across Advanced Displays at SID Display Week 2026

LOS ANGELES, May 7, 2026 /PRNewswire/ — TCL CSOT, a global leader in advanced display technologies and a subsidiary of TCL Technology, is introducing its APEX Pixel framework at SID Display Week 2026. Rooted in the APEX philosophy — which transcends specifications to embody premium experiences that resonate with people — APEX Pixel represents a unified path for pixel-level innovation across FMM OLED, Inkjet-printed (IJP OLED), and LCD, underscoring TCL CSOT’s leadership in frontier display technologies and its commitment to continuous innovation.

“Pixel innovation is the cornerstone of display technology. APEX Pixel is driving coordinated breakthroughs across LCD, OLED, and beyond, infusing every pixel with comfort, eye health, sustainability, and a vision for the future,” said Xiaolin Yan, CTO of TCL Technology, CTO of TCL CSOT. “It also continues to push the boundaries of next-generation technologies such as Micro LED, while enabling extraordinary experiences for the AI era through XR displays.”

FMM OLED: Super Pixel Breakthroughs 

TCL CSOT’s Super Pixel mobile displays

TCL CSOT is redefining next-generation FMM OLED performance with Super Pixel technology, which delivers a powerful trifecta of benefits:

  • Higher Clarity: Achieves sharpness comparable to WQHD SPR. By increasing the sub-pixel quantity by approximately 1.8%, it renders images that are more accurate, clear, and finely detailed.
  • Smarter Power Use: Optimized data processing reduces power consumption by up to 25% while maintaining exceptional image quality.
  • Rapid Refresh: Leverages a Real RGB pixel layout that requires less bandwidth than SPR, enabling refresh rates up to 40% higher for smoother motion.

TCL CSOT is showcasing a suite of groundbreaking Super Pixel mobile displays, each designed to push the boundaries of clarity, efficiency, and refresh performance. 

  • World’s First Super Pixel High-Clarity Mobile Display (6.9″): This display delivers an ultra-high 2608×1200 resolution and 420PPI on a 6.9-inch screen, producing razor-sharp text and finely detailed textures. Its ultra-narrow bezels (0.5mm top, 0.8mm sides) create a stunningly immersive, edge-to-edge viewing experience.
  • World’s Lowest-Power Consumption Super Pixel Mobile Display (6.9″): Setting a new benchmark in energy efficiency, this 420PPI display combines Super Pixel density with an 8T LTPO ultra-low-power architecture. It reduces IC power consumption by 10% and SoC power consumption by 25% compared to conventional solutions, extending battery life without compromising its 2000 nit peak brightness.
  • World’s First Super Pixel High Refresh Rate Mobile Display (6.9″): Designed for next-generation gaming, this display features an ultra-fast 165 Hz refresh rate, improving motion smoothness by 40% over 120 Hz panels for tear-free visuals. Its 7T LTPS architecture intelligently adapts between 60–165 Hz to balance performance and power efficiency.

 IJP OLED: Superior Quality with Greater Flexibility 

World’s First Foldable & Portable IJP OLED Monitor Display (28")
World’s First Foldable & Portable IJP OLED Monitor Display (28″)

Building on TCL CSOT’s decade-long leadership in IJP OLED and its construction of the world’s first 8.6-generation IJP OLED production line (t8), the company is showcasing how IJP OLED technology is transforming the industry with significant advantages in manufacturing and performance. TCL CSOT’s pixel innovation in this area delivers:

  • Process Advantages: Reduces reliance on complex vacuum procedures and flexibly adapts to different panel sizes through scalable printhead configurations.
  • Image Quality: Real Stripe RGB pixel arrangement ensures exceptional clarity and true-to-life color accuracy.
  • Power Optimization: By creating larger light-emitting areas (50%–60% of the pixel), the technology improves luminous efficiency and lowers overall power consumption.

TCL CSOT is showcasing this innovation through the World’s First Foldable & Portable IJP OLED Monitor Display (28″). Featuring a revolutionary tri-fold design, it transforms a compact 16-inch device into an expansive 28-inch ultra-wide screen, demonstrating IJP OLED’s unique capability to enable flexible, high-performance designs that expand the boundaries of display applications.

LCD Innovation: Advancing with RGBC Four-Color Technology 

World's Highest Image Quality WHVA Ultra LCD TV Display (85
World’s Highest Image Quality WHVA Ultra LCD TV Display (85″)

TCL CSOT is advancing LCD technology for the large-screen domain by incorporating an innovative four-color (RGBC) pixel array.

  • Expanded Color Gamut & Accuracy: By adding a fourth (Cyan) sub-pixel to the traditional RGB system, the display can directly generate more saturated and realistic colors, significantly expand the color gamut and enhance color accuracy, especially in cyan tones.
  • Enhanced Resolution: The four-color system increases the sub-pixel count and utilizes optimized rendering algorithms to markedly improve resolution, delivering superior performance, especially when rendering high-frequency image details.

This innovation is demonstrated in the World’s Highest Image Quality WHVA Ultra LCD TV Display (85″), featuring a native RGBC four‑color pixel array that achieves 131% of the BT.2020 color gamut. Delivering true four‑color performance at the hardware level, it sets a new benchmark for LCD innovation with exceptionally vivid, natural, and clear images.

By continuously evolving its technology portfolio to meet diverse scenarios, TCL CSOT demonstrates its commitment to setting new standards in display innovation and ensuring that advanced display solutions enrich everyday life for users worldwide.

– End –

About TCL CSOT

Established in 2009, TCL China Star Optoelectronics Technology Co., Ltd. (TCL CSOT) is a leading global innovator in display technologies. Its LCD, OLED, and MLED solutions power applications across TVs, smartphones, tablets, laptops, monitors, automotive systems, VR/XR, and commercial displays. With a clear strategic direction set by its advanced display technology brand APEX, TCL CSOT invests continuously and strategically in R&D, driven by a mission to amaze, protect and inspire all people through endlessly innovative display technology. As part of TCL’s Worldwide Olympic Partnership, TCL CSOT is proud to deliver display solutions that elevate experiences on the global stage.


19.3% Weight Reduction, 16.5 cm Waist Circumference Decrease, SBP/DBP Reductions of 22.9/12.9 mmHg, 70.7 μmol/L Uric Acid Reduction, and 33.6% Triglyceride Reduction: BGM0504 Demonstrates Comprehensive Cardiometabolic Regulation Capabilities

SUZHOU, China, May 7, 2026 /PRNewswire/ — Recently, BrightGene Bio-Medical Technology Co., Ltd. (hereinafter referred to as “BrightGene Bio-Medical ” or “the Company”) announced that its proprietary GLP-1 (glucagon-like peptide-1)/GIP (glucose-dependent insulinotropic polypeptide) dual receptor agonist, BGM0504 injection, has achieved positive topline results from a Phase III clinical trial (CTR20243983/NCT06704581) evaluating its efficacy and safety in participants with overweight or obesity.

Against the backdrop of intensifying global competition in weight management therapeutics and clinical efficacy approaching a plateau, industry focus is gradually shifting from the singular metric of “magnitude of weight loss” toward comprehensive cardiometabolic benefits and population coverage capabilities that offer greater clinical value and real-world translational impact. Consequently, the evaluation framework for weight management drugs is undergoing a fundamental transformation.

Overview of Phase III Clinical Trial Results of BGM0504 Injection in Weight-Reduction

Phase III data for BGM0504 demonstrated that while achieving a mean significant weight reduction of 19.3% and a waist circumference decrease of 16.5 cm, the hypertensive population experienced mean reductions in systolic and diastolic blood pressure of 22.9 mmHg and 12.9 mmHg, respectively, from baseline after 36 weeks of treatment. After 52 weeks of treatment, participants achieved a mean uric acid reduction of 70.7 μmol/L, with total body bone mineral density/lumbar spine bone mineral density/hip bone mineral density increasing by 0.3%, 1.4%, and 3.9%, respectively. Blood lipids, blood glucose, and other cardiometabolic parameters also demonstrated outstanding comprehensive improvement capabilities. Furthermore, while achieving robust efficacy, BGM0504 injection demonstrated exceptional overall tolerability, with the high-dose group showing a discontinuation rate of only 0.7%.

Against the backdrop of simultaneous improvements in weight reduction, waist circumference, blood pressure, uric acid, bone mineral density, and multiple metabolic parameters, BGM0504 has evolved beyond the attributes of a singular weight management tool to embody comprehensive cardiometabolic regulation capabilities oriented toward long-term chronic disease management.

19.3% Weight Reduction and 16.5 cm Waist Circumference Decrease: Exceptional Weight and Fat Loss Capabilities Demonstrated Simultaneously

As weight reduction enters a plateau phase, competition is shifting toward overall capabilities, with weight loss magnitude alone no longer sufficient to create significant differentiation. BGM0504 achieved a 19.3% weight reduction over a 52-week treatment period, positioning it at the upper end of the topline range for global dual-target mechanisms.

Cross-dose comparisons reveal that BGM0504 demonstrates significant leadership over competing products at the low-dose level, maintains its advantage at the mid-dose level, and reaches the upper limit of the industry range at the high-dose level. BGM0504 exhibits a clear efficacy signal at the low dose (5 mg), with further enhancement at higher doses while maintaining relatively stable tolerability. This characteristic of “low-dose efficacy with dose-dependent enhancement” represents a meaningful point of differentiation among current competing products. In contrast, some competing products rely more heavily on mid-to-high doses to demonstrate efficacy, with relatively limited performance and disclosure at low-dose levels.

This characteristic holds multiple implications for clinical practice. On one hand, the ability to produce substantial weight reduction at low doses helps build patient confidence early in treatment and reduces reliance on rapid dose escalation, thereby achieving a better balance between efficacy and tolerability. On the other hand, it enables potential application to a broader patient population. For example, in individuals who have not yet reached severe obesity criteria but have developed metabolic abnormalities or weight-related risks, low-dose intervention may serve as a more gentle initial therapeutic approach.

Evaluating a weight management drug requires looking beyond weight reduction data to assess comprehensive outcomes, particularly changes in body shape. Waist circumference reduction reflects visceral fat loss and body shape transformation, addressing the core needs of most individuals seeking weight loss. Beyond body weight, waist circumference—a key indicator of visceral fat—also demonstrated superior results, with participants in the 15 mg dose group achieving a reduction of 16.5 cm, significantly outperforming competing products.

Change in Waist Circumference from Baseline (cm) Phase 3 (TRE)

This result indicates that its efficacy has extended from “weight change” to “risk profile improvement.” Consequently, BGM0504 not only ranks in the top tier for magnitude of weight reduction, but also demonstrates advantages of earlier onset, greater waist circumference reduction, and more superior efficacy in fat distribution, a dimension that is closer to the essence of the disease.

In the dimension of “who can help more people lose weight,” BGM0504’s advantage is even more pronounced. The proportion of participants achieving ≥5% weight loss from baseline reached 84.7%, 89.8%, and 94.6% in the 5 mg, 10 mg, and 15 mg dose groups, respectively.

Summary of Primary Efficacy Endpoints: Body Weight Reductions in Phase 3 (TRE) Trials

In the more clinically meaningful deep weight loss ranges (≥15%, ≥20%), this advantage is further amplified. In the 15 mg group, 67.3% of participants achieved ≥15% weight loss, and 48.9% achieved ≥20% weight loss—nearly half of patients achieving deep weight loss, approaching the intervention range of bariatric surgery. This indicates that its clinical value is extending from “weight management” to “metabolic state remodeling.”

Overall, BGM0504’s core competitive advantage has shifted from “how much weight is lost” to “how much waist circumference is reduced,” and ultimately to “enabling more people to achieve stable weight loss and enter the deep weight loss range.” As the industry transitions from “single-point magnitude competition” to “population-level efficacy and real-world translation,” the comprehensive advantages demonstrated by BGM0504 are emerging as the new competitive differentiator.

SBP/DBP Reductions of 22.9/12.9 mmHg with 92.9% Target Achievement Rate, Demonstrating Antihypertensive Intervention Potential

Beyond weight reduction and waist circumference, blood pressure changes represent another noteworthy dimension in this dataset. Lilly’s tirzepatide and Novo Nordisk’s semaglutide did not fully investigate this population in their Phase III trials. The enrollment design itself reflects a higher level of clinical ambition. On one hand, over 60% of individuals with obesity have comorbid hypertension; the study’s inclusion of patients with comorbid hypertension makes the results more aligned with the common real-world clinical scenario of “obesity + hypertension.” On the other hand, the disclosure not only reports the magnitude of blood pressure reduction but also presents the blood pressure target achievement rate, elevating blood pressure from merely a “concomitant improvement” to a parameter with complete evaluative information.

In the population with comorbid hypertension and uncontrolled blood pressure, mean systolic blood pressure decreased by 22.9 mmHg and diastolic blood pressure by 12.9 mmHg, with 92.9% of patients achieving target blood pressure. In contrast, previous studies of similar drugs have predominantly presented blood pressure outcomes as trend changes, with relatively limited systematic disclosure of target achievement rates. Therefore, these results provide a complementary perspective in terms of data completeness.

In clinical practice, monotherapy with a single antihypertensive agent (ACEI [angiotensin-converting enzyme inhibitor, such as captopril]/ARB [angiotensin II receptor blocker, such as valsartan]/CCB [dihydropyridine calcium channel blocker, such as nifedipine]/diuretic [such as hydrochlorothiazide]) typically achieves only approximately 8–12 mmHg reduction in systolic blood pressure. Reductions exceeding 20 mmHg often require multi-mechanism combination therapy. It is important to note that this change was observed in the more challenging population of individuals with obesity and comorbid hypertension, who typically present with insulin resistance and multiple metabolic abnormalities, making blood pressure control relatively more difficult. Therefore, the simultaneous observation of improvements in both body weight and blood pressure in this population holds meaningful clinical reference value.

BGM0504: Antihypertensive Efficacy vs. Clinical Standard Treatment Pathway

Dimension

Conventional Antihypertensive Drugs

BGM0504

Monotherapy

Approximately 8–
12mmHg

Significantly exceeds the
monotherapy range

Dual combination

Approximately

15–25mmHg

Systolic blood pressure
reduction near the upper limit
of the range

Triple combination

Approximately 20–
30mmHg

Systolic blood pressure
reduction within the range

Blood pressure
control rate

Widely used variable
across clinical trials, core
evaluation endpoint

92.9%(very high)

Treatment pathway

Long-term combined
medication generally
required for sustained
blood pressure control

via a non-classical
antihypertensive pathway

From a broader chronic disease management perspective, hypertension and diabetes are highly comorbid in clinical practice and jointly contribute to the development and progression of cardiovascular and cerebrovascular events. According to guideline stratification, hypertensive patients with comorbid diabetes are often directly classified into higher risk categories, requiring more stringent blood pressure control targets and more urgent intervention. In this context, if metabolic intervention can simultaneously impact body weight, blood pressure, and glycemic parameters, it may produce synergistic effects on multiple metabolic abnormalities at early stages of risk. This characteristic makes the application value of these data in the continuum of “obesity—hypertension—glycometabolic abnormalities” worthy of further attention.

Blood Pressure Classification and Hypertension Grading

Based on Office Blood Pressure (mmHg)

Classification

Systolic

Blood Pressure

Diastolic

Blood Pressure

Normal

Blood Pressure

<120

AND

<80

High-Normal

Blood Pressure

120~139

AND/OR

80~89

Hypertension

≥140

AND/OR

≥90

Grade 1

       Hypertension (Mild)

140~159

AND/OR

90~99

Grade 2

Hypertension
(Moderate)

160~179

AND/OR

100~109

Grade 3

Hypertension

(Severe)

≥180

AND/OR

≥110

Isolated Systolic

Hypertension

≥140

AND

<90

Isolated Diastolic

Hypertension

<140

AND

≥90

Note: When systolic and diastolic blood pressure fall into different grades, the higher grade should be used.


Cardiovascular Risk Stratification

Cardiovascular Risk Factors and
Medical History

Blood Pressure(mmHg)

SBP 130-139
and/or

DBP 85-89

SBP 140-159
and/or

DBP 90-99

SBP 160-179
and/or

DBP 100-109

SBP ≥180 and/or

DBP ≥110

NONE

Low risk

Low risk

Medium risk

High risk

1-2 other risk factors

Low risk

Medium risk

Medium-High risk

Very High risk

≥3 other risk factors, target organ
damage, CKD Stage 3, or diabetes
without complications

Medium-High risk

High risk

High risk

Very High risk

Clinical complications, CKD Stage≥4,
or diabetes with complications

High-Very High risk

Very High risk

Very High risk

Very High risk

Note: CKD = Chronic Kidney Disease

Source: Chinese Guidelines for the Prevention and Treatment of High Blood Pressure (2024 Edition)


Additionally, its safety profile is equally noteworthy. Despite the substantial magnitude of blood pressure reduction, no hypotensive events were observed during the study, suggesting that the blood pressure changes occurred in a generally stable manner. From a mechanistic perspective, this result more closely resembles comprehensive changes driven by metabolic improvement rather than a singular antihypertensive pathway.

Therefore, against the backdrop of synergistic changes in weight reduction, blood pressure, and multiple metabolic parameters, BGM0504 demonstrates not only improvement in individual indicators but also coordinated effects across multiple metabolic risk factors. This characteristic provides a new observational dimension for its potential application in metabolism-related risk management.

Uric Acid Reduction of 70.7 μmol/L, Demonstrating Potential Gout Benefit Capability

Beyond blood pressure, other metabolic parameters such as uric acid also demonstrated consistent improvement trends.

Change in Uric Acid from Baseline (μmol/L)

Uric acid, a metabolic parameter closely associated with gout, also demonstrated clinically meaningful improvement signals. Data showed that BGM0504 treatment resulted in a mean uric acid reduction of approximately 70.7 μmol/L, a magnitude that has entered the intervention range of clinical therapeutics. In the treatment of hyperuricemia, conventional urate-lowering therapies (such as the xanthine oxidase inhibitor febuxostat and the uricosuric agent benzbromarone) typically achieve reductions of approximately 60–120 μmol/L.

Uric Acid Reduction Range by Intervention Pathway (μmol/L)

Intervention Type

Representative Drugs /
Approaches

Uric acid change

Metabolic intervention

BGM0504

-70.7μmol/L

Uric acid synthesis
inhibition

Febuxostat, Allopurinol

-60~-120μmol/L

Uric acid excretion
promotion

Benzbromarone

-60~-100μmol/L

Note: Uric acid-lowering drugs are indicated for the treatment of hyperuricemia and gout. BGM0504 acts via a metabolic intervention pathway with different indications. The data are for magnitude reference only and do not constitute a therapeutic efficacy comparison.

Generally, a reduction of approximately 60 μmol/L in uric acid can significantly decrease the risk of gout attacks. Therefore, this result indicates that its effect extends beyond metabolic parameter improvement and may translate into intervention potential for gout risk.

Furthermore, compared to tirzepatide (SURMOUNT-1 study), BGM0504 demonstrated stronger and more balanced improvement trends across multiple core lipid parameters.

For triglycerides, BGM0504 achieved a reduction of approximately 33.6%, significantly superior to tirzepatide’s 24.8%, with a gap of nearly 9 percentage points. This has entered the 20%–50% range of action typical of traditional lipid-lowering agents, demonstrating an intervention intensity comparable to standard lipid-lowering agents. Additionally, low-density lipoprotein cholesterol decreased by approximately 12.7%, superior to tirzepatide’s 5.8% reduction, while total cholesterol decreased by approximately 7.4%, exceeding tirzepatide’s 4.8%. Based on rough calculations of the LDL-C/HDL-C ratio, this atherosclerosis-related ratio decreased by approximately 18.6% following BGM0504 treatment, suggesting that it does not merely lower a single lipid parameter, but rather reduces “bad cholesterol” while elevating “good cholesterol,” thereby driving overall improvement in lipid risk profile.

Change in Blood Lipids from Baseline (%)

As an important extension of the metabolic system, bone metabolism is highly coupled with glucose and lipid metabolism as well as energy balance. At the bone metabolism level, after 52 weeks of treatment, participants across all dose groups (pooled 5 mg/10 mg/15 mg) achieved relative increases from baseline of 0.3% in total body bone mineral density (BMD), 1.4% in lumbar spine BMD, and 3.9% in hip BMD. In previous studies, weight loss is often accompanied by changes in bone mineral density. Relevant phenomena have also been observed for certain GLP‑1 receptor agonists such as semaglutide across multiple trials, and such changes are generally attributed to reduced skeletal loading following body weight reduction. Notably, in the Phase III clinical program of BGM0504, significant weight loss was accompanied by no declining trend in BMD; instead, consistent increases in bone mineral density were achieved.

Body weight, blood pressure, uric acid, blood lipids, blood glucose and bone mineral density are no longer discrete endpoint indicators, but integrated into a continuous metabolic regulatory cascade. Mechanistically, BGM0504 does not merely regulate a single individual parameter; rather, it drives holistic remodeling of the metabolic system.

Discontinuation Rate as Low as 0.7%, Corresponding to Higher Patient Retention and Long-Term Adherence

In the context of outstanding efficacy performance, safety becomes one of the critical factors in product evaluation. Across different dose levels of BGM0504, treatment discontinuation due to adverse events (AEs) can more directly reflect the drug’s sustainable use capability in real-world settings.

Comparison of Treatment Discontinuation Due to AE Across Different Dose Groups

Group

BGM0504

Tirzepatide

Mazdutide

HRS9531

Low-dose

1.7 %

1.5 %

4.3 %

2.9 %

Mid-dose

1.2 %

0.5 %

7.1 %

1.1 %

High-dose

0.7 %

6.2 %

7.0 %

6.2 %

At the high-dose level, BGM0504 maintained a discontinuation rate of approximately 0.7%, which not only did not increase with dose escalation but remained at a lower level, significantly below competing products by several-fold.

Unlike most products where discontinuation rates increase with dose escalation, BGM0504 actually demonstrated further reduction at the high-dose level, exhibiting the rare characteristic of “dose-independent discontinuation.”

Further dissection of the data structure reveals that the differentiation is reflected not only in magnitude but also in result consistency. In the full analysis set (FAS) and per-protocol set (PPS), the 15 mg group achieved weight reductions of 19.2% and 19.3%, respectively, while the 5 mg and 10 mg groups also demonstrated comparable results of 14.3%/14.6% and 17.3%/16.9%, respectively. This indicates that weight reduction effects are more evenly distributed across the study population, with the majority of patients achieving clear improvement.

A discontinuation rate of approximately 0.7%, combined with comparable results between the full analysis set (FAS) and per-protocol set (PPS), suggests that efficacy can be demonstrated relatively consistently across different populations and implementation conditions. This characteristic reflects, on one hand, favorable overall tolerability that helps maintain treatment continuity; on the other hand, it indicates relatively even distribution of efficacy, with results not dependent on a small subset of high-responder individuals. Its value is no longer reflected solely in magnitude of efficacy, but also in how many patients can sustain use and achieve stable outcomes.

From an overall data structure perspective, the value demonstrated by BGM0504 is no longer confined to singular weight reduction magnitude. The approximately 19.3% weight reduction positions it at the current mainstream upper limit for GLP-1 class medications, while in the dimensions of population coverage and deep weight loss, it further embodies the characteristic of “enabling more patients to achieve stable weight reduction outcomes.” Concurrently, the blood pressure changes observed in the population with comorbid hypertension place its antihypertensive magnitude within the range of common clinical therapeutic interventions. Further layered with simultaneous improvements in multiple parameters including blood lipids and uric acid, its action has extended from singular weight management to synergistic changes across multidimensional metabolic parameters.

The term cardiometabolic generally refers to a cluster of interrelated risk factors including body weight, blood pressure, blood lipids and blood glucose. Clinically, these factors rarely exist in isolation; instead, they collectively contribute to the onset and progression of cardiovascular and cerebrovascular diseases.

Cardiometabolic diseases (CMDs) represent an umbrella term for this interconnected spectrum of disorders. They encompass metabolic conditions such as obesity, type 2 diabetes and dyslipidemia, as well as cardiovascular complications including hypertension, ischemic heart disease (IHD), heart failure (HF), and peripheral vascular diseases. Recognized as the leading cause of death worldwide, CMDs are fundamentally driven by cardiovascular damage resulting from metabolic abnormalities.

Within this framework, the focus of disease management has gradually shifted from single indicator control to the synergistic improvement of multiple metabolic parameters. Against the backdrop that global pharmaceutical companies widely adopt the cardiometabolic framework to define metabolism-related disorders, such clinical data imply more than a simple expansion of indication scope. It embodies an evolving therapeutic paradigm: modulating multiple cardiometabolic risk factors through a single pharmacological mechanism.

In this context, BGM0504 delivers not only enhanced weight loss efficacy, but also distinctive synergistic improvements across multiple cardiometabolic dimensions, including blood pressure, glucose metabolism, lipid metabolism and uric acid levels. This profile suggests its potential value extends beyond standalone weight management to the comprehensive intervention of multiple metabolic risk factors. It offers a promising perspective for the multidimensional clinical management of cardiometabolic diseases.

TCL CSOT Highlights APEX-Powered Display Innovations for Next-Gen Applications at SID Display Week 2026

Guided by its APEX philosophy, TCL CSOT extends its vision through APEX Pixel, delivering immersive, efficient, and eye‑friendly display experiences across home entertainment, mobile communication, smart mobility, and personal immersion.

LOS ANGELES, May 7, 2026 /PRNewswire/ — TCL CSOT, a global leader in advanced display technologies and a subsidiary of TCL Technology, today presented its forward‑looking vision for the display industry at SID Display Week 2026. Anchored in its APEX philosophy, this vision is expressed through the APEX Pixel framework, which delivers pixel‑level breakthroughs across FMM OLED, IJP OLED, LCD, and other advanced display technologies. At the event, TCL CSOT showcases how these innovations are shaping the next generation of experiences in home entertainment, smart mobility, mobile communication, and immersive experience.

“APEX is more than a benchmark in display technology. It is a bridge connecting us with consumers worldwide,” said Jun Zhao, SVP of TCL Technology and CEO of TCL CSOT. “Through APEX-led, full-stack innovation, TCL CSOT is making ‘Display the Future’ accessible in the era of Al across every aspect of everyday life. This year, our IJP OLED solutions will also debut in the mid-size segment.”

The APEX Philosophy: A Human‑Centric Vision for Displays

APEX is TCL CSOT’s systematic answer to what defines a truly great display. It is built on four pillars that guide research and development to ensure every innovation delivers meaningful, human-centric benefits:

  • Amazing Display Experience – Elevating immersion, fluidity, and vivid color performance across scenarios, from mobile screens to the large-format displays.
  • Protective of Eye Health – Integrating natural light technologies and visual science to balance stunning picture quality with long‑term visual comfort.
  • Eco‑Friendly to Build and Use – Embedding eco‑friendly principles into development, with low‑power OLED and energy‑efficient LCD solutions that reduce consumption while maintaining premium performance.
  • X‑Unlimited Imaginative Potential – Exploring future possibilities with AI-driven holographic displays, Micro LED, and XR applications that expand the boundaries of interaction and creativity.

Bringing the APEX Vision to Life Across Everyday Scenarios

At SID Display Week 2026, TCL CSOT demonstrated how its APEX philosophy — embodied in the APEX Pixel framework — is applied to enhance key aspects of modern life.

Home Entertainment Scenario

TCL CSOT’s largest and most lifelike LCD breakthroughs redefine home cinema experiences

Bringing the “Amazing Display Experience” pillar to the living room, the World’s Largest HVA Ultra TV Display (130″) breaks traditional LCD size boundaries and redefines large-format design with an ultra-slim 29.8 mm profile. Meanwhile, the World’s Highest Image Quality WHVA Ultra LCD TV Display (85″) uses a native RGBC four-color pixel arrangement. This APEX-driven innovation delivers color reproduction that is more lifelike and natural, creating a deeply immersive home cinema experience for the whole family.

Smart Mobility Scenario

Intelligent Cockpit Display Suite 3.0 – World's First IJP OLED Sliding Central Control Display (28
Intelligent Cockpit Display Suite 3.0 – World’s First IJP OLED Sliding Central Control Display (28″; left) and World’s First IJP OLED Curved Armrest Display (28″; right)

The APEX vision for a seamless, integrated user experience extends into the vehicle with the Intelligent Cockpit Display Suite 3.0. Its centerpieces — the World’s First IJP OLED Sliding Central Control Display (28″), a dynamic sliding control screen, and the World’s First IJP OLED Curved Armrest Display (28″), a sculpted curved armrest screen — showcase how the flexibility of IJP OLED technology can create a more intuitive, integrated, and seamless “third living space.”

Daily and Business Scenario

TCL CSOT’s Super Pixel and IJP OLED displays enhance communication and elevate productivity everywhere

To meet the evolving demands of modern mobile communication, TCL CSOT’s APEX-driven solutions prioritize performance and flexibility, with Super Pixel technology delivering mobile displays with Higher Clarity, Smarter Power Use, and Rapid Refresh.

For hybrid work, the World’s First Foldable & Portable IJP OLED Monitor Display (28″) brings IJP OLED technology into a highly versatile design, transforming from a compact device into an expansive ultra-wide screen that empowers productivity anywhere.

Immersive Entertainment Scenario

TCL CSOT’s XR breakthroughs redefine immersion and elevate next generation personal experiences

Pushing the boundaries of imagination, TCL CSOT’s “X-Unlimited Imaginative Potential” vision for XR is realized in forward-looking concepts. Innovations like the World’s Highest PPI Single-Chip Full-Color Si-Micro LED Display (0.28″) and the World’s Highest 1700PPI Real RGB G-OLED Display (2.24″) offer a glimpse into a future of deeply personal and interactive entertainment, made possible by the pioneering spirit of APEX.

– End –

About TCL CSOT

Established in 2009, TCL China Star Optoelectronics Technology Co., Ltd. (TCL CSOT) is a leading global innovator in display technologies. Its LCD, OLED, and MLED solutions power applications across TVs, smartphones, tablets, laptops, monitors, automotive systems, VR/XR, and commercial displays. With a clear strategic direction set by its advanced display technology brand APEX, TCL CSOT invests continuously and strategically in R&D, driven by a mission to amaze, protect and inspire all people through endlessly innovative display technology. As part of TCL’s Worldwide Olympic Partnership, TCL CSOT is proud to deliver display solutions that elevate experiences on the global stage.