Home Blog Page 594

Reimagining Capital: Inside BizPal Day 2026 and the Launch of CapitalOS


JOHOR, MALAYSIA – Media OutReach Newswire – 24 April 2026 – BizPal Malaysia hosted BizPal Day 2026, an invite-only event bringing together investors, SME founders, and ecosystem partners in Johor, where the company formally introduced CapitalOS, its corporate finance platform, and signed Memoranda of Understanding (MOUs) with Malaysian partners My Education Platform and VA Partners.

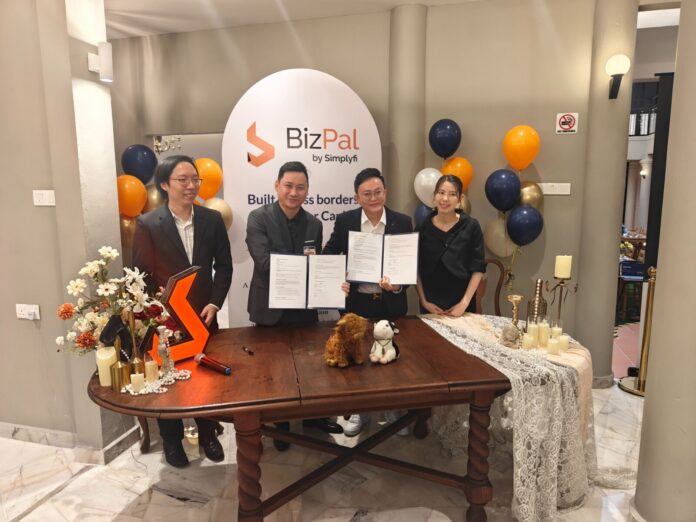
Attendees of BizPal Day 2026 gather in Johor, Malaysia, bringing together investors, SME founders, and ecosystem partners for the official introduction of CapitalOS, BizPal’s corporate finance platform.

Held at deMori @ FCC Signature, the event featured a live platform demonstration, partner showcase, and networking sessions aimed at facilitating engagement between founders, advisors, and investors.

Introducing CapitalOS

CapitalOS, BizPal’s corporate finance platform, was presented through a live demonstration during the event. The system integrates operational, brand, and financial data into a structured framework designed to support investor readiness and due diligence.

According to BizPal, the platform is intended to help SMEs organise their business information into formats aligned with investor expectations, enabling clearer communication during fundraising discussions.

“SMEs should never walk into a funding conversation unsure of their numbers,” said Ms. Anya Tan, CEO of BizPal Malaysia.

MOUs Expand Distribution Network

The event also included the signing of Memoranda of Understanding between BizPal and two Malaysian partners, My Education Platform and VA Partners. Both organisations will serve as authorised distributors of BizPal’s education and advisory programmes across Malaysia.

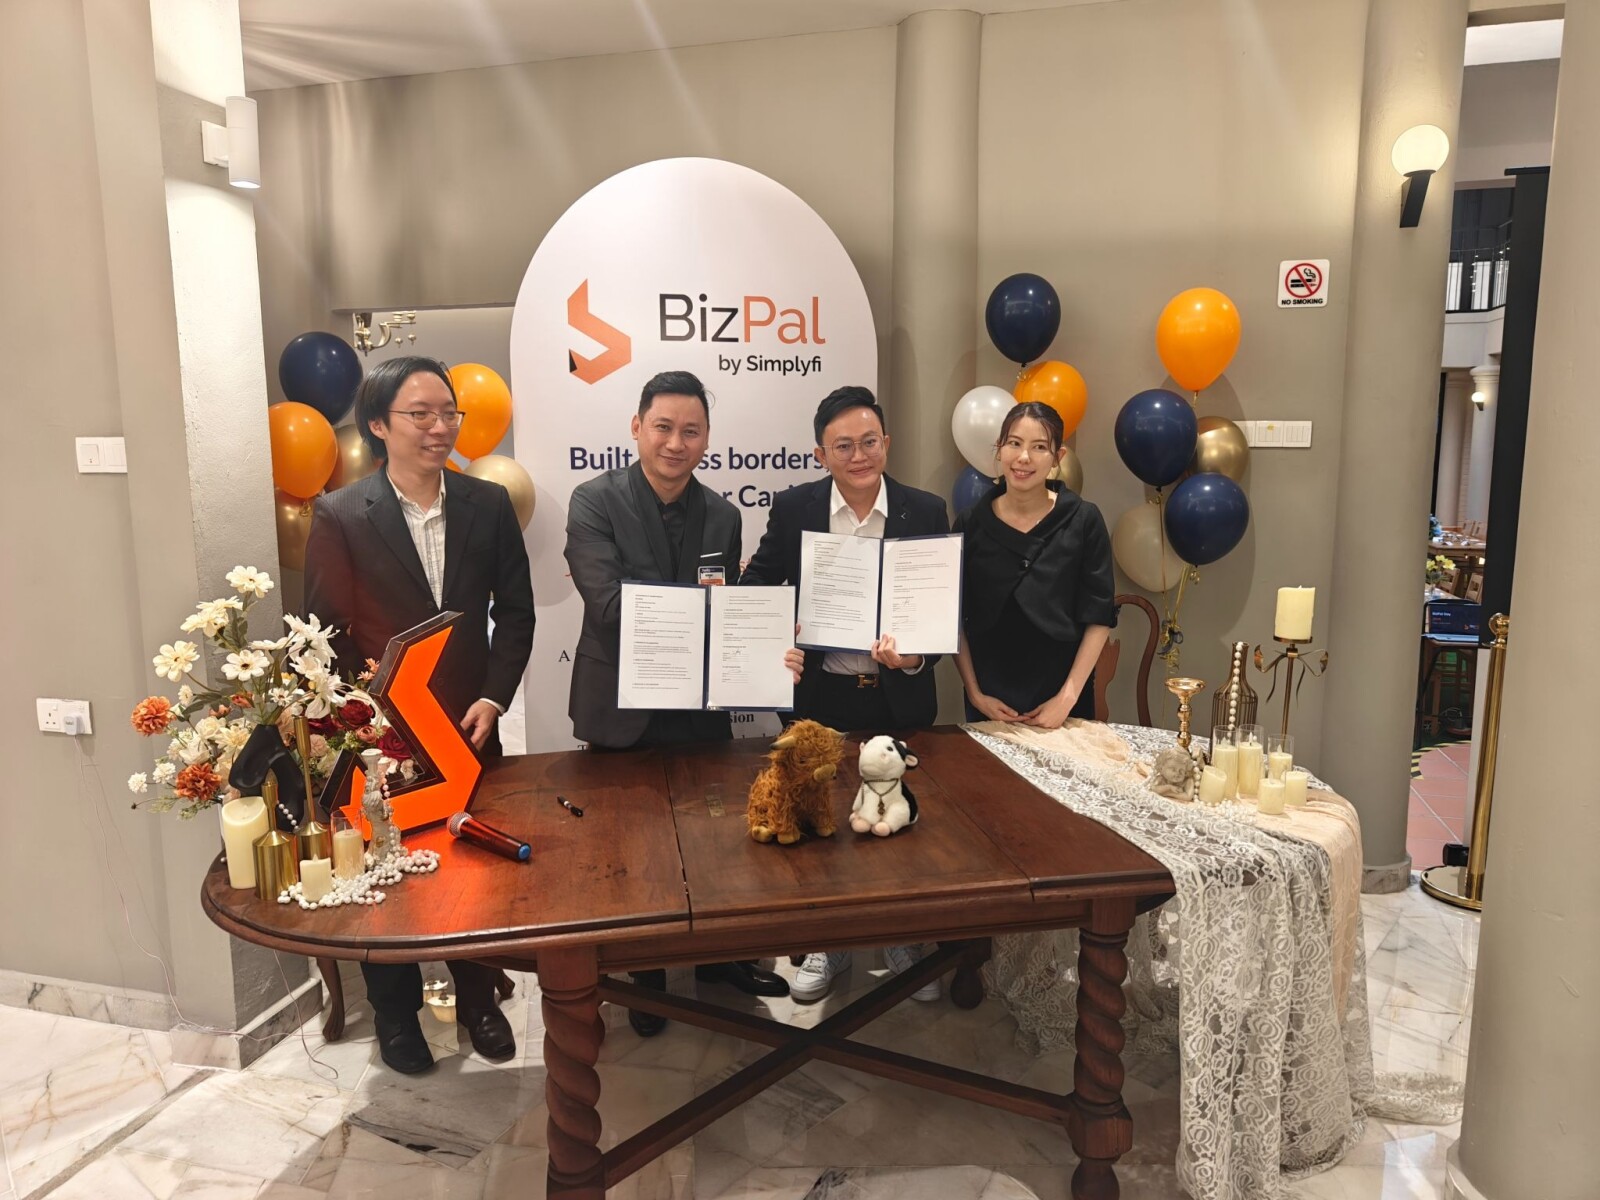
Representatives from BizPal and My Education Platform formalise their collaboration through a Memorandum of Understanding (MOU), expanding BizPal’s distribution network across Malaysia.

The partnerships expand BizPal’s reach within the SME ecosystem by working with local organisations that support business development and capability building.

“Partnering with BizPal allows us to introduce structured, investor-ready methodologies to the SME community we serve,” said Mr. Jeff Lee, Director, My Education Platform.

A representative from VA Partners is expected to provide a statement following final endorsement.

Global Mentorship Exchange (GMX)

During the event, BizPal also presented the Global Mentorship Exchange (GMX), an ecosystem initiative designed to connect experienced business leaders with high-potential entrepreneurs.

The initiative provides a structured environment for mentorship supported by data-based evaluation and standardised assessment criteria aligned with investor expectations. GMX was first introduced during BizPal’s Data Fundraising Masterclass in December 2025 and was presented to a broader network of partners and investors at BizPal Day.

Next Steps

Following the event, BizPal plans to expand the adoption of CapitalOS and continue developing its partner network across Malaysia and the ASEAN region.
Hashtag: #NoDataNoTalk #DataFundraising #InvestorReady #CapitalReadiness #FinTech #BusinessValuation #ASEANSMEs #BizPalDay


The issuer is solely responsible for the content of this announcement.

About BizPal

BizPal provides data-driven corporate finance solutions designed to help ASEAN SMEs become investor-ready. Its platform, CapitalOS, integrates operational, strategic, and financial data into a unified system that supports business evaluation and investor engagement.

Historic Artworks Receive Funding through BofA’s Art Conservation Project™

Spanning 10 countries, the 2026 selections highlight the program’s global commitment to art conservation

Key Points

  • Bank of America is awarding 18 Art Conservation Project™ grants to preserve significant artworks in 2026.
  • This year’s projects include the conservation of internationally renowned masterpieces, such as Rembrandt’s The Night Watch, Picasso’s The Old Guitarist, Matisse’s La Négresse, and Titian’s Bacchus and Ariadne.
  • Previous projects include two copies of Magna Carta at the Society of Antiquaries of London, Claude Monet’s Water Lilies at the Portland Art Museum and Chen Wen Hsi’ Gibbons at the National Gallery Singapore.
  • All conserved artworks will return to public display, reinforcing Bank of America’s commitment to public access. Over 15,000 objects in 40 countries have been conserved through the Bank of America Art Conservation Project™ since 2010.

NEW YORK, April 24, 2026 /PRNewswire/ — Bank of America announced today that 18 nonprofit cultural institutions across 10 countries will receive grants this year through the Bank of America Art Conservation Project™. The selected projects represent a wide range of artistic traditions and conservation needs, from fragile works on paper to paintings and objects requiring advanced preservation techniques.

The Old Guitarist, by Pablo Picasso;© 2026 Estate of Pablo Picasso / Artists Rights Society (ARS), New York / Photo: © The Art Institute of Chicago

This year’s selections were unveiled at the Museum of Modern Art (MoMA) in New York City, which received an Art Conservation Project™ grant in 2019 for the conservation of Vincent van Gogh’s The Starry Night. MoMA is currently hosting a Marcel Duchamp exhibition sponsored by BofA.

“Every artwork has its own story – which is sometimes hidden beneath varnish, cracked pigment or centuries of decay,” said Brian Siegel, Global Arts, Culture & Heritage Executive at Bank of America. “Conservation is the quiet work that brings those stories forward today and for future generations. What stands out about this year’s projects is the variety of techniques involved. Some require meticulous surface cleaning, and in others, conservators will use imaging tools that didn’t exist even a decade ago. Regardless of the method, the goal is simple: to ensure these works remain visible, accessible and enjoyed by visitors for years to come.”

All conserved works will return to public display, reinforcing BofA’s commitment to public access. Since 2010, the Bank of America Art Conservation Project™ has supported over 15,000 conservation projects in 40 countries, helping safeguard historically and culturally significant works that are vulnerable to time and environmental stress.

This year’s projects include:

  • 13 lobby murals at the Apollo Theater in New York
  • The Palms of the Arc de Triomphe at the Centre des Monuments Nationaux in Paris
  • The Judgement of Paris by Jacob de Backer at the Chhatrapati Shivaji Maharaj Vastu Sangrahalaya (CSMVS) in Mumbai
  • Transfiguration by Camillo Procaccini at Duomo di Milano in Milan
  • Four seventeenth-century tapestries by Raphael de la Planche at the Isabella Stewart Gardner Museum in Boston
  • More than 3,100 artworks at La Casa del Libro Museum in San Juan
  • The Meeting of Dante and Virgil by Francesco Salviati, under the direction of Jan Rost, at the Minneapolis Institute of Art
  • Juggler by Alice Rahon at the Montreal Museum of Fine Arts
  • 52 paintings by Francisco Laso de los Ríos at Museo de Arte de Lima
  • Baltazar de Borba Gato delivering the first shipment of gold from Brazil to the King of Portugal and José Bonifácio by Aldo Locatelli at Museu Paulista da Universidade de Sao Paulo
  • La Négresse by Henri Matisse at the National Gallery of Art in Washington, D.C.
  • The Night Watch by Rembrandt van Rijn at Rijksmuseum in Amsterdam
  • Shadow Over the Land by Benny Andrews at the San José Museum of Art
  • The Four Accomplishments and Immortal by Kano Sōgen Shigenobu at the Seattle Art Museum
  • The Old Guitarist by Pablo Picasso at the Art Institute of Chicago
  • With Liberty and Justice for All (A Work in Progress) by Jim Hodges at The Contemporary Austin
  • Bacchus and Ariadne by Titian at the National Gallery in London
  • Gaki Zōshi (Scroll of Hungry Ghosts) at the Tokyo National Museum

A brochure with additional information about selected projects is available here.

Bank of America

Bank of America is one of the world’s leading financial institutions, serving individual consumers, small and middle-market businesses and large corporations with a full range of banking, investing, asset management and other financial and risk management products and services. The company provides unmatched convenience in the United States, serving nearly 70 million clients with approximately 3,500 retail financial centers, approximately 15,000 ATMs (automated teller machines) and award-winning digital banking with approximately 59 million verified digital users. Bank of America is a global leader in wealth management, corporate and investment banking and trading across a broad range of asset classes, serving corporations, governments, institutions and individuals around the world. Bank of America offers industry leading support to approximately 4 million small business households through a suite of innovative, easy-to-use online products and services. The company serves clients through operations across the United States, its territories and more than 35 countries. Bank of America Corporation stock (NYSE: BAC) is listed on the New York Stock Exchange.

At Bank of America, we believe that investing in the arts has a positive impact on our lives. We support a wide range of nonprofit organizations with funding and programming to help make the arts more accessible to communities around the world and to preserve works of art and heritage sites for generations to come.  For more information about how we support the arts, please visit our Bank of America arts website.

For more Bank of America news, including dividend announcements and other important information, visit the Bank of America newsroom and register for news email alerts.

Reporters may contact

AnnMarie McDonald, Bank of America   
Phone: 1.332.234.8635
annmarie.mcdonald@bofa.com


Craft Irish Whiskey’s The Donn Named Best Single Malt In The World 2026 at the London Spirits Competition

DUBLIN, April 24, 2026 /PRNewswire/ — The Donn by Craft Irish Whiskey has been named Single Malt Whiskey of the Year at the 2026 London Spirits Competition, scoring 96 points and receiving Double Gold.

The Donn by Craft Irish Whiskey

At just 6.9 years old, The Donn has now achieved three consecutive “Best Whiskey in the World” titles across London (2026), Asia (2025) and USA Spirits Ratings (2024), outperforming significantly older competitors and challenging one of the industry’s oldest assumptions: that age defines quality.

Instead, The Donn is built through a progressive cask journey designed to maximise flavour at every stage of maturation. Beginning in ex-bourbon, the whiskey is then moved through a carefully orchestrated sequence of casks, including Tawny Port, deep-stave toasted virgin Hungarian oak, and multiple styles of Pedro Ximénez sherry. Each transition is deliberate, introducing new layers of sweetness, structure, spice and depth.

This is further enhanced through varying barrel sizes and controlled underfilling techniques, increasing oxygen interaction and altering the wood-to-spirit ratio to accelerate complexity and integration, a level of precision rarely applied in traditional whiskey making.

“This is a whiskey I’ve guided from the moment it was distilled to the day it was bottled,” said Jay Bradley, Founder and Master Blender. “Every cask, every fill level, every decision was made to shape flavour, not follow convention. To see it recognised three years in a row at this level is validation of that philosophy.”

The London Spirits Competition is judged by leading global spirits experts, including master blenders and senior buyers from Bacardi, Diageo and Pernod Ricard, assessing entries on quality, value, and real-world consumer appeal.

About Craft Irish Whiskey

Craft Irish Whiskey is redefining premium Irish whiskey through a focus on flavour-driven maturation rather than age statements. Combining traditional distilling heritage with modern, data-led techniques, the company produces some of the most awarded and sought-after Irish whiskeys globally. Its innovative approach includes varying cask sizes, unique wood selection, and tailored maturation processes to capture each whiskey at its optimal flavour peak.

Press Enquiries

Craft Irish Whiskey
Email: press@craftirishwhiskey.com
Phone: 020 8077 3632
Website: craftirishwhiskey.com

Xiao-I Corporation Announces Plan to Implement ADS Ratio Change

SHANGHAI, April 24, 2026 /PRNewswire/ — Xiao-I Corporation (“Xiao-I” or the “Company”) (NASDAQ: AIXI), a leading artificial intelligence company, today announced that it plans to change the ratio of its American Depositary Shares (the “ADSs”) to its ordinary shares (the “ADS Ratio”), par value US$0.00005 per share, from the current ADS Ratio of one ADS to one-third of an ordinary share to a new ADS Ratio of one ADS to 60 ordinary shares.

For the Company’s ADS holders, the change in the ADS Ratio will have the same effect as a one-for-twenty reverse ADS split. The Company anticipates that the change in the ADS Ratio will be effective on or about May 11, 2026 (U.S. Eastern Time) (the “Effective Date”).

On the Effective Date, Holders of uncertificated ADSs in The Depository Trust Company (DTC) will have their ADSs automatically exchanged and need not take any action. The exchange of every twenty (20) then-held (existing) ADSs for one (1) new ADS will occur automatically at the Effective Date, with the then-held ADSs being cancelled and new ADSs being issued by Citibank, N.A., the depositary bank (the “Depositary”). The Company’s ADSs will continue to be traded on the Nasdaq Stock Market under the symbol “AIXI.”

No fractional new ADSs will be issued in connection with the change in the ADS Ratio. Instead, fractional entitlements to new ADSs will be aggregated and sold by the Depositary and the net cash proceeds from the sale of the fractional ADS entitlements (after deduction of fees, taxes and expenses) will be distributed to the applicable ADS holders by the Depositary. The change in the ADS Ratio will have no impact on the Company’s underlying ordinary shares, and no ordinary shares will be issued or cancelled in connection with the change in the ADS Ratio.

As a result of the change in the ADS Ratio, the ADS trading price is expected to increase proportionally, although the Company can give no assurance that the ADS trading price after the change in the ADS Ratio will be equal to or greater than twenty times the ADS trading price before the change.

About Xiao-I Corporation

Xiao-I Corporation is a leading cognitive intelligence enterprise in China that offers a diverse range of business solutions and services in artificial intelligence, covering natural language processing, voice and image recognition, machine learning, and affective computing. Since its inception in 2001, the Company has developed an extensive portfolio of cognitive intelligence technologies that are highly suitable and have been applied to a wide variety of business cases. Xiao-I powers its cognitive intelligence products and services with its cutting-edge, proprietary AI technologies to enable and promote industrial digitization, intelligent upgrading, and transformation. For more information, please visit: www.xiaoi.com. 

Forward-Looking Statements

This press release contains forward-looking statements as defined by the Private Securities Litigation Reform Act of 1995. Forward-looking statements include statements concerning plans, objectives, goals, strategies, future events or performance, and underlying assumptions and other statements that are other than statements of historical facts. When the Company uses words such as “may,” “will,” “intend,” “should,” “believe,” “expect,” “anticipate,” “project,” “estimate” or similar expressions that do not relate solely to historical matters, it is making forward-looking statements. Forward-looking statements are not guarantees of future performance and involve risks and uncertainties that may cause actual results to differ materially from the Company’s expectations discussed in the forward-looking statements. These statements are subject to uncertainties and risks including, but not limited to, the following: the Company’s ability to achieve its goals and strategies, its future business development, financial condition, and results of operations, product and service demand and acceptance, reputation and brand, the impact of competition and pricing, changes in technology, government regulations, fluctuations in general economic and business conditions in China, and assumptions underlying or related to any of the foregoing and other risks contained in reports filed by the Company with the U.S. Securities and Exchange Commission (“SEC”). For these reasons, among others, investors are cautioned not to place undue reliance upon any forward-looking statements in this press release. Additional factors are discussed in the Company’s filings with the SEC, including under the section entitled “Risk Factors” in its annual report on Form 20-F filed with the SEC on April 30, 2024, as well as its current reports on Form 6-K and other filings, all of which are available for review at www.sec.gov. The Company undertakes no obligation to publicly revise these forward-looking statements to reflect events or circumstances that arise after the date hereof.


Scienjoy Holding Corporation Reports Fiscal Year 2025 Financial Results

BEIJING, April 24, 2026 /PRNewswire/ — Scienjoy Holding Corporation (“Scienjoy”, the “Company”, or “we”) (NASDAQ: SJ), a leader in interactive entertainment in China, today announced its financial results for the year ended December 31, 2025.

Fiscal Year 2025 Operating and Financial Summaries

  • Total revenues decreased to RMB1,241.6 million (US$177.5 million) for the year ended December 31, 2025 from RMB1,363.4 million for the year ended December 31, 2024.
  • Gross profit decreased to RMB227.2 million (US$32.5 million) for the year ended December 31, 2025 from RMB245.4 million for the year ended December 31, 2024.
  • Loss from operations was RMB78.9 million (US$11.3 million) for the year ended December 31, 2025, as compared to an income from operations of RMB40.7 million for the year ended December 31, 2024.
  • Net loss was RMB595.0 million (US$85.1 million) for the year ended December 31, 2025, as compared to a net income of RMB26.7 million for the year ended December 31, 2024.
  • Net loss attributable to the Company’s shareholders was RMB587.1 million (US$84.0 million) for the year ended December 31, 2025, as compared to a net income attributable to the Company’s shareholders of RMB39.7 million for the year ended December 31, 2024.
  • Adjusted net loss attributable to the Company’s shareholders was RMB579.6 million (US$82.9 million) for the year ended December 31, 2025, as compared to adjusted net income attributable to the Company’s shareholders of RMB50.3 million for the year ended December 31, 2024.
  • As of December 31, 2025, the Company had cash and cash equivalent balance of RMB307.7 million (US$44.0 million), which represented an increase of RMB55.1 million from RMB252.5 million as of December 31, 2024.

Note on Net Loss for Fiscal Year 2025

The net loss of RMB595.0 million (US$85.1 million) reported for the year ended December 31, 2025 was primarily driven by several major non-cash accounting items amounting to RMB712.3 million (US$101.9 million) that had no impact on the Company’s cash and liquidity position or its ability to continue as a going concern. These major items include provisions for credit losses, impairment of goodwill and intangible assets.

Mr. Victor He, Chairman and Chief Executive Officer of Scienjoy, commented, “2025 was a year of continued execution and strategic progress for Scienjoy. Our live streaming business, given our recent global expansion, continues to be profitable which demonstrates the resilience of our core operations. At the same time, we are accelerating our AI strategy. Building on our AIGC foundation with AI Vista, we are expanding into agentic AI with AI Vista Live!, which serves both B2C and B2B markets. AI Vista enables real-time, interactive AI performers for consumers while also providing scalable enterprise solutions across multiple industries. Supported by strong underlying financial performance and a solid cash position, we are well positioned for future growth and deliver long-term value to our shareholders.”

Mr. Denny Tang, Chief Financial Officer of Scienjoy, added, “In the fourth quarter of 2025, we conducted a review of our assets and recorded certain non-cash impairment provisions which did not impact our core operations or cash flow. Apart from these accounting effects, we believe our business remains strong, supported by our core operations and continued Average Revenue Per Paying User (ARPPU) growth. Additionally, our cash and cash equivalents increased by 21.8% during the year, reflecting our operationally-driven capability to sustain on-going business operations and support planned expansion. With a healthy balance sheet, we are well positioned to support continued investment in AI innovation and global expansion.”

Fiscal Year 2025 Financial Results

Total revenues decreased to RMB1,241.6 million (US$177.5 million) for the year ended December 31, 2025 from RMB1,363.4 million for the year ended December 31, 2024 primarily caused by a decrease of paying users due to the increasing competitive landscape of China’s mobile live streaming market. Total paying users were 383,695 for the year ended December 31, 2025, compared to 494,652 for the year ended December 31, 2024. 

Cost of revenues decreased to RMB1,014.5 million (US$145.1 million) for the year ended December 31, 2025 from RMB1,117.9 million for the year ended December 31, 2024. The decrease was primarily attributable to a decrease of RMB128.3 million in the Company’s revenue sharing fees, offset by an increase of RMB23.4 million in the Company’s user acquisition costs.

Gross profit decreased to RMB227.2 million (US$32.5 million) for the year ended December 31, 2025 from RMB245.4 million for the year ended December 31, 2024. Gross margins increased to 18.3% for the year ended December 31, 2025 from 18.0% in the year ended December 31, 2024 due to higher average live streaming revenue per paying user (“ARPPU”) during the year ended December 31, 2025, demonstrating the Company’s effectiveness in converting high-quality paying user to its profit growth.

Total operating expenses increased by 49.5% to RMB306.1 million (US$43.8 million) for the year ended December 31, 2025 from RMB204.7 million for the year ended December 31, 2024.

  • Sales and marketing expenses decreased to RMB6.4 million (US$0.9 million) for the year ended December 31, 2025 from RMB7.0 million for the year ended December 31, 2024, primarily attributable fewer sales and marketing activities.
  • General and administrative expenses increased by 16.1% to RMB89.0 million (US$12.7 million) for the year ended December 31, 2025 from RMB76.6 million for the year ended December 31, 2024. The increase was primarily due to an increase of RMB12.4 million in professional consulting fees.
  • Research and development expenses decreased to RMB83.4 million (US$11.9 million) for the year ended December 31, 2025 from RMB90.5 million for the year ended December 31, 2024, due to a decrease of RMB9.0 million in employee salary and welfare and a decrease of RMB1.3 million in share-based compensation, offset by an increase of RMB4.1 million in technical service fee.
  • Provision for credit losses increased by 316.2% to RMB127.3 million (US$18.2 million) for the year ended December 31, 2025 from RMB30.6 million for the year ended December 31, 2024. Given the regulatory and tax policy changes in China for the livestreaming industry starting in the second half of the financial year ended 2025 and increasing credit risk of our third-party virtual currency distributors in the livestreaming industry, we provided additional allowances for credit losses for third-party virtual currency distributors we deem as high risk and with delinquent accounts. As a result, our provision for credit loss increased to RMB127.3 million (US$18.2 million) for the year ended December 31, 2025 from RMB30.6 million for the year ended December 31, 2024. The facts and circumstances of each third-party virtual currency distributors account may require the Company to use substantial judgment in assessing its collectability. The Company will continue to periodically review allowances and make necessary adjustments accordingly.

Loss from operations was RMB78.9 million (US$11.3 million) for the year ended December 31, 2025, as compared to an income from operations of RMB40.7 million for the year ended December 31, 2024.

Change in fair value of investment in marketable security was a loss of RMB29.1 million (US$4.2 million) for the year ended December 31, 2025, as compared to a gain of RMB6.1 million for the year ended December 31, 2024. The change was attributable to the fair value changes in investments in publicly traded companies. 

Investment income increased to RMB8.7 million (US$1.2 million) for the year ended December 31, 2025, as compared to investment loss of RMB5.7 million for the year ended December 31, 2024. The increase in investment income was attributable to share of unrealized gain in long-term investments. 

Impairment of long-term investments was nil for the year ended December 31, 2025, as compared to RMB10.4 million for the year ended December 31, 2024.

Interest income decreased to RMB1.7 million (US$0.2 million) for the year ended December 31, 2025 from RMB3.2 million for the year ended December 31, 2024. The decrease was primarily due to a lower interest rate environment relative to previous periods.

Impairment for goodwill During the fourth quarter of 2025, as a part of its annual impairment assessment,  the Company assessed its internal forecast along with several events and circumstances that could affect the significant inputs used to determine the fair value of the Company’s reporting unit, including the significance of the amount, if any, of excess carrying value over fair value, consistency of the Company’s current and forecasted operating margins and cash flows, budgeted-to-actual performance, timing of the expected effects of the Company’s strategic initiatives, overall change in economic climate, changes in the industry and competitive environment, changes to the Company’s risk-adjusted discount rates and earnings quality and sustainability. After considering all available evidence in the evaluation of goodwill impairment indicators including but not limited to regulatory and tax policy changes in China for the livestreaming industry starting in the second half of 2025, a significant decrease in paying users for the year ended December 31, 2025, and a continuous decline in the Company’s operating income during the second half of 2025, the Company determined it appropriate to perform the quantitative assessment of the Company as of December 31, 2025. The quantitative impairment test involves the use of significant estimates and assumptions to evaluate the impact of operational and economic changes on each reporting unit. The Company estimates the fair value using the income valuation approach with assistance of a third-party valuation firm. The income approach applies a fair value methodology to the single reporting unit based on discounted cash flows. This analysis requires significant estimates and judgments, including (i) the estimation of future revenue, projected gross profit margins, projected operating costs, projected operating income margins, and projected capital expenditures, which are dependent on internal cash flow forecasts; and (ii) determination of the risk-adjusted discount rates. As a result of such goodwill impairment test, the Company recorded a full impairment of RMB186.2 million (US$26.6 million) on goodwill for the year ended December 31, 2025. The Company bases fair value estimates on assumptions that the Company believes to be reasonable but that are unpredictable and inherently uncertain. Actual future results may differ from those estimates. 

Impairment for intangible assets During annual impairment test performed in the fourth quarter of 2025, the Company identified several triggering events indicating that the carrying value of its intangible assets may exceed their fair value. These indicators included regulatory and tax policy changes in China for the livestreaming industry starting in the second half of 2025, the significant decrease in paying users for the year ended December 31, 2025, and a continuous decline in the Company’s operating income during the second half of 2025. The Company performed a quantitative assessment as of December 31, 2025 using an income approach. The income approach utilized a discounted cash flow model based on the assumptions including management’s best estimates of the expected future cash flows, risk-adjusted discount rate, and the estimated useful life of the asset group with assistance of a third-party valuation firm. Based on this analysis, the Company determined that the carrying values of its intangible assets were no longer recoverable. As a result of the fair value test, the Group recorded a full impairment of RMB398.8 million (US$57.0 million) on intangible assets for the year ended December 31, 2025.

Other income, net increased by 442.7% to RMB8.7 million (US$1.2 million) for the year ended December 31, 2025 from RMB1.6 million for the year ended December 31, 2024. The increase was primarily due to increased government subsidies and a one-time compensation income. There is no assurance that the Company will continue to receive these subsidies in the future.

Foreign exchange loss was RMB1.6 million (US$0.2 million) for the year ended December 31, 2025, as compared to foreign exchange gain of RMB3.8 million for the year ended December 31, 2024.

Income tax benefit was RMB80.4 million (US$11.5 million) for the year ended December 31, 2025, as compared to income tax expenses of RMB12.6 million for the year ended December 31, 2024.

Net loss was RMB595.0 million (US$85.1 million) for the year ended December 31 2025, as compared to a net income of RMB26.7 million for the year ended December 31, 2024. 

Net loss attributable to the Company’s shareholders was RMB587.1 million (US$84.0 million) for the year ended December 31, 2025, as compared to a net income attributable to the Company’s shareholders of RMB39.7 million for the year ended December 31, 2024.

Adjusted net loss attributable to the Company’s shareholders was RMB579.6 million (US$82.9 million) for the year ended December 31, 2025, as compared to adjusted net income attributable to the Company’s shareholders of RMB50.3 million for the year ended December 31, 2024.

Basic and diluted net loss attributable to the Company’s shareholders per ordinary share were both RMB14.05 (US$2.01) for the year ended December 31, 2025. In comparison, basic and diluted net income attributable to the Company’s shareholders per ordinary share was RMB0.96 and RMB 0.95 for the year ended December 31, 2024.

Adjusted basic and diluted net loss attributable to the Company’s shareholders per ordinary share were both RMB13.87 (US$1.98) for the year ended December 31, 2025. In comparison, adjusted basic and diluted net income attributable to the Company’s shareholders per ordinary share was RMB1.22 and RMB1.21 for the year ended December 31, 2024.

As of December 31, 2025, the Company had cash and cash equivalent balance of RMB307.7 million (US$44.0 million), which represented an increased by of RMB55.1 million from RMB252.5 million as of December 31, 2024. 

Use of Non-GAAP Financial Measures

Adjusted net income attributable to the Company’s shareholders is calculated as net income attributable to the Company’s shareholders adjusted for share-based compensation. Adjusted basic and diluted net income per ordinary share is non-GAAP net income (loss) attributable to ordinary shareholders divided by weighted average number of ordinary shares used in the calculation of non-GAAP basic and diluted net income per ordinary share. The non-GAAP financial measures are presented to enhance investors’ overall understanding of the Company’s financial performance and should not be considered a substitute for, or superior to, the financial information prepared and presented in accordance with U.S. GAAP. Investors are encouraged to review the reconciliation of the historical non-GAAP financial measures to its most directly comparable GAAP financial measures. As non-GAAP financial measures have material limitations as analytical metrics and may not be calculated in the same manner by all companies, they may not be comparable to other similarly titled measures used by other companies. In light of the foregoing limitations, you should not consider non-GAAP financial measures as a substitute for, or superior to, such metrics in accordance with US GAAP. 

For more information on these non-GAAP financial measures, please see the table captioned “Reconciliations of Non-GAAP Results” near the end of this release.

Exchange Rate Information

This announcement contains translations of certain RMB amounts into U.S. dollars at a specified rate solely for the convenience of the reader. Unless otherwise noted, all translations from RMB to U.S. dollars are made at a rate of RMB6.9931 to US$1.00, the noon buying rate in effect on December 31, 2025, in the H.10 statistical release of the Federal Reserve Board. The Company makes no representation that the RMB amounts could have been, or could be, converted, realized or settled in U.S. dollars at that rate on December 31, 2025, or at any other rate.

About Scienjoy Holding Corporation

Scienjoy is a pioneering Nasdaq-listed interactive entertainment leader. Driven by the vision of shaping a metaverse lifestyle, Scienjoy leverages AI-powered technology to create immersive experiences that resonate with global audiences, fostering meaningful connections and redefining entertainment. For more information, please visit http://ir.scienjoy.com/.

Safe Harbor Statement

Certain statements made in this release are “forward looking statements” within the meaning of the “safe harbor” provisions of the United States Private Securities Litigation Reform Act of 1995. When used in this press release, the words “estimates,” “projected,” “expects,” “anticipates,” “forecasts,” “plans,” “intends,” “believes,” “seeks,” “may,” “will,” “should,” “future,” “propose” and variations of these words or similar expressions (or the negative versions of such words or expressions) are intended to identify forward-looking statements. These forward-looking statements are not guarantees of future performance, conditions or results, and involve a number of known and unknown risks, uncertainties, assumptions and other important factors, many of which are outside the Company’s control, that could cause actual results or outcomes to differ materially from those discussed in the forward-looking statements. Important factors, among others, are: the ability to manage growth; ability to identify and integrate other future acquisitions; ability to obtain additional financing in the future to fund capital expenditures; fluctuations in general economic and business conditions; costs or other factors adversely affecting our profitability; litigation involving patents, intellectual property, and other matters; potential changes in the legislative and regulatory environment; a pandemic or epidemic. The forward-looking statements contained in this release are also subject to other risks and uncertainties, including those more fully described in the Company’s filings with the Securities and Exchange Commission (“SEC”) from time to time. The Company undertakes no obligation to update or revise any forward-looking statements, whether as a result of new information, future events or otherwise, except as required by applicable law. Such information speaks only as of the date of this release.

For investor and media inquiries, please contact:

Investor Relations Contacts

Denny Tang
Chief Financial Officer
Scienjoy Holding Corporation
+86-10-64428188
ir@scienjoy.com

Ascent Investor Relations LLC

Tina Xiao
+1-646-932-7242
investors@ascent-ir.com


CONSOLIDATED BALANCE SHEETS

(All amounts in thousands, except share and per share data or otherwise stated)

As of December 31,

2024

2025

2025

RMB

RMB

US$

ASSETS

Current assets

Cash and cash equivalents

252,540

307,650

43,993

Accounts receivable, net

226,060

43,290

6,190

Due from a related party

–

100

14

Investment in marketable security

37,629

8,561

1,224

Prepaid expenses and other current assets

28,415

23,607

3,376

Total current assets

544,644

383,208

54,797

Non-current assets

Property and equipment, net

1,981

2,244

321

Intangible assets, net

405,256

–

–

Goodwill

182,661

–

–

Long term investments

257,387

271,261

38,790

Long term deposits and other assets

906

1,741

249

Right-of-use assets-operating lease

4,845

14,695

2,101

Deferred tax assets

7,505

37,288

5,332

Total non-current assets

860,541

327,229

46,793

TOTAL ASSETS

1,405,185

710,437

101,590

LIABILITIES AND EQUITY

Current liabilities

Accounts payable

36,015

16,665

2,381

Deferred revenue

80,186

50,464

7,216

Accrued salary and employee benefits

22,346

15,184

2,171

Income tax payable

11,284

10,899

1,559

Lease liabilities-operating lease -current

4,098

3,641

521

Accrued expenses and other current liabilities

6,840

9,728

1,391

Total current liabilities

160,769

106,581

15,239

Non-current liabilities

Deferred tax liabilities

58,400

–

–

Lease liabilities-operating lease -non-current

700

10,399

1,487

Total non-current liabilities

59,100

10,399

1,487

TOTAL LIABILITIES

219,869

116,980

16,726

Commitments and contingencies

EQUITY

Ordinary share, no par value, unlimited Class A ordinary shares and
   Class B ordinary shares authorized, 38,922,726 Class A ordinary
   shares and 2,925,058 Class B ordinary shares issued and outstanding
   as of December 31, 2024, respectively; 39,537,710 Class A ordinary
   shares and 2,925,058 Class B ordinary shares issued and outstanding
   as of December 31, 2025, respectively.

Class A ordinary shares

444,162

451,666

64,588

Class B ordinary shares

23,896

23,896

3,417

Shares to be issued

20,817

20,817

2,977

Treasury stocks

(19,952)

(19,952)

(2,853)

Statutory reserves

50,705

34,091

4,875

Retained earnings

662,499

92,024

13,159

Accumulated other comprehensive income

16,967

12,867

1,840

Total shareholders’ equity

1,199,094

615,409

88,003

Non-controlling interests

(13,778)

(21,952)

(3,139)

Total equity

1,185,316

593,457

84,864

TOTAL LIABILITIES AND EQUITY

1,405,185

710,437

101,590


CONSOLIDATED STATEMENTS OF OPERATIONS AND COMPREHENSIVE INCOME

(All amounts in thousands, except share and per share data or otherwise stated)

For the years ended December 31,

2024

2025

2025

RMB

RMB

US$

Live streaming – consumable virtual items revenue

1,317,601

1,187,033

169,743

Live streaming – time based virtual item revenue

24,935

16,951

2,424

Technical services and others

20,848

37,637

5,382

Total revenue

1,363,384

1,241,621

177,549

Cost of revenues

(1,117,942)

(1,014,455)

(145,065)

Gross profit

245,442

227,166

32,484

Sales and marketing expenses

(7,049)

(6,357)

(909)

General and administrative expenses

(76,629)

(88,977)

(12,724)

Research and development expenses

(90,461)

(83,426)

(11,930)

Provision for credit losses

(30,584)

(127,290)

(18,202)

Income (loss) from operations

40,719

(78,884)

(11,281)

Change in fair value of investment in marketable security

6,103

(29,067)

(4,157)

Investments (loss) income

(5,742)

8,712

1,246

Impairment for goodwill

–

(186,170)

(26,622)

Impairment for intangible assets

–

(398,835)

(57,033)

Impairment of long-term investments

(10,425)

–

–

Interest income, net

3,211

1,712

245

Other income, net

1,609

8,732

1,249

Foreign exchange (loss) gain, net

3,805

(1,569)

(224)

Income (loss) before income taxes

39,280

(675,369)

(96,577)

Income tax (expense) benefit

(12,597)

80,369

11,493

Net income (loss)

26,683

(595,000)

(85,084)

Less: net loss attributable to noncontrolling interest

(13,002)

(7,911)

(1,131)

Net income (loss) attributable to the Company’s
   shareholders

39,685

(587,089)

(83,953)

Other comprehensive income (loss):

Other comprehensive loss – foreign currency translation
   adjustment

(998)

(3,494)

(500)

Comprehensive income (loss)

25,685

(598,494)

(85,584)

Less: comprehensive loss attributable to non-controlling
   interests

(13,002)

(7,305)

(1,045)

Comprehensive income (loss) attributable to the Company’s
   shareholders

38,687

(591,189)

(84,539)

Weighted average number of shares

Basic

41,367,946

41,776,414

41,776,414

Diluted

41,564,237

41,776,414

41,776,414

Earnings (loss) per share

Basic

0.96

(14.05)

(2.01)

Diluted

0.95

(14.05)

(2.01)


Reconciliations of Non-GAAP Results

(All amounts in thousands, except share and per share data or otherwise stated)

For the years ended December 31,

2024

2025

2025

RMB

RMB

US$

Net income (loss) attributable to the Company’s shareholders

39,685

(587,089)

(83,953)

Less:

Share based compensation

(10,579)

(7,504)

(1,073)

Adjusted net income (loss) attributable to the Company’s
   shareholders*

50,264

(579,585)

(82,880)

Adjusted net income (loss) per ordinary share

Basic

1.22

(13.87)

(1.98)

Diluted

1.21

(13.87)

(1.98)

“Adjusted net income attributable to the Company’s shareholders” is defined as net income attributable to the
Company’s shareholders excluding share based compensation.


FranklinWH Joins Efficiency Maine to Help Homeowners to Earn up to $600 Annually From Home Batteries

Efficiency Maine Small Battery Program taps residential storage to support grid during peak demand

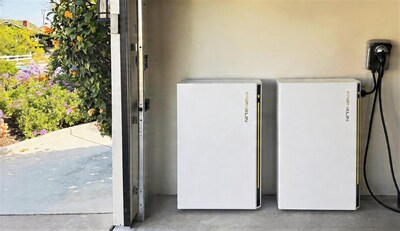
SAN JOSE, Calif., April 24, 2026 /PRNewswire/ — FranklinWH, a leading provider of whole-home energy management and storage systems, announced today it is participating in the Efficiency Maine Small Battery Program, allowing Maine homeowners to earn up to $600 per battery each year by supplying stored energy to the grid during peak demand periods.

The program reflects a growing use of residential energy storage systems as both backup power sources and grid resources that can generate income while helping stabilize electricity supply.

Homeowners who enroll can allow their systems to discharge energy during peak demand events, typically on weekday evenings, in exchange for annual payments.

“I work from home, so losing power really isn’t an option,” said Brian Duggan, a Maine homeowner who has used the system for four months. “There have been several community-wide outages since we installed our system, and we didn’t even notice. Our power stayed on.” Duggan said the system is a maintenance-free alternative to a generator, pairs with electric vehicle charging, and helps protect his home during winter travel.

“This is where the economics of home energy storage are heading,” said Gary Lam, CEO of FranklinWH. “Homeowners are no longer only consumers of electricity; they’re becoming active participants in the energy system. Programs such as this allow them to receive payments while strengthening the grid in their communities.”

Maine’s virtual power plant (VPP) program is administered by Efficiency Maine, which compensates homeowners for the energy their systems send back to the grid during peak events, creating a new revenue stream tied to system participation.

Efficiency Maine may call up to 60 events per year, typically lasting three hours during peak demand windows. Homeowners receive advance notice through the FranklinWH App and can opt out of individual events or unenroll at any time. During events, a reserve level is maintained to ensure power remains available for household needs.

As utilities and policymakers look for new ways to manage rising demand and grid volatility, VPP programs are expected to expand, positioning distributed home energy systems as a critical part of the solution.

About FranklinWH

FranklinWH Energy Storage is the manufacturer of the FranklinWH System, a next-generation home energy management and storage solution. Headquartered in the San Francisco Bay Area, FranklinWH’s team brings decades of experience across energy system design, manufacturing, sales, and installation. The company is AVL-listed with multiple financial institutions and continues to empower homeowners to achieve true energy freedom. Learn more at franklinwh.com.

Media Contact:
Media@franklinwh.com

Global Coatings and Stone Paint Markets Set for Sustained Growth Amid Shift Toward Sustainability and Architectural Innovation

Rapid growth in sustainable coatings and high-performance stone paint solutions is reshaping global construction markets, driven by regulatory pressure, urbanisation, and evolving architectural demands

SHANGHAI, April 24, 2026 /PRNewswire/ — According to recent analysis by Frost & Sullivan, the global coatings industry is undergoing a significant transformation, driven by tightening environmental regulations, evolving construction demands, and rapid technological advancements. In parallel, the stone paint segment is emerging as a high-growth category, reshaping the landscape of exterior architectural finishes worldwide.

The global coatings industry, comprising waterborne, powder, and high-solids coatings, continues to transition toward environmentally sustainable solutions. This shift is supported by increasing regulatory pressure and strong construction activity, particularly across emerging markets. Waterborne coatings, including stone paint, are gaining traction as low-VOC alternatives that align with global sustainability targets.

The industry value chain remains robust, with stable upstream supply of raw materials such as solvents, aggregates, and additives, supporting midstream manufacturers producing architectural and industrial coatings. Downstream, demand spans diverse sectors including construction, automotive, furniture, and industrial equipment.

Frost & Sullivan estimates that the global coatings market grew from RMB 1,137.6 billion in 2020 to RMB 1,565.0 billion in 2025, representing a CAGR of 7.8%. The market is projected to reach RMB 2,248.7 billion by 2030, driven by continued innovation, infrastructure development, and the adoption of Industry 4.0 technologies.

Within this broader market, the global stone paint industry – classified under exterior textured paints – has emerged as a key growth segment. These coatings replicate the appearance of natural stone while offering superior flexibility, reduced weight, and enhanced weather resistance. As a result, they are increasingly replacing traditional cladding materials in modern construction.

The global stone paint market expanded from RMB 42.2 billion in 2020 to RMB 106.1 billion in 2025, achieving a CAGR of 20.2%. It is forecast to reach RMB 245.1 billion by 2030, with a projected CAGR of 18.2% from 2025. Growth is being driven by rising demand for energy-efficient building materials and enhanced architectural aesthetics.

Stone-like coatings are becoming a pivotal enabler of high-quality architectural development. They not only enhance visual appeal but also reduce structural load and natural resource consumption, making them highly aligned with global sustainability objectives.

The Asia-Pacific region continues to play a central role in market expansion, both as a production hub and a key demand centre. In 2025, China accounted for 25.6% of the global stone paint market, supported by strong policy momentum around green building standards and carbon reduction initiatives. The country’s stone paint market grew from RMB 11.4 billion in 2020 to RMB 27.2 billion in 2025, and is expected to reach RMB 50.6 billion by 2030.

From a competitive standpoint, the market remains moderately concentrated, with the top five players accounting for approximately 36.3% of global market share in 2025. SKSHU Paint leads the segment with an estimated 23.2% share.

Looking ahead, several structural drivers are expected to sustain growth in the stone paint market. These include increasing demand for customized architectural aesthetics, cost advantages over natural stone, and the continued tightening of environmental regulations promoting low-VOC and water-based solutions. In addition, infrastructure expansion across emerging markets in Asia-Pacific, the Middle East, and Africa is expected to provide significant long-term demand.

As urbanisation accelerates and sustainability becomes a core priority, both the global coatings and stone paint industries are poised for continued innovation and expansion, reinforcing their critical role in the future of construction and industrial development.

About Frost & Sullivan

Frost & Sullivan, the Growth Pipeline Company, enables clients to accelerate growth and achieve best-in-class positions in growth, innovation, and leadership. The company’s Growth Pipeline as a Service provides the CEO’s Growth Team with transformational strategies and best-practice models to drive the generation, evaluation, and implementation of powerful growth opportunities. For over 60 years, Frost & Sullivan has partnered with investors, corporate leaders, and governments to identify, prioritise, and execute transformational growth strategies.

Your Transformational Growth Journey Starts Here: Schedule Your Growth Pipeline Dialog™ with the Frost & Sullivan team.

Contact:
Rachel Zhang
Frost & Sullivan China
E: rachel.zhang@frostchina.com
T: +86 021-3209-6800

Electrolux Group and Midea Group form a highly complementary long-term strategic partnership in North America to accelerate profitable growth and strengthen innovation

STOCKHOLM, April 24, 2026 /PRNewswire/ — Electrolux Group announces today that it has entered into agreements with Midea Group to establish a highly complementary long-term strategic partnership in Food Preservation (refrigeration) manufacturing and sales, and Fabric Care (laundry) manufacturing in North America. The partnership is designed to support long-term profitable growth and will contribute to Electrolux Group’s overarching efforts to transform the business in North America. It will strengthen the Group’s product offering in Food Preservation and Fabric Care through innovation, improved cost competitiveness and increased operational flexibility. The Group expects that the partnership will have a positive effect on Electrolux Group’s sales and contribute to gradually increasing cost efficiency improvements over the next three years, with approximately SEK 0.6 billion in year three. As a result of this announcement, Electrolux Group expects to report total negative non-recurring items (“NRIs”) of approximately SEK 2.4 billion, in the second quarter of 2026, of which approximately SEK 0.9 billion will have a cash impact. The partnership is expected to commence in the third quarter of 2026 and will aim to create a stronger platform for innovation, product development, and deliver value to customers and consumers in North America.

The partnership with Midea Group is expected to accelerate the transformation of Electrolux Group’s North American business, strengthening its ability to support long-term profitable growth. The partnership builds on the companies’ more than 20-year sourcing-supplier relationship and combines Electrolux Group’s strong market presence, established infrastructure and deep consumer insights with Midea Group’s core competence in operations and innovation, continuous investment in efficient manufacturing and supply chain and industrial flexibility. Midea Group is a global, publicly listed smart home solutions and commercial and industrial solutions provider with significant R&D capabilities, headquartered in China, with global revenues of approximately USD 63.7 billion[1].

A new operating model will be introduced across selected parts of Electrolux Group’s North American operations. It will support the Group’s continued investments in consumer-centric innovation, including the rollout of advanced digital product features. In addition, it will enhance the Group’s ability to expand its product offering in Food Preservation, including a wider and up-featured range of refrigerators, and in Fabric Care, including top-load laundry, in North America.

“This partnership marks a major milestone in the execution of Electrolux Group’s strategy and puts us in a position to accelerate profitable growth. It enables us to continue to invest in sustainable, consumer-centric innovations to serve our customers and consumers with even stronger product offerings in North America.” says Yannick Fierling, President & CEO of Electrolux Group.

The partnership will include shared manufacturing expertise benefiting from joint operational capabilities. It is expected to deliver fixed and variable cost savings from 2026 that will increase over time. Together, the Group believes these measures will accelerate growth, strengthen the Group’s ability to innovate, and improve responsiveness to evolving market conditions and consumer needs.

Structure of the partnership

The partnership will be structured as three Joint Ventures:

  • Sales Joint Venture (“JV”) for Food Preservation product and commercial strategies in North America

Electrolux Group and Midea Group will jointly co-develop and sell Food Preservation products for North America through a sales JV, in which each company will hold 50 percent of the shares. The sales JV will manage product and commercial strategies in North America across Electrolux Group’s and Midea Group’s product brands. Electrolux Group and Midea Group will work together to develop a full line of innovative, differentiated products for both companies’ brands, providing customers and consumers with a broad array of choices. The sales JV is expected to begin operations in the third quarter of 2026.

  • Manufacturing JV for Food Preservation in Juarez (Mexico)

Electrolux Group and Midea Group will jointly operate the Food Preservation factory in Juarez, which is expected to begin in the third quarter of 2026. Midea Group will purchase 65 percent of the legal entities holding the operational assets associated with Food Preservation in Juarez, and Electrolux Group will retain 35 percent. Electrolux Group’s Fabric Care operations in Juarez will be carved out prior to closing of the transaction and will continue to serve the Group exclusively.

  • Manufacturing JV for Fabric Care in Anderson (South Carolina, United States)

Electrolux Group and Midea Group will jointly operate the factory in Anderson, which will be repurposed from a Food Preservation factory into a Fabric Care factory. A manufacturing JV will be established that will own and operate the Anderson factory, with Electrolux Group holding 55 percent and Midea Group holding 45 percent of the shares. The current Food Preservation production is expected to be phased out by July 2026, with the Fabric Care production expected to commence in the first half of 2027.

The JV agreements have an initial term of 15 years that is automatically extended with consecutive 10-year periods, unless terminated three years in advance by either party. The manufacturing facilities in Springfield, Tennessee (Food Preparation), Kinston, North Carolina (Dish Care) and Juarez, Mexico (Fabric Care) will continue to be operated by Electrolux Group.

Financial aspects

In 2025, Electrolux Group North America generated approximately SEK 45 billion in net sales, representing approximately 34 percent of the Group’s total net sales.

The partnership is expected to positively contribute to Electrolux Group’s sales in North America, driven partly by the assumption of consolidation of the sales JV in Electrolux Group’s financial statements, including Midea Group’s branded Food Preservation sales in North America. In addition, the partnership will enhance the opportunities for Electrolux Group to accelerate growth in both Food Preservation and Fabric Care, in North America.

The partnership is expected to affect approximately 1,500 employees in 2026, resulting in a negative cash NRI of approximately SEK 0.9 billion. The NRI mainly relates to severance costs and is expected to be recognized in the second quarter of 2026. The manufacturing JV for Anderson is expected to hire up to approximately 1,200 employees gradually across 2027 and 2028, as it is re-purposed into a Fabric Care factory.

It is further expected that a write-off of approximately SEK 1.5 billion, mainly related to the Food Preservation production in Anderson will be reported as a negative NRI in the second quarter of 2026. As a result of these actions, Electrolux Group expects to report total negative NRIs of approximately SEK 2.4 billion, in the second quarter of 2026. The sale of assets in Juarez to the manufacturing JV is expected to occur in the third quarter of 2026 and have a neutral effect on the income statement, but is expected to generate a positive cash flow effect of approximately SEK 1.0 billion with a corresponding reduction in assets.

The partnership is also expected to require approximately SEK 1.1 billion in capital expenditure over the next three years related to the start-up of the Fabric Care production in Anderson and investing in new platforms for refrigeration in Juarez.

The partnership will not impact Electrolux Group’s business outlook for 2026[2].

Timing

The Committee on Foreign Investment in the U.S. (“CFIUS”) has approved the transactions described above. Subject to certain regulatory approvals outside the U.S. and other customary closing conditions, the JVs are expected to commence their operations in the third quarter of 2026.

Advisors

PJT Partners served as exclusive financial advisor to Electrolux and King & Spalding acted as lead legal advisor to Electrolux, with Ropes & Gray providing additional legal advice to Electrolux.

Important notice

Certain statements made in this announcement are forward-looking statements. Such statements are based on current expectations and assumptions and are subject to a number of risks and uncertainties that could cause actual events or results to differ materially from any expected future events or results expressed or implied in these forward-looking statements. Persons receiving this announcement should not place undue reliance on forward-looking statements. Unless otherwise required by applicable law, regulation or accounting standard, Electrolux Group does not undertake to update or revise any forward-looking statements, whether as a result of new information, future developments or otherwise.

[1] Based on full-year 2025 revenues of CNY 458,502 million, translated using an average CNY/USD FX rate of 0.1392 for the period January 1, 2025 to December 31, 2025.

[2] See the Electrolux Group’s Year-end report Q4 2025, page 3.

This is information that AB Electrolux is obliged to make public pursuant to the EU Market Abuse Regulation. The information was submitted for publication, through the agency of the contact person set out above, on 23-04-2026 17:30 CET.

CONTACT:

For more information:

Ann-Sofi Jönsson, Head of Investor Relations & Sustainability Reporting, ann-sofi.jonsson@electrolux.com, +46 73 025 1005 
Maria Åkerhielm, Investor Relations Manager, maria.akerhielm@electrolux.com, +46 70 796 3856 
Henry Sjölin, Investor Relations Manager, henry.sjolin@electrolux.com, +46 76 863 51 85 
Electrolux Group Press Hotline, + 46 8 657 65 07

This information was brought to you by Cision http://news.cision.com

https://news.cision.com/electrolux-group/r/electrolux-group-and-midea-group-form-a-highly-complementary-long-term-strategic-partnership-in-nort,c4339287

The following files are available for download:

https://mb.cision.com/Main/1853/4339287/4055751.pdf

Press release Midea partnership April 23 2026 Eng final