NPV: 
- After-tax NPV(5%) of C$6.73 billion and IRR of 23% at Consensus Metal Prices
- After-tax NPV(5%) of C$13.53 billion and IRR of 39% at Spot Metal Prices.
NPV Including scandium and the associated processing circuit:
- After-tax NPV(5%) of C$6.94 billion an IRR of 19% at Consensus Metal Prices
- After-tax NPV(5%) of C$14.52 billion and IRR of 32% at Spot Metal Prices.
Vancouver, British Columbia–(Newsfile Corp. – March 2, 2026) – Doubleview Gold Corp (TSXV: DBG) (OTCQB: DBLVF) (FSE: 1D4) (“Doubleview” or the “Company”) is pleased to announce the results of its Preliminary Economic Assessment (PEA) of its 100%-owned polymetallic Hat porphyry project (“Hat” or “the Project”), in northwestern British Columbia. With major content of copper, gold, cobalt, silver, and scandium, Hat becomes an important source of critical minerals.
Three processing scenarios were evaluated-Scenario A1 (A1) a Cu-Au-Ag-Co flotation base case using current testwork recoveries[1], Scenario A2 (A2), the same base case using expected recoveries1, and Scenario B (B), a Cu-Au-Ag-Co flowsheet with an added hydrometallurgical circuit and scandium recovery circuit-with results indicating the Project is financially attractive even without the scandium component.
Highlights:
- Robust Project Economics: The PEA demonstrates a high-margin operation with an After-Tax NPV(5%) of C$4.96 billion (A1), C$6.73 billion (A2), or C$6.94 billion (B), and an IRR of 19% (A1), 23% (A2), or 19% (B) at analyst consensus metal prices[2]. Using a spot-price scenario[3], the Project delivers a compelling after-tax NPV(5%) of C$11.05 billion (A1), 13.53 billion (A2), or C$14.52 billion (B) and an IRR of 34% (A1), 39% (A2), or 32% (B).
- Sensitivity Highlight: Project economics show the greatest leverage to overall metal prices, with NPV (5%) ranging from C$3.2 billion to C$10.2 billion (IRR: 14%-32%) at ±20% on all metals; even under additional +20% CAPEX and +20% OPEX sensitivities, applied on top of a 25% contingency already embedded in the base case, all scenarios deliver IRRs of 16% or better, and Scenario B provides additional scandium oxide upside with NPV(5%) of C$6.2 billion-C$7.7 billion (IRR: 18%-20%) at ±40% metal price.
- Tier 1 Scale and Longevity: The mine plan supports a multi-decade life of 25 years at a 120,000 tonnes-per-day processing rate, underpinned by a resource base of 609 Mt at 0.43% CuEq[4] in the Measured and Indicated categories and 503 Mt at 0.41% CuEq4 in the Inferred category.
- High-Output Production Profile B: Envisioned as a conventional large-scale open-pit operation, the Project is expected to produce an average of over 74 kt of copper, 254 koz of gold, 376 koz of silver and 2.7 kt of cobalt annually during the first 10 years, with life-of-mine (LOM) average production of 67.6 kt Cu, 217 koz Au, 348 koz Ag, 2.5 kt Co, and 128 tonnes of scandium oxide per year. (NOTE: projected cobalt to be about 68% of North America’s cobalt production based on 2024 production)
- Strategic Importance for Critical Minerals: The Project is positioned as a primary North American source of copper, scandium, and cobalt. With approximately 2.42 billion pounds of copper, 80 million pounds of cobalt and 2,415 tonnes of scandium oxide contained[5] in the Measured and Indicated categories, the Project represents an important discovery of critical minerals.
- Stable, Supportive Jurisdiction: Located in a premier mining district in British Columbia, the Project benefits from a stable regulatory environment. The Company is committed to engaging with local First Nations in a respectful manner and to working toward positive and constructive relationships as the Project advances.
- Catalyst for Development: The PEA serves as the technical foundation for an immediate transition into a Pre-Feasibility Study (PFS), providing a clear roadmap for early works and permitting activities in 2026 and 2027.
Farshad Shirvani, President and CEO of Doubleview Gold Corp., commented, “The results of this PEA confirm the scale, strength and long-term potential of the Hat Project. Delivering a post-tax NPV(5%) of up to C$6.94 billion and IRR of up to 23% at consensus prices, and even stronger metrics at spot prices, validates years of disciplined exploration and technical work by our team. Hat is demonstrating Tier 1 characteristics with a 25-year mine life, strong annual production profile and meaningful free cash flow generation. Importantly, the Project stands on its own without reliance on scandium, while still preserving significant upside from critical minerals as markets mature. We are excited to advance Hat to Pre-Feasibility and continue building a major Canadian critical metals project.”
Doubleview acknowledges that the Project is located on the traditional territories of the Tahltan Nation and the Taku River Tlingit First Nation, and recognizes their enduring relationship to and stewardship of the land and waters. Doubleview is committed to respectful, transparent, and ongoing engagement with First Nations and local communities whose territories overlap the Project area and access routes, with a focus on protecting water and the environment and advancing responsible development.
PEA OVERVIEW
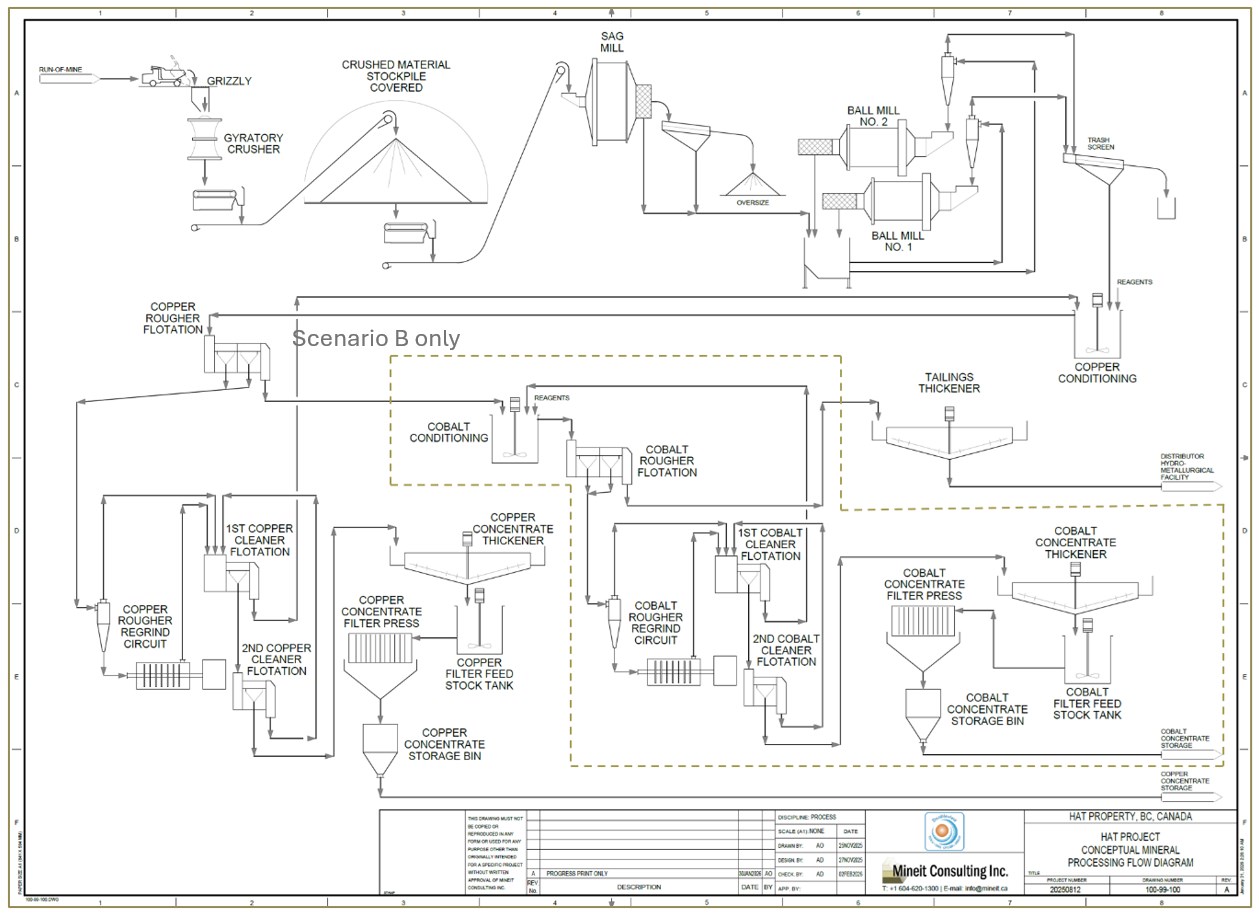
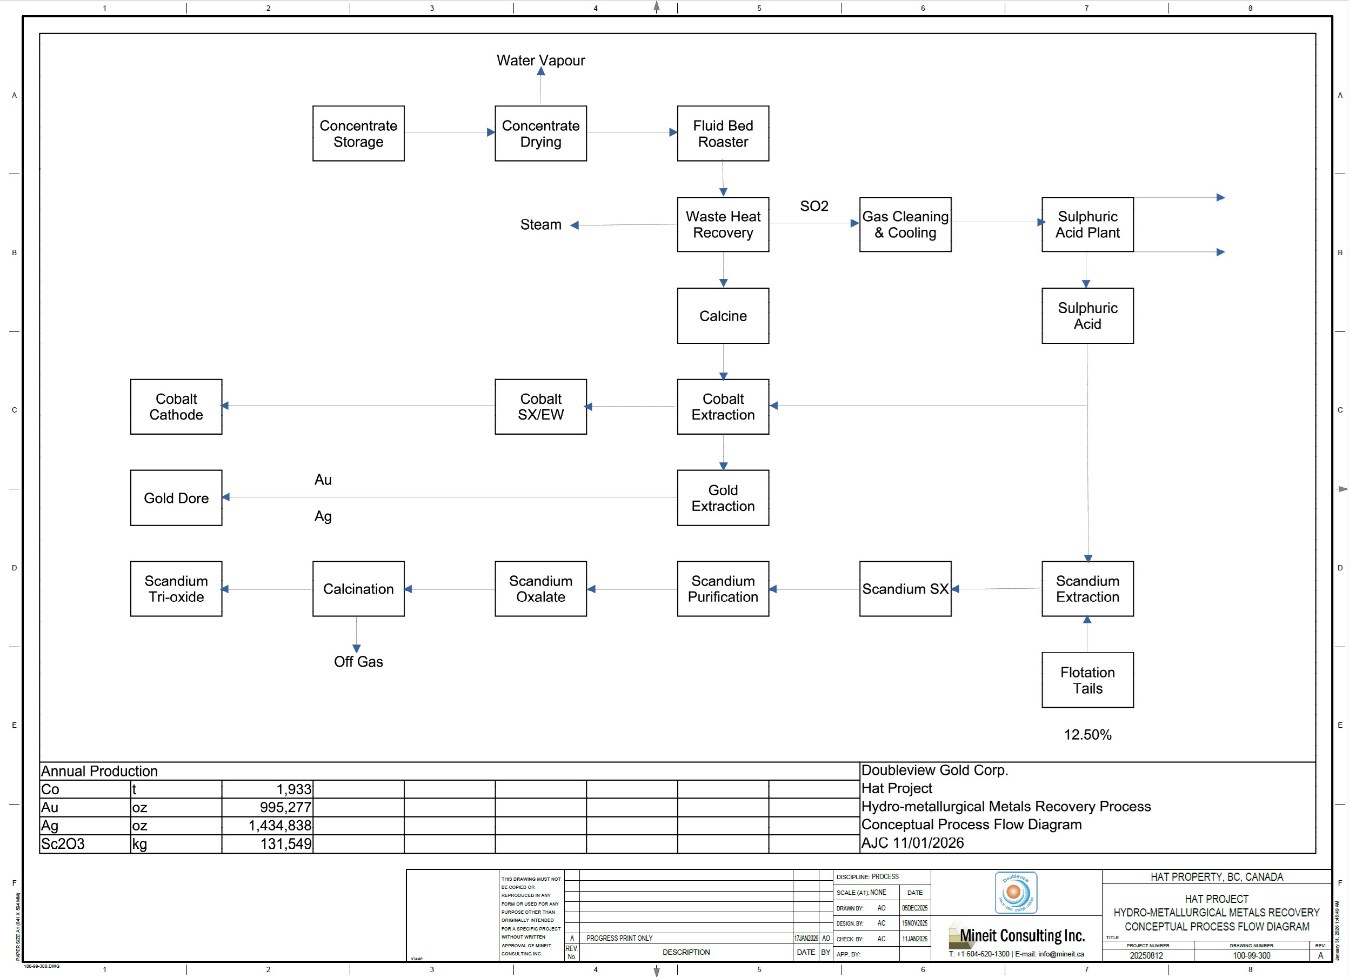
The PEA contemplates a conventional open-pit mine and processing operation with a 25-year mine life at a 120,000 t/d (42 Mt/a) plant throughput. Two processing pathways were evaluated, A1 and its alternative, A2, and B: the first alternative, A, is a Cu-Au-Ag-Co flotation concentrator with two recovery cases based on current metallurgical testwork, and A2, reflecting expected performance (Figure 1); and B, a full circuit that retains the base flowsheet and adds a downstream hydrometallurgical scandium recovery circuit (Figure 2).
The tailings storage facility is a centreline-raised facility built with compacted cycloned sand from tailings underflow, and engineered drainage for stability, with site-contact waters (including seepage and pit dewatering) recycled to the process plant and final closure involving pond drainage and reclamation. The Project is expected to rely on grid power via an extended transmission line.
Tables 1 to 3 summarize the key results of the PEA, including production, operating costs, capital expenditures, and the principal financial metrics; the sections that follow provide additional detail on the underlying assumptions, project design, and study outcomes.
Table 1: PEA Study Summary-Production
| Metric |
Unit |
Scenario A1 |
Scenario A2 |
Scenario B |
| Mining Summary |
| Strip ratio |
t:t |
1.60 |
| Production Summary LOM |
| Average Annual Throughput |
Mt |
42 |
| CuEq Head Grade[6], [7] |
% |
0.42 |
| Cu Head Grade |
% |
0.19 |
| Au Head Grade |
g/t |
0.19 |
| Ag Head Grade |
g/t |
0.51 |
| Co Head Grade |
g/t |
0.78 |
| Sc Head Grade6 |
g/t |
28.35 |
| Cu Recovery |
% |
80 |
89 |
85[8] |
| Au Recovery |
% |
66 |
75 |
898 |
| Ag Recovery |
% |
53 |
53 |
688 |
| Co Recovery |
% |
30 |
30 |
788 |
| Sc Recovery |
% |
N/A |
728 |
| Overall Mass of Tailings to Process[9] |
% |
N/A |
12.5 |
| Year of Production Start of Sc2O38 |
year |
N/A |
4 |
| Average Annual Cu Production |
kt |
63.6 |
70.8 |
67.6 |
| Total Cu Production |
kt |
1,590.5 |
1,769.4 |
1,689.9 |
| Average Annual Payable Cu |
kt |
61.7 |
68.7 |
65.7 |
| Total Payable Cu |
kt |
1,542.8 |
1,716.3 |
1,642.2 |
| Average Annual Au Production |
koz |
161.1 |
183.1 |
217.3 |
| Total Au Production |
koz |
4,028.2 |
4,577.5 |
5,432.0 |
| Average Annual Payable Au |
koz |
153.1 |
173.9 |
207.5 |
| Total Payable Au |
koz |
3,826.8 |
4,348.7 |
5,188.6 |
| Average Annual Ag Production |
koz |
271.3 |
271.3 |
348.0 |
| Total Ag Production |
koz |
6781.6 |
6,781.6 |
8,700.9 |
| Average Annual Payable Ag |
koz |
244.1 |
244.1 |
318.6 |
| Total Payable Ag |
koz |
6,103.4 |
6,103.4 |
7,965.3 |
| Average Annual Co Production |
kt |
1.0 |
1.0 |
2.5 |
| Total Co Production |
kt |
23.9 |
23.9 |
62.2 |
| Average Annual Payable Co |
kt |
0.8 |
0.8 |
2.3 |
| Total Payable Co |
kt |
19.1 |
19.1 |
56.3 |
| Average Annual Sc2O3 Production |
t |
N/A |
128.4 |
| Total Sc2O3 Production |
t |
N/A |
3,209.5 |
| Total Sc2O3 Payable |
t |
N/A |
3,049.0 |
Table 2: PEA Study Summary-Operating Cost
| Metric |
Unit |
Scenario A1 |
Scenario A2 |
Scenario B |
| Operating Cost |
| Average Mine Operating Costs |
C$/t-moved |
2.32 |
| Average Mine Operating Costs |
C$/t-milled |
6.03 |
| Processing Operating Cost[10] |
C$/t-milled |
7.93 |
7.93 |
10.84 |
| Sc2O3 Processing Cost[11] |
C$/kg Sc2O3 |
N/A |
939.55 |
| General & Administrative |
C$/t-milled |
2.56 |
2.56 |
2.56 |
| Total Operating Costs |
C$/t-milled |
16.22 |
16.22 |
22.96 |
Table 3: PEA Study Summary-Capital Expenditure and Financial Metrics
| Metric |
Unit |
Scenario A1 |
Scenario A2 |
Scenario B |
| Capital Expenditure |
| Initial Capital Costs |
C$M |
3,552 |
3,601 |
3,828 |
| Sustaining Capital Costs |
C$M |
2,755 |
2,755 |
4,006 |
| Closure and Reclamation Cost |
C$M |
503 |
| Financial Metrics |
| Exchange Rate |
CAD/USD |
1.37 |
| Long Term Copper Price |
US$/lb |
4.88 |
| Long Term Gold Price |
US$/oz |
3,272.60 |
| Long Term Silver Price |
US$/oz |
50.22 |
| Long Term Cobalt Price |
US$/lb |
19.57 |
| Long Term Scandium Oxide Price |
US$/kg |
N/A |
1,500 |
| Average Annual EBITDA |
C$M |
886 |
1,071 |
1,242 |
| Total EBITDA |
C$M |
22,162 |
26,770 |
31,041 |
| Average Annual Free Cash Flow (Pre-tax) |
C$M |
756 |
940 |
1,061 |
| Free Cash Flow (Pre-tax)[12] |
C$M |
18,904 |
23,511 |
26,532 |
| Total Provincial Tax (inc. BC Mineral Tax) |
C$M |
(4,029) |
(5,090) |
(5,772) |
| Total Federal Tax |
C$M |
(1,274) |
(1,859) |
(2,170) |
| Total Taxes |
C$M |
(5,303) |
(6,949) |
(7,942) |
| Average Annual Free Cash Flow (Post-tax) |
C$M |
544 |
662 |
744 |
| Free Cash Flow (Post-tax)12 |
C$M |
13,601 |
16,562 |
18,591 |
| Total Free Cash Flow (Pre-tax)[13] |
C$M |
15,352 |
19,910 |
22,704 |
| Total Free Cash Flow (Post-tax)12 |
C$M |
10,050 |
12,961 |
14,763 |
| NPV 5% (Pre-tax) |
C$M |
7,883 |
10,576 |
11,043 |
| NPV 5% (Pre-tax) |
US$M |
5,754 |
7,720 |
8,061 |
| IRR (Pre-tax) |
% |
24 |
29 |
23 |
| Payback (Pre-tax) |
years |
Year 5 |
Year 4 |
Year 6 |
| NPV 5% (Post-tax) |
C$M |
4,963 |
6,727 |
6,937 |
| NPV 5% (Post-tax) |
US$M |
3,623 |
4,911 |
5,064 |
| IRR (Post-tax) |
% |
19 |
23 |
19 |
| Payback (Post-tax) |
Years |
Year 6 |
Year 5 |
Year 7 |
Table 4 shows the Sensitivity analysis using after-tax NPV(5%) and after-tax IRR.
Table 4: Sensitivity Analysis
| Variable |
Case
(%) |
Metal Price |
Scenario A1 |
Scenario A2 |
Scenario B |
NPV (5%)
C$M |
IRR
(%) |
NPV (5%)
C$M |
IRR
(%) |
NPV (5%)
C$M |
IRR
(%) |
| Base Case |
|
Consensus forecast |
4,963 |
19 |
6,727 |
23 |
6,937 |
19 |
| Copper Price |
-20 |
US$3.90/lb Cu |
3,218 |
15 |
4,807 |
19 |
5,094 |
15 |
| Copper Price |
+20 |
US$5.86/lb Cu |
6,688 |
23 |
8,632 |
28 |
8,764 |
22 |
| Gold Price |
-20 |
US$2,618.08/oz |
3,625 |
16 |
5,223 |
19 |
5,201 |
16 |
| Gold Price |
+20 |
US$3,927.12/oz |
6,289 |
22 |
8,222 |
27 |
8,661 |
22 |
| Metal Prices |
-20 |
All metal prices |
1,708 |
10 |
3,165 |
14 |
2,650 |
11 |
| Metal Prices |
+20 |
All metal prices |
8,118 |
27 |
10,233 |
32 |
11,110 |
26 |
| Initial CAPEX |
+20 |
Variable per Scenario |
4,448 |
16 |
6,222 |
19 |
6,394 |
16 |
| OPEX |
+20 |
Variable per Scenario |
3,660 |
16 |
5,438 |
20 |
5,185 |
16 |
| Scandium Oxide Price |
-40 |
US$900/kg Sc2O3 |
|
|
|
|
6,159 |
18 |
| Scandium Oxide Price |
+40 |
US$2,100/kg Sc2O3 |
|
|
|
|
7,714 |
20 |
MINERAL RESOURCE ESTIMATE
Doubleview Gold Corp announced an update of the Mineral Resource estimate (MRE). This estimate followed the Micon International Ltd. (Micon) Mineral Resource estimate with an effective date of July 17, 2024. This MRE incorporates significant new data from the 2024 and 2025 exploration campaigns, with an effective date of February 4, 2026, and superseded the 2024 Micon estimate.
Table 5: Hat MRE at a 0.2% CuEq Cut-Off Effective February 4, 2026
Mineral
Resource
Classification |
Tonnage
(Mt) |
Average Grade |
Metal Content |
CuEq
(%) |
Cu
(%) |
Au
(g/t) |
Co
(g/t) |
Ag
(g/t) |
CuEq
(Blb) |
Cu
(Blb) |
Au
(Moz) |
Co
(Mlb) |
Ag
(Moz) |
| Measured |
272 |
0.44 |
0.22 |
0.18 |
76.26 |
0.37 |
2.61 |
1.11 |
1.41 |
35.6 |
2.17 |
| Indicated |
337 |
0.43 |
0.21 |
0.19 |
76.81 |
0.39 |
3.21 |
1.31 |
1.81 |
44.5 |
2.88 |
| Total M+I |
609 |
0.43 |
0.21 |
0.18 |
76.57 |
0.38 |
5.82 |
2.42 |
3.22 |
80.1 |
5.05 |
| Inferred |
503 |
0.41 |
0.18 |
0.19 |
76.62 |
0.38 |
4.57 |
1.72 |
2.77 |
66.2 |
4.19 |
Table 6: Hat MRE at a 0.2% CuEq Cut-Off as of February 4, 2026, Scandium Oxide Resources
Mineral Resource
Classification |
Tonnage
(Mt) |
Sc Tonnage1
(Mt) |
Average Grade
Sc (g/t) |
Metal Content
Sc2O3 2 (t) |
| Measured |
272 |
34 |
28.79 |
1,081 |
| Indicated |
337 |
42 |
28.76 |
1,334 |
| Total M+I |
609 |
76 |
28.77 |
2,415 |
| Inferred |
503 |
63 |
28.69 |
1,996 |
Notes:
1 Scandium tonnages represent 12.5% of the mineralized material by category, reflecting the proportion of tailings expected to be processed through a dedicated scandium leach circuit under current metallurgical design constraints.
2 Scandium oxide metal content have been calculated using the metallurgical recovery of 72% and conversion factor from Sc to Sc2O3 of 1.534.
- Mineit’s Qualified Person, Tomasz Wawruch, FAusIMM, completed the MRE, and has reviewed and approved the technical disclosure related to the MRE contained in this news release. Mr. Wawruch is a senior geology and mineral resource consultant independent of Doubleview. Mr. Gilles Arseneau, PhD., P.Geo., of ARSENEAU Consulting Services Inc., provided an independent review of this MRE.
- Mineral Resources that are not Mineral Reserves do not have demonstrated economic viability.
- The estimate of Mineral Resources may be materially affected by environmental, permitting, legal, title, taxation, socio-political, marketing, or other relevant issues.
- Inferred Mineral Resources are considered too speculative geologically to have economic considerations applied to them that would enable them to be categorized as Mineral Reserves.
- The Mineral Resource Estimate was prepared in accordance with the Canadian Institute of Mining, Metallurgy and Petroleum (CIM) Definition Standards for Mineral Resources and Mineral Reserves (2014), and CIM MRMR Best Practice Guidelines (2019).
- The effective date of the MRE is February 4, 2026.
- Metal contents have been calculated using the following metallurgical recovery factors: Cu = 85%, Au = 89%, Co = 78%, and Ag = 68%.
- Economic assumptions used include US4.80/lb Cu, US20.00/lb Co, US3,200/oz Au, US46/oz Ag, and a 2% NSR royalty.
- Mineral Resources are reported within optimized open pit constraints and 0.2% CuEq cut-off grade, based on a C7.93/t milled processing cost and C2.90/t milled general and administrative cost, with a mining cost of C3.01/t plus incremental mining cost increasing by C0.015/t for every bench below the reference level of 1,125 mRL.
- CuEq calculations do not include scandium. The formula used to calculate CuEq is: CuEq = [(((Ag × 46.0 × 0.68)/31.1035) + ((Au × 3200 × 0.89)/31.1035) + 0.0001 × (Co × 20.0 × 0.78 × 22.0462) + 0.0001 × (Cu × 4.8 × 22.0462 × 0.85))/(4.8 × 22.0462 × 0.85)], where all input variables are expressed in (ppm) and CuEq is expressed in percent (%).
- Rounding may result in minor variations between individual values and totals; such differences are not considered material to the MRE.
- Mineral Resource classification reflects the level of geological confidence and satisfies the uncertainty criteria appropriate for exploration and resource development. Additional drilling will be required to reduce uncertainty to the level expected for production planning.
- The MRE reflects the geological interpretation, drill-hole spacing, and estimation parameters available at the time of modelling. Any additional drilling is expected to influence the current outcome by improving confidence in the estimates and refining the geometry of the mineralized domains.
- The Mineral Resource results are presented in situ within the optimized pit. Mineralized material outside the pit has not been considered as a part of the current MRE tabulation. Calculations used metric units (metres, tonnes, g/t).
- A total of 97 diamond drill holes, comprising 49,548 m of core, were incorporated into the Mineral Resource Estimate. All drilling data used in the MRE were subject to standard QA/QC validation prior to inclusion.
PROCESSING SCENARIOS
The PEA evaluates two processing scenarios: (A) a conventional Cu-Au-Ag-Co flotation concentrator at 120,000 t/d (42 Mt/a) with two recovery cases-A1 based on metallurgical testwork completed by Sepro Laboratories (Langley, BC) and A2 reflecting target/expected performance-and (B) a full circuit that retains the base flowsheet and adds a downstream hydrometallurgical scandium recovery circuit.
The concentrator consists of crushing, grinding, flotation, concentrate handling, and tailings management, producing both a saleable approximately 25% Cu concentrate with co-product gold and by-product silver-cobalt credits and a pyrite concentrate enriched in cobalt; in the full-circuit case, the pyrite concentrate is roasted to generate sulphuric acid and a calcine that is then processed to recover cobalt, gold, silver, and copper; after stripping it will be precipitated as a sulphide to be admixed to the copper concentrate to improve grade, with the acid used to leach flotation tailings for scandium recovery, noting that the scandium circuit is a newer chemical process compared with the otherwise industry-standard flowsheet.
Under A1 or A2 (Figure 1), the flowsheet produces a single saleable product-a copper concentrate with payable gold credits; the pyrite concentrate is not treated or marketed in this case and is only processed in B where the hydrometallurgical circuit enables recovery of cobalt (and additional Au-Ag) and supports the scandium circuit (Figure 2), which is planned to be constructed in a phased approach commencing in Year 3 of operations.
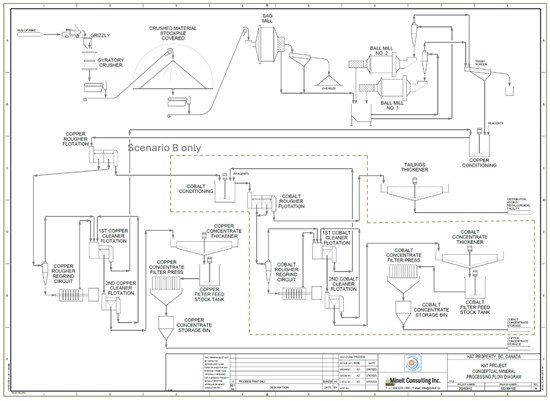
Figure 1: Grinding and Flotation Flowsheet; Scenarios A1/A2 Report Copper Concentrate Only, while the Cobalt-Pyrite Flotation Stream Shown Is Included Only in Scenario B
To view an enhanced version of this graphic, please visit:
https://images.newsfilecorp.com/files/8003/285945_7d43165cf4f1bb4d_001full.jpg
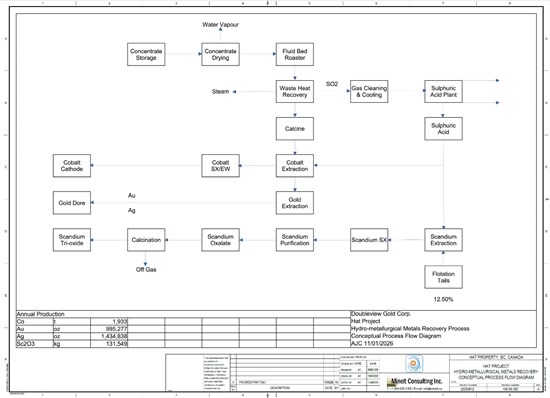
Figure 2: Scenario B Hydrometallurgical Plant Block Flow Diagram, Showing Downstream Treatment of the Cobalt-Pyrite Stream and Flotation of Tailings to Recover Cobalt (and Au-Ag) and Scandium, Including Sulphuric Acid Generation to Support the Scandium Circuit
To view an enhanced version of this graphic, please visit:
https://images.newsfilecorp.com/files/8003/285945_7d8c82e63416eab6_003full.jpg
Table 7 summarizes the head grades, concentrate grades, and overall metallurgical recoveries from early testwork for the full circuit; A1 assumes only the reported recoveries to the Cu-Au concentrate, while the cobalt-pyrite concentrate and downstream recoveries are considered only in B.
Table 7: Attainable Recovery from Testwork
| Product |
Grade |
Recovery |
Copper
(%) |
Cobalt
(ppm) |
Gold
(g/t) |
Silver
(g/t) |
Copper
(%) |
Cobalt
(%) |
Gold
(%) |
Silver
(%) |
| Head Grade |
0.21 |
132 |
0.34 |
2.9 |
– |
– |
– |
– |
| Copper-Gold Concentrate |
25 |
1160 |
12 |
68 |
80 |
30 |
66 |
53 |
| Cobalt-Pyrite Concentrate |
0.30 |
1605 |
2 |
8 |
5 |
48 |
23 |
15 |
| Combined Concentrates |
– |
– |
– |
– |
85 |
78 |
89 |
68 |
| Tailings |
0.05 |
40 |
0.05 |
1.0 |
15 |
22 |
11 |
32 |
Early metallurgical testwork comprised metallurgical characterization studies under standard laboratory conditions to demonstrate metals recoverability for inclusion in the estimate of CuEq. No attempt was made to optimize flotation conditions, and more advanced flotation testwork was not undertaken. Consequently, the reported metallurgical recoveries are considered conservative, and it is reasonable to expect improvement with further testwork.
A2, assumes improved copper and gold recoveries of 89% and 75%, respectively, reflecting expected performance from comparable Cu-Au porphyry flotation circuits following further optimization and testwork.
Table 8 summarizes the recoveries assumption on each scenario.
Table 8: Net Recovery for Each Scenario
| Net Recovery |
Scenario A1 |
Scenario A2 |
Scenario B |
| Cu Recovery |
80% |
89% |
85% |
| Au Recovery |
66% |
75% |
89% |
| Ag Recovery |
53% |
53% |
68% |
| Co Recovery |
30% |
30% |
78% |
CAPITAL COST SUMMARY
Table 9 presents the estimated capital cost breakdown for the three evaluated scenarios, separating initial CAPEX from sustaining CAPEX and reporting costs in C$M by major cost area (processing plant, mining, pre-stripping, infrastructure, tailings and water management, Indirects/EPCM, and contingency).
Total initial CAPEX is estimated at C$3,552 million (A1), C$3,601 million (A2), and C$3,828 million (B), reflecting the higher processing plant scope and associated indirects/contingency in Scenario B.
Total sustaining CAPEX is estimated at C$2,755 million (A1/A2) and C$4,006 million (B), with the increase in B driven primarily by the inclusion of the hydrometallurgical plant and scandium recovery circuit within sustaining capital, while mining, infrastructure, and tailings sustaining components remain broadly consistent across scenarios
Table 9: Capital Cost Summary
| Capital Cost Summary |
Unit |
Scenario A1 |
Scenario A2 |
Scenario B |
| Initial Capex |
|
|
|
|
| Processing Plant (Excl. Hydrometallurgical Plant) |
C$M |
1,609 |
1,645 |
1,810 |
| Mining CAPEX |
C$M |
394 |
394 |
394 |
| Mining Pre-Stripping |
C$M |
97 |
97 |
97 |
| Infrastructure (Power/Water/Roads/Camp)[14] |
C$M |
326 |
326 |
326 |
| Tailings And Water Management |
C$M |
157 |
157 |
157 |
| Indirects + EPCM |
C$M |
258 |
262 |
278 |
| Contingency (25%) |
C$M |
710 |
720 |
766 |
| Total initial CAPEX |
C$M |
3,552 |
3,601 |
3,828 |
| Sustaining CAPEX |
|
|
|
|
| Processing Plant (Inc. Hydrometallurgical Plant) |
C$M |
285 |
285 |
1,194 |
| Mining CAPEX |
C$M |
811 |
811 |
811 |
| Infrastructure (Power/Water/Roads/Camp) |
C$M |
63 |
63 |
63 |
| Tailings and Water Management |
C$M |
1,065 |
1,065 |
1,065 |
| Indirects + EPCM |
C$M |
142 |
142 |
233 |
| Contingency (25%) |
C$M |
390 |
390 |
640 |
| Total Sustaining CAPEX |
C$M |
2,755 |
2,755 |
4,006 |
| Closure and Reclamation |
C$M |
503 |
503 |
503 |
OPERATING COST SUMMARY
Table 10 summarizes the key operating cost and selling terms used in the PEA, reporting unit costs in C$/t moved, C$/t milled, and (where applicable) C$/kg of scandium oxide, together with concentrate transport and selling costs, TC/RC, and payability assumptions.
Average site operating costs are estimated at C$16.22/t milled for Scenario A (concentrate-only) and C$22.96/t milled for B, with the increase in B driven by the addition of hydrometallurgical processing and acid generation (C$3.09/t milled) and scandium oxide processing costs (C$939.55/kg Sc₂O₃).
On a payable metal basis, the study reports C1 cash costs of C$2.4/lb CuEq (A1), C$2.39/lb CuEq (A2), and C$2.89/lb CuEq (B) and AISC of C$2.79/lb CuEq (A1), C$2.78/lb CuEq (A2), and C$3.39/lb CuEq (B), reflecting the combined effects of recoveries, co-product/by-product credits, and the additional operating requirements of the full circuit.
Table 10: Operating Cost Summary[15]
| Operating Cost Summary |
Units |
Value |
| Average Mining Cost |
C$/t-moved |
2.32 |
| Processing Cost – Up to Concentrate production (Scenario A) |
C$/t-milled |
7.93 |
| Hydrometallurgical + Acid Generation (Scenario B) |
C$/t-milled |
3.08 |
| Scandium Oxide processing (Scenario B) |
C$/Kg Sc2O3 |
939.55 |
| G&A |
C$/t-milled |
2.56 |
| Total Operating Cost |
C$/t-milled |
22.96 |
| Cu-Au concentrate product |
|
|
| Transport and selling |
C$/DMT |
95.90 |
| TC Cu-Au Concentrate |
C$/DMT |
77.00 |
| Refining Cost- Cu |
C$/lb |
0.11 |
| Refining Cost- Au |
C$/oz |
6.85 |
| Refining Cost- Ag |
C$/oz |
0.48 |
| Refining Cost- Co |
C$/lb |
0.16 |
| Payable – Cu |
% |
97 |
| Payable – Au |
% |
95 |
| Payable – Ag |
% |
90 |
| Payable – Co |
% |
80 |
| Metal Production on-site (Scenario B) |
|
|
| Payable – Au |
% |
97 |
| Payable – Ag |
% |
97 |
| Payable – Co |
% |
97 |
| C1 / cash cost (Scenario A1/A2/B) |
US$/lb CuEq payable |
1.75 / 1.74 / 2.11 |
| AISC (Scenario A1/A2/B) |
US$/lb CuEq payable |
2.04 / 2.03 / 2.47 |
ECONOMIC RESULTS
Table 11 summarizes the key economic assumptions and resulting financial metrics for Scenarios A1, A2, B, including the long-term price deck, cash flow generation, taxation, and discounted valuation at a 5% discount rate. Using an exchange rate of 1.37 CAD: 1.00 USD and long-term prices of US$4.88/lb Cu, US$3,272.60/oz Au, US$50.22/oz Ag, and US$19.57/lb Co (and US$1,500/kg Sc₂O₃ for B), the Project generates average annual EBITDA of C$886 million (A1), C$1,071 million (A2), and C$1,242 million (B). On a post-tax basis, NPV(5%) is estimated at C$4,963 million (A1), C$6,727 million (A2), and C$6,937 million (B) with corresponding post-tax IRRs of 19%, 23%, and 19%, and post-tax payback in Year 6 (A1), Year 5 (A2), and Year 7 (B). Total post-tax free cash flow is estimated at C$10,050 million (A1), C$12,961 million (A2), and C$14,763 million (B), reflecting the higher cash generation under the improved recovery case (A2) and the additional revenue streams in Scenario B, partially offset by the added capital and operating requirements of the hydrometallurgical and scandium circuits.
Table 11: Financial Metrics Consensus Metal Prices
| Metric |
Unit |
Scenario A1 |
Scenario A2 |
Scenario B |
| Financial Metrics |
| Exchange Rate |
CAD/USD |
1.37 |
| Long Term Copper Price |
US$/lb |
4.88 |
| Long Term Gold Price |
US$/oz |
3,272.60 |
| Long Term Silver Price |
US$/oz |
50.22 |
| Long Term Cobalt Price |
US$/lb |
19.57 |
| Long Term Scandium Oxide Price |
US$/kg |
N/A |
1,500 |
| Average Annual EBITDA |
C$M |
886 |
1,071 |
1,242 |
| Total EBITDA |
C$M |
22,162 |
26,770 |
31,041 |
| Average Annual Free Cash Flow (Pre-tax) |
C$M |
756 |
940 |
1,061 |
| Free Cash Flow (Pre-tax)[16] |
C$M |
18,904 |
23,511 |
26,532 |
| Total Provincial Tax (Including BC Mineral Tax) |
C$M |
(4,029) |
(5,090) |
(5,772) |
| Total Federal Tax |
C$M |
(1,274) |
(1,859) |
(2,170) |
| Total Taxes |
C$M |
(5,303) |
(6,949) |
(7,942) |
| Average Annual Free Cash Flow (Post-tax) |
C$M |
544 |
662 |
744 |
| Free Cash Flow (Post-tax)15 |
C$M |
13,601 |
16,562 |
18,591 |
| Total Free Cash Flow (Pre-tax)[17] |
C$M |
15,352 |
19,910 |
22,704 |
| Total Free Cash Flow (Post-tax)17 |
C$M |
10,050 |
12,961 |
14,763 |
| NPV 5% (Pre-Tax) |
C$M |
7,883 |
10,576 |
11,043 |
| NPV 5% (Pre-Tax) |
US$M |
5,754 |
7,720 |
8,061 |
| IRR (Pre-Tax) |
% |
24 |
29 |
23 |
| Payback (Pre-Tax) |
years |
Year 5 |
Year 4 |
Year 6 |
| NPV 5% (Post-Tax) |
C$M |
4,963 |
6,727 |
6,937 |
| NPV 5% (Post-Tax) |
US$M |
3,623 |
4,911 |
5,064 |
| IRR (Post-Tax) |
% |
19 |
23 |
19 |
| Payback (Post-Tax) |
years |
Year 6 |
Year 5 |
Year 7 |
Table 12 summarizes the key economic assumptions and resulting financial metrics for A1, A2, B, using spot metal prices.
Table 12: Financial Metrics, Spot Metal Prices
| Metric |
Unit |
Scenario A1 |
Scenario A2 |
Scenario B |
| Financial Metrics |
| Exchange Rate |
CAD/USD |
1.37 |
| Long Term Copper Price |
US$/lb |
6.00 |
| Long Term Gold Price |
US$/oz |
5,200.00 |
| Long Term Silver Price |
US$/oz |
90.00 |
| Long Term Cobalt Price |
US$/lb |
25.54 |
| Long Term Scandium Oxide Price |
US$/kg |
N/A |
1,500 |
| Average Annual EBITDA |
C$M |
1,514 |
1,775 |
2,053 |
| Total EBITDA |
C$M |
37,843 |
44,376 |
51,331 |
| Average Annual Free Cash Flow (Pre-Tax) |
C$M |
1,383 |
1,645 |
1,873 |
| Free Cash Flow (Pre-Tax)16 |
C$M |
34,585 |
41,118 |
46,822 |
| Total Provincial Tax (Includes BC Mineral Tax) |
C$M |
(7,657) |
(9,163) |
(10,484) |
| Total Federal Tax |
C$M |
(3,328) |
(4,166) |
(4,825) |
| Total Taxes |
C$M |
(10,985) |
(13,329) |
(15,309) |
| Average Annual Free Cash Flow (Post-Tax) |
C$M |
944 |
1,112 |
1,261 |
| Free Cash Flow (Post-Tax)16 |
C$M |
23,600 |
27,789 |
31,513 |
| Total Free Cash Flow (Pre-Tax)17 |
C$M |
31,033 |
37,517 |
42,994 |
| Total Free Cash Flow (Post-Tax)17 |
C$M |
20,048 |
24,188 |
27,685 |
| NPV 5% (Pre-Tax) |
C$M |
17,230 |
21,073 |
22,734 |
| NPV 5% (Pre-Tax) |
US$M |
12,577 |
15,382 |
16,594 |
| IRR (Pre-Tax) |
% |
43 |
50 |
40 |
| Payback (Pre-Tax) |
years |
Year 3 |
Year 3 |
Year 3 |
| NPV 5% (Post-Tax) |
C$M |
11,047 |
13,526 |
14,515 |
| NPV 5% (Post-Tax) |
US$M |
8,064 |
9,873 |
10,595 |
| IRR (Post-Tax) |
% |
34 |
39 |
32 |
| Payback (Post-Tax) |
years |
Year 3 |
Year 3 |
Year 4 |
SENSITIVITY ANALYSIS
Sensitivity cases were evaluated for the key value drivers using after-tax NPV (5%) and after-tax IRR, including ±20% copper and gold prices, +20% initial capital, +20% operating costs and, for B, a ±40% scandium price sensitivity.
Table 13: Sensitivity Summary (After-Tax NPV(5%) and IRR)
| Variable |
Case
(%) |
Metal Price |
Scenario A1 |
Scenario A2 |
Scenario B |
NPV (5%)
(C$M) |
IRR
(%) |
NPV (5%)
(C$M) |
IRR
(%) |
NPV (5%)
(C$M) |
IRR
(%) |
| Base Case |
|
Consensus forecast |
4,963 |
19 |
6,727 |
23 |
6,937 |
19 |
| Copper Price |
-20 |
US$3.90/lb Cu |
3,218 |
15 |
4,807 |
19 |
5,094 |
15 |
| Copper Price |
+20 |
US$5.86/lb Cu |
6,688 |
23 |
8,632 |
28 |
8,764 |
22 |
| Gold Price |
-20 |
US$2,618.08/oz |
3,625 |
16 |
5,223 |
19 |
5,201 |
16 |
| Gold Price |
+20 |
US$3,927.12/oz |
6,289 |
22 |
8,222 |
27 |
8,661 |
22 |
| Metal Prices |
-20 |
All metal prices |
1,708 |
10 |
3,165 |
14 |
2,650 |
11 |
| Metal Prices |
+20 |
All metal prices |
8,118 |
27 |
10,233 |
32 |
11,110 |
26 |
| Initial CAPEX |
+20 |
Variable per Scenario |
4,448 |
16 |
6,222 |
19 |
6,394 |
16 |
| OPEX |
+20 |
Variable per Scenario |
3,660 |
16 |
5,438 |
20 |
5,185 |
16 |
| Scandium Oxide Price |
-40 |
US$900/kg Sc2O3 |
|
|
|
|
6,159 |
18 |
| Scandium Oxide Price |
+40 |
US$2,100/kg Sc2O3 |
|
|
|
|
7,714 |
20 |
Overall, the sensitivity analysis demonstrates that the Project’s after-tax economics remain positive across the tested ranges, with the greatest variability in after-tax NPV(5%) and IRR driven by simultaneous changes in the overall metal price deck. Changes to copper and gold prices individually have a meaningful but smaller effect, while +20% initial CAPEX and +20% OPEX reduce value but do not eliminate Project attractiveness in any of the evaluated scenarios. Scenario B shows additional exposure to scandium oxide price, with after-tax NPV(5%) varying within a narrower range relative to the broader multi-metal price cases, indicating that scandium provides incremental upside while the base-case Cu-Au Project remains financially robust on its own.
PERMITTING, RISKS, AND NEXT STEPS
Permitting and Environmental
Permitting Status
The permitting process will be supported by the continuation of environmental baseline studies, progression of engineering designs, and the initiation of socio-economic and cultural baseline studies.
Due to the anticipated rate of resource extraction, it is expected that the Hat Project will be subject to both federal and provincial impact assessment pathways, so submission to both the Impact Assessment Agency of Canada (IAAC) and British Columbia Environmental Assessment Office (B.C. EAO) for their review is currently anticipated. Agency determination will decide the appropriate level of agency collaboration under the existing cooperation agreement for the Hat Project to acquire a provincial Environmental Assessment Certificate (EAC) and/or federal Decision Statement.
The company will also submit a Joint Mines Act and Environmental Management Act Application through the B.C. Major Mines Office. Additional federal authorizations, including Fisheries Act approvals and compliance with Metal and Diamond Mines Effluent Regulations (MDMER), and applicable provincial permits will be obtained concurrently with other assessment and permitting steps. This will not only support protection of the immediate environment through the life of the Project but also respect the rights of First Nations and promote social and economic wellbeing for local communities.
Tailings and Water Management
The Tailings Storage Facility (TSF) includes a perimeter dyke primarily constructed from compacted cycloned sand. This material will be sourced from the coarse underflow of tailings processed through an on-site cyclone plant. Using the centreline raise method, the dam is designed to be free-draining, lowering the phreatic surface to facilitate geotechnical stability. During operations, seepage from the TSF will be directed to the process plant as reclaim water. Upon closure, the supernatant pond will be drained, and the tailings and dam surfaces will be reclaimed with a granular trafficability layer, followed by a growth medium and native revegetation.
The water management strategy prioritizes the reuse of site-impacted water, directing TSF water, contact water from the waste rock storage facilities, and open-pit dewatering to the process plant for use as make-up water.
Key Risks and Opportunities
Project-wide
- Tailings Storage Facility:
- The location and geometry of the TSF are subject to refinement following geotechnical investigations of the potential site areas. Similarly, the anticipated availability of cycloned sand and the storage requirements for the facility may be adjusted once laboratory testing of the tailings is conducted.
- The integration of this future site-specific data presents a significant opportunity to optimize the TSF design.
- Mineral Processing:
- Limited metallurgical and comminution data introduce uncertainty in equipment sizing and operating cost inputs; however, early results indicate the ore should be amenable to conventional Cu-Au flotation, with potential upside from improved recoveries and reduced reagent consumption through optimization.
- The scandium circuit is less mature and is sensitive to acid economics and hydrometallurgical performance, but offers meaningful value upside if recoveries, product quality, and operating stability are confirmed at larger scale.
- Mine Design:
- Pit slope design criteria and mine scheduling are subject to elevated uncertainty due to the limited geotechnical database, including incomplete definition of structural controls, rock mass variability, and groundwater conditions. This creates downside risk to slope angles, strip ratio, and operating conditions if adverse structures or hydrogeology are encountered; however, it also provides a clear opportunity to materially improve design confidence and potentially optimize slope geometry, mine sequencing, and dewatering requirements through focused data acquisition and updated analyses.
- Capital Cost estimates:
- As a PEA-level estimate, capital costs remain subject to the inherent uncertainty of a preliminary design basis and limited engineering definition; however, significant effort was undertaken to develop the estimate using a defined scope, preliminary equipment sizing, and factored/benchmark-based costing with appropriate indirects and contingency. This work provides a credible foundation for decision-making at this stage while also highlighting clear opportunities to optimize capital intensity through further engineering definition, value engineering, and targeted trade-off studies (e.g., comminution configuration, tailings strategy, infrastructure/power, and construction execution approach).
- Scandium specific:
- Scandium provides strategic upside given its small, concentrated global supply base and the growing premium placed on secure, qualified supply, but it carries higher execution and commercial risk due to limited scale-up testwork (variability, impurity control, reagent intensity), added residue-management and permitting complexity, and uncertainty around product specifications, pricing, and customer qualification.
Next Steps
- Resource:
- The Company is advancing the Project toward Pre-Feasibility by upgrading confidence in the current Mineral Resource estimate and improving definition of mineralization within the proposed mine plan area. The program will prioritize infill drilling to support conversion of Inferred Resources to Indicated (and, where appropriate, Measured), together with step-out drilling to test extensions of known mineralization and provide improved geological continuity for next-stage mine design, scheduling, and economic evaluation.
- Waste facilities:
- Field investigations will be conducted at potential TSF and waste rock storage sites to characterize subsurface conditions and identify suitable borrow materials for construction. These efforts will be supported by site-specific geotechnical and geochemical characterization of the tailings and waste rock. These data sets will inform a TSF design update to a Pre-Feasibility Study (PFS) level of engineering, encompassing an optimized siting and technology trade-off study.
- Metallurgy:
- Complete a comprehensive metallurgical testwork program on representative samples including comminution testwork (Bond Work Index, abrasion index, and related grindability tests) and metallurgical variability + locked-cycle flotation testing to define an optimal process flowsheet, mass balance, and optimized reagent scheme, and to produce samples for concentrate dewatering and preliminary smelter marketing.
- Progress the scandium work through targeted hydrometallurgical optimization including pulp density, free acidity/acid consumption, SX staging and extractant concentration, followed by an integrated pilot trial on bulk samples to validate scandium recovery, product quality, and circuit operability.
- Mine Design:
- A phased geotechnical program is recommended that includes re-analysis of existing boreholes (re-logging and detailed structural mapping, including oriented-core interpretation where available), establishment of geotechnical domains, targeted drilling and field mapping to confirm discontinuity sets and persistence, and hydrogeological data collection to constrain pore pressures and inflows. These data will support updated kinematic assessments and slope design analyses, refinement of inter-ramp and overall slope angles, and improved inputs to mine planning, risk management measures, and capital/operating cost estimates.
- Capital Costs Estimation:
- As the Project advances to PFS, the estimate will be progressively refined by advancing engineering to a higher level of definition, updating quantities and vendor inputs for major equipment and packages, tightening indirects and construction productivity assumptions, and executing focused optimization and constructability reviews to reduce contingency and improve overall cost confidence.
NI 43-101 DISCLOSURE, QUALIFIED PERSONS, AND CAUTIONARY STATEMENTS
Qualified Persons
The scientific and technical information in this news release has been reviewed and approved by the following Qualified Persons (as defined under NI 43-101):
- Tomasz Wawruch, FAusIMM, Senior Geology and Mineral Resource Consultant of Mineit Consulting Inc. (responsible for the Mineral Resource estimate).
- Andrew Carter, EUR ING, B.Sc., CEng., MIMMM (QMR), MSAIMM, SME, of Magister Metallurgy (responsible for metallurgical studies and recovery processes).
- Shervin Teymouri, P.Eng., Mining Engineer of Mineit Consulting Inc. (responsible for project management, mining engineering, capital and operating cost estimates, and financial analysis).
- Andre de Ruijter, P.Eng., Mineit Consulting Inc, Process Engineer (process design, process capital and operating cost lead).
- Franky Li, P.Eng., EMM Consulting Pty Ltd (responsible for tailings management and TSF design, tailings capital and operating cost)
- Jayesh Rami, P.Eng., Infrastructure Engineer of Sacre-Davey Engineering Inc. (responsible for project infrastructure)
Preliminary Economic Assessment Cautionary Statement
The Preliminary Economic Assessment (PEA) for the Hat Project is preliminary in nature and includes Inferred Mineral Resources that are considered too speculative geologically to have economic considerations applied to them that would enable them to be categorized as Mineral Reserves. Mineral Resources that are not Mineral Reserves do not have demonstrated economic viability. The PEA provides a conceptual mine plan and is based on low-level technical and economic assessments that are insufficient to support an evaluation of the economic viability of the Project or to establish Mineral Reserves. There is no certainty that the results of the PEA will be realized. Further exploration and site-specific engineering studies are required before a higher level of confidence can be established for the Project’s economics.
The economic analysis in the PEA is based on several assumptions including, but not limited to, long-term metal prices, foreign exchange rates, metallurgical recoveries, and capital and operating cost estimates. These assumptions are subject to significant risks and uncertainties, and actual results may differ materially from those projected. Readers are cautioned not to place undue reliance on the PEA or the forward-looking information contained in this release.
Forward-Looking Information
Certain of the statements made and information contained herein may constitute “forward-looking information” within the meaning of applicable Canadian securities laws. Often, these forward-looking statements can be identified using words such as “anticipates,” “believes,” “continue,” “estimates,” “expects,” “forecasts,” “intends,” “plans,” “projected,” or the negatives thereof or variations of such words and phrases. Forward-looking statements in this news release include, but are not limited to, statements with respect to: the results of the Preliminary Economic Assessment for the Hat Project; the estimation of mineral resources; anticipated annual production of copper, gold, cobalt, and scandium; the after-tax NPV and IRR of the Project; forecasted AISC and Total Cash Costs; estimated initial and sustaining capital costs; the timing of a Pre-Feasibility Study; the timeline for permitting milestones and construction decisions; planned early works and infrastructure upgrades; and the Company’s ability to maintain strong community and First Nations partnerships.
Forward-looking statements are based on a number of assumptions that management considers reasonable at the time they are made, including assumptions regarding: the future prices of copper, gold, cobalt, and scandium; foreign exchange rates; metallurgical recoveries; the cost of essential consumables; and the geopolitical and regulatory climate in British Columbia. However, such statements involve known and unknown risks and uncertainties which may cause actual results to differ materially. These risks include but are not limited to inaccurate estimation of mineral resources; volatility in metal prices; the results of future exploration and development activities; liquidity and financing risks; failure to obtain necessary permits; geotechnical conditions; and changes in applicable mining laws. The PEA is preliminary in nature and includes Inferred mineral resources that are considered too speculative geologically to have economic considerations applied to them that would enable them to be categorized as mineral reserves. Except as required by law, the Company undertakes no obligation to update or revise forward-looking information as conditions change.
Non-GAAP Financial Measures
The Company has included certain performance measures in this news release that are not specified, defined, or determined under Generally Accepted Accounting Principles (GAAP). These non-GAAP measures are common in the mining industry but do not have standardized definitions and may not be comparable to similar measures presented by other issuers. Readers should not consider these measures in isolation or as a substitute for performance measures prepared in accordance with GAAP.
- Total Cash Costs: The Company calculates total cash costs as the sum of mining, processing, refining and transport, G&A, and royalty costs. Cash costs per unit are calculated by dividing the total cash costs by the payable Copper Equivalent (CuEq) units.
- All-In Sustaining Cost: AISC is a non-GAAP financial measure comprising of total cash costs, sustaining capital expenditures to support ongoing operations, and closure costs. AISC per unit is calculated by dividing the total all-in sustaining costs by the payable CuEq units.
- Sustaining Capital: This is a supplementary financial measure reflecting cash-basis expenditures expected to maintain operations and sustain production levels over the life of the mine.
About Doubleview Gold Corp.
Doubleview Gold Corp., a mineral resource exploration and development company based in Vancouver, British Columbia, Canada, is publicly traded on the TSX Venture Exchange [TSX-V: DBG], the OTCQB [DBLVF], the Berlin Stock Exchange [GER: A1W038], and the Frankfurt Stock Exchange [1D4]. Doubleview identifies, acquires, and finances precious and basemetal exploration projects in North America, particularly in British Columbia. The Company increases shareholder value through the acquisition and exploration of quality gold, copper, cobalt, scandium, and silver properties-collectively critical minerals-and through the application of advanced, state-of-the-art exploration methods. Doubleview’s portfolio of strategic properties provides diversification and mitigates investment risk.
About Mineit Consulting Inc.
Mineit Consulting Inc. (Mineit) is an independent mining engineering consulting company providing specialized expertise in project management, geological modelling, Mineral Resource estimation, mining engineering, metallurgical, and process engineering. Mineit lead and prepared the Hat Project MRE and PEA, with assistance from other engineering firms, for the Hat Project in accordance with the Canadian Institute of Mining, Metallurgy and Petroleum (CIM) Definition Standards on Mineral Resources and Reserves.
For further information please contact:
Doubleview Gold Corp
Vancouver, BC
Farshad Shirvani
President & CEO
Institutional Line: (604) 607-5470
T: (604) 678-9587
E: corporate@doubleview.ca
NEITHER TSX VENTURE EXCHANGE NOR ITS REGULATION SERVICES PROVIDER (AS THAT TERM IS DEFINED IN THE POLICIES OF THE TSX VENTURE EXCHANGE) ACCEPTS RESPONSIBILITY FOR THE ADEQUACY OR ACCURACY OF THIS RELEASE.
Certain of the statements made and information contained herein may constitute “forward-looking information.” In particular references to the Mineral Resource Estimate and future work programs or expectations on the quality or results of such work programs are subject to risks associated with operations on the property, exploration activity generally, equipment limitations and availability, as well as other risks that we may not be currently aware of. Accordingly, readers are advised not to place undue reliance on forward-looking information. Except as required under applicable securities legislation, the Company undertakes no obligation to publicly update or revise forward-looking information, whether as a result of new information, future events or otherwise.
[1] Early metallurgical testwork comprised metallurgical characterization studies under standard laboratory condition to demonstrate metals recoverability for inclusion in the estimate of Cu(eq). No attempt was made to optimize flotation conditions and more advanced flotation testwork was not undertaken. Consequently, the reported metallurgical recoveries are considered conservative and it’s reasonable to expect improvement with further testwork.
[2] Analyst consensus prices as of February 20, 2026: Au US$3.272/oz; Cu US$4.88/lb; Ag US$50.22/oz; Co US$19.57/lb; Sc2O3 US$1,500/kg.
[3] Spot prices as of February 25, 2026: Au US$5,200/oz; Cu US$6.00/lb; Ag US$90.00/oz; Co US$25.50/lb; Sc2O3 US$1,500/kg.
[4] CuEq calculations do not include scandium.
[5] Scandium tonnages represent 12.5% of the mineralized material by category, reflecting the proportion of tailings expected to be processed through a dedicated scandium leach circuit under current metallurgical design constraints. Scandium oxide metal content has been calculated using the metallurgical recovery of 72% and conversion factor from Sc to Sc2O3 of 1.534. The full scandium content has not been taken into economic evaluation at this time, as current market pricing for scandium lacks sufficient transparency and firmness to support a reliable valuation. Additional scandium in future assessments is considerable upon receipt of binding purchase commitments that establish a defined price. Until such time, scandium reporting to tailings may be preserved for potential recovery when market conditions in North America or Europe provide clearer price visibility.
[6] Scandium not used for CuEq calculation.
[7] CuEq grade calculation assumes metal process of Copper US$4.80/lb, Gold US$3200/troy oz, Silver US$46/troy oz, Cobalt US$20/lb. The CuEq formula is: CuEq = [(((Ag × 46.0 × 0.68)/31.1035) + ((Au × 3200 × 0.89)/31.1035) + 0.0001 × (Co × 20.0 × 0.78 × 22.0462) + 0.0001 × (Cu × 4.8 × 22.0462 × 0.85))/(4.8 × 22.0462 × 0.85)].
[8] Hydrometallurgical and Scandium circuit to be constructed after production of copper concentrate starts. Recovery reported consider the complete processing circuit is operational.
[9] Scandium tonnages represent 12.5% of the mineralized material by category, reflecting the proportion of tailings expected to be processed through a dedicated scandium leach circuit under current metallurgical design constraints
[10] Processing cost of C$7.93/t-milled for up to concentrate production, and additional C$3.08/t-milled for hydrometallurgical and acid generation plant for Scandium processing. Energy price C$0.07/kWh assuming grid power.
[11] Treatment cost to produce Scandium Oxide from the tailings, without considering acid cost (produced on site).
[12] Free Cash Flow during production periods only.
[13] Total life of mine Free Cash Flow, including initial capital costs and closure.
[14] Capital cost estimate Infrastructure includes the required power infrastructure include the extension of the transmission line (~150 km), switching stations and mine main substations (~C$140 million).
[15] Energy price C$0.07/kWh assuming grid power.
[16] Free Cash Flow during production periods only.
[17] Total life of mine Free Cash Flow, including initial capital costs and closure.
The issuer is solely responsible for the content of this announcement.