Home Blog Page 884

Yatsen Announces Fourth Quarter and Full Year 2025 Financial Results

Conference Call to Be Held at 7:30 A.M. U.S. Eastern Time on March 2, 2026

GUANGZHOU, China, March 2, 2026 /PRNewswire/ — Yatsen Holding Limited (“Yatsen” or the “Company”) (NYSE: YSG), a leading China-based beauty group, today announced its unaudited financial results for the fourth quarter and full year ended December 31, 2025.

Fourth Quarter and Full Year 2025 Highlights

  • Total net revenues for the fourth quarter of 2025 increased by 20.1% to RMB1.38 billion (US$197.3 million) from RMB1.15 billion for the prior year period. Total net revenues for the full year of 2025 increased by 26.7% to RMB4.30 billion (US$614.6 million) from RMB3.39 billion for the prior year period.
  • Total net revenues from Skincare Brands[1] for the fourth quarter increased by 51.9% to RMB842.8 million (US$120.5 million) from RMB554.8 million for the prior year period. As a percentage of total net revenues, total net revenues from Skincare Brands for the fourth quarter of 2025 were 61.1%, as compared with 48.3% for the prior year period. Total net revenues from Skincare Brands for the full year of 2025 increased by 63.5% to RMB2.28 billion (US$325.7 million) from RMB1.39 billion for the prior year period. As a percentage of total net revenues, total net revenues from Skincare Brands for the full year of 2025 were 53.0%, as compared with 41.1% for the prior year period.
  • Gross margin for the fourth quarter of 2025 was 77.7%, remaining largely flat as compared with 77.8% for the prior year period. Gross margin for the full year of 2025 increased to 78.2% from 77.1% for the prior year period.
  • Net income for the fourth quarter of 2025 was RMB3.0 million (US$0.4 million), as compared with a net loss of RMB378.8 million for the prior year period. Net loss for the full year of 2025 decreased by 87.0% to RMB92.4 million (US$13.2 million) from RMB710.2 million for the prior year period. Non-GAAP net income[2] for the fourth quarter of 2025 was RMB41.2 million (US$5.9 million), as compared with RMB107.0 million for the prior year period. Non-GAAP net income for the full year of 2025 was RMB8.4 million (US$1.2 million), as compared with non-GAAP net loss of RMB128.2 million for the prior year period.

Mr. Jinfeng Huang, Founder, Chairman and Chief Executive Officer of Yatsen, stated, “We are pleased to conclude 2025 with solid performances, demonstrating the long-term value of our strategic transformation. Throughout the year, we remained steadfast in our commitment to three core initiatives: driving R&D-led product innovation, strengthening brand equity across our multi-brand portfolio, and improving our overall profitability. As we enter 2026, we remain confident that these foundational strengths will drive sustainable growth and create lasting value for our shareholders.” 

Mr. Donghao Yang, Director and Chief Financial Officer of Yatsen, commented, “Our recent financial results mark a pivotal milestone in our journey toward sustainable growth. For the fourth quarter, we are proud to have achieved net income and non-GAAP net income, alongside total net revenue growth. For the full year of 2025, we achieved year-over-year revenue growth, substantially narrowed our net loss, and achieved a non-GAAP net income turnaround. This success underscores the robust health of our brand portfolio as well as our improved operational efficiency. Looking ahead, we will continue to prioritize financial stability and strategic resource allocation to ensure Yatsen is well-positioned for long-term success.”

Fourth Quarter 2025 Financial Results

Net Revenues

Total net revenues for the fourth quarter of 2025 increased by 20.1% to RMB1.38 billion (US$197.3 million) from RMB1.15 billion for the prior year period. The increase was primarily due to a 51.9% year-over-year increase in net revenues from Skincare Brands, partially offset by a 9.1% year-over-year decrease in net revenues from Color Cosmetics Brands.[3]

Gross Profit and Gross Margin

Gross profit for the fourth quarter of 2025 increased by 20.0% to RMB1.07 billion (US$153.2 million) from RMB893.0 million for the prior year period. Gross margin for the fourth quarter of 2025 was 77.7%, remaining largely flat as compared with 77.8% for the prior year period.

Operating Expenses

Total operating expenses for the fourth quarter of 2025 decreased by 15.6% to RMB1.08 billion (US$155.0 million) from RMB1.28 billion for the prior year period. As a percentage of total net revenues, total operating expenses for the fourth quarter of 2025 were 78.6%, as compared with 111.8% for the prior year period.

  • Fulfillment Expenses. Fulfillment expenses for the fourth quarter of 2025 were RMB77.0 million (US$11.0 million), as compared with RMB63.5 million for the prior year period. As a percentage of total net revenues, fulfillment expenses for the fourth quarter of 2025 were 5.6% as compared with 5.5% for the prior year period, remaining largely flat.
  • Selling and Marketing Expenses. Selling and marketing expenses for the fourth quarter of 2025 were RMB893.8 million (US$127.8 million), as compared with RMB690.6 million for the prior year period. As a percentage of total net revenues, selling and marketing expenses for the fourth quarter of 2025 increased to 64.8% from 60.1% for the prior year period. The increase was primarily driven by higher traffic acquisition costs amid intensified competition during the Double 11 shopping festival.
  • General and Administrative Expenses. General and administrative expenses for the fourth quarter of 2025 were RMB74.4 million (US$10.6 million), as compared with RMB100.1 million for the prior year period. As a percentage of total net revenues, general and administrative expenses for the fourth quarter of 2025 decreased to 5.4% from 8.7% for the prior year period. The decrease was primarily driven by lower payroll expenses and share-based compensation expenses, coupled with the leveraging effect of higher total net revenues in the fourth quarter of 2025.
  • Research and Development Expenses. Research and development expenses for the fourth quarter of 2025 were RMB38.8 million (US$5.5 million), as compared with RMB26.3 million for the prior year period. As a percentage of total net revenues, research and development expenses for the fourth quarter of 2025 increased to 2.8% from 2.3% for the prior year period. The increase was primarily driven by higher payroll expenses resulting from a rise in research and development headcount.
  • Impairment of Goodwill. There was no impairment of goodwill for the fourth quarter of 2025, as compared with an impairment of goodwill of RMB403.1 million for the prior year period. Based on our assessment, no impairment indicators were identified as of December 31, 2025.

Loss / Income from Operations

Loss from operations for the fourth quarter of 2025 was RMB12.7 million (US$1.8 million), as compared with RMB390.7 million for the prior year period. Operating loss margin was 0.9%, as compared with 34.0% for the prior year period.

Non-GAAP income from operations[4] for the fourth quarter of 2025 was RMB11.8 million (US$1.7 million), as compared with RMB93.2 million for the prior year period. Non-GAAP operating income margin[5] was 0.9%, as compared with 8.1% for the prior year period.

Net Loss / Income

Net income for the fourth quarter of 2025 was RMB3.0 million (US$0.4 million), as compared with net loss of RMB378.8 million for the prior year period. Net income margin was 0.2%, as compared with net loss margin of 33.0% for the prior year period. Net income attributable to Yatsen’s ordinary shareholders per diluted ADS[6] for the fourth quarter of 2025 was RMB0.08 (US$0.01), as compared with net loss attributable to Yatsen’s ordinary shareholders per diluted ADS of RMB3.98 for the prior year period.

Non-GAAP net income for the fourth quarter of 2025 was RMB41.2 million (US$5.9 million), as compared with RMB107.0 million for the prior year period. Non-GAAP net income margin was 3.0%, as compared with 9.3% for the prior year period. Non-GAAP net income attributable to Yatsen’s ordinary shareholders per diluted ADS[7] for the fourth quarter of 2025 was RMB0.46 (US$0.07), as compared with RMB0.99 for the prior year period.

Full Year 2025 Financial Results

Total net revenues for the full year of 2025 increased by 26.7% to RMB4.30 billion (US$614.6 million) from RMB3.39 billion for the prior year period, primarily attributable to a 63.5% year-over-year increase in net revenues from Skincare Brands, combined with a 1.9% year-over-year increase in net revenues from Color Cosmetics Brands.

Gross profit for the full year of 2025 increased by 28.4% to RMB3.36 billion (US$480.7 million) from RMB2.62 billion for the prior year period. Gross margin for the full year of 2025 increased to 78.2% from 77.1% for the prior year period. The increase was primarily attributable to increasing sales of higher-gross margin products. 

Loss from operations for the full year of 2025 was RMB185.8 million (US$26.6 million), as compared with RMB824.9 million for the prior year period. Operating loss margin decreased to 4.3% from 24.3% for the prior year period, primarily because there was no impairment of goodwill for the full year of 2025.

Non-GAAP loss from operations for the full year of 2025 was RMB84.0 million (US$12.0 million), as compared with RMB224.3 million for the prior year period. Non-GAAP operating loss margin decreased to 2.0% from 6.6% for the prior year period.

Net loss for the full year of 2025 was RMB92.4 million (US$13.2 million), as compared with RMB710.2 million for the prior year period. Net loss margin decreased to 2.2% from 20.9% for the prior year period. Net loss attributable to Yatsen’s ordinary shareholders per diluted ADS for the full year of 2025 was RMB0.87 (US$0.12), as compared with RMB6.99 for the prior year period.

Non-GAAP net income for the full year of 2025 was RMB8.4 million (US$1.2 million), as compared with non-GAAP net loss of RMB128.2 million for the prior year period. Non-GAAP net income margin was 0.2%, as compared with non-GAAP net loss margin of 3.8% for the prior year period. Non-GAAP net income attributable to Yatsen’s ordinary shareholders per diluted ADS for the full year of 2025 was RMB0.19 (US$0.03), as compared with non-GAAP net loss attributable to Yatsen’s ordinary shareholders per diluted ADS of RMB1.26 for the prior year period.

Balance Sheet and Cash Flow

As of December 31, 2025, the Company had cash, restricted cash and short-term investments of RMB1.05 billion (US$150.7 million), as compared with RMB1.36 billion as of December 31, 2024.

Net cash used in operating activities for the fourth quarter of 2025 was RMB69.4 million (US$9.9 million), as compared with net cash generated from operating activities of RMB202.2 million for the prior year period. Net cash used in operating activities for the full year of 2025 was RMB94.7 million (US$13.5 million), as compared with RMB243.7 million for the prior year period.

Business Outlook

For the first quarter of 2026, the Company expects its total net revenues to be between RMB958.6 million and RMB1.08 billion, representing a year-over-year increase of approximately 15% to 30%. These forecasts reflect the Company’s current and preliminary views on the market and operational conditions, which are subject to change.

Exchange Rate

This announcement contains translations of certain Renminbi (“RMB”) amounts into U.S. dollars (“US$”) at specified rates solely for the convenience of the reader. Unless otherwise noted, all translations from RMB to US$ were made at a rate of RMB6.9931 to US$1.00, the exchange rate in effect as of December 31, 2025, as set forth in the H.10 statistical release of The Board of Governors of the Federal Reserve System. The Company makes no representation that any RMB or US$ amounts could have been, or could be, converted into US$ or RMB, as the case may be, at any particular rate, or at all.

[1] Include net revenues from Galénic, DR.WU (its mainland China business), Eve Lom and other skincare brands of the Company.

[2] Non-GAAP net income (loss) is a non-GAAP financial measure. Non-GAAP net income (loss) is defined as net income (loss) excluding (i) share-based compensation expenses, (ii) amortization of intangible assets resulting from assets and business acquisitions, (iii) revaluation of investments on the share of equity method investments, (iv) impairment of goodwill, (v) impairment of investments and (vi) tax effects on non-GAAP adjustments.

[3] Include Perfect Diary, Little Ondine, Pink Bear and other color cosmetics brands of the Company.

[4] Non-GAAP income (loss) from operations is a non-GAAP financial measure. Non-GAAP income (loss) from operations is defined as income (loss) from operations excluding (i) share-based compensation expenses, (ii) amortization of intangible assets resulting from assets and business acquisitions and (iii) impairment of goodwill.

[5] Non-GAAP operating income (loss) margin is a non-GAAP financial measure, which is defined as non-GAAP net income (loss) from operations as a percentage of total net revenues.

[6] ADS refers to American depositary shares, each of which represents twenty Class A ordinary shares.

[7] Non-GAAP net income (loss) attributable to ordinary shareholders per diluted ADS is a non-GAAP financial measure. Non-GAAP net income (loss) attributable to ordinary shareholders per diluted ADS is defined as non-GAAP net income (loss) attributable to ordinary shareholders divided by the weighted average number of diluted ADS outstanding for computing diluted earnings per ADS. Non-GAAP net income (loss) attributable to ordinary shareholders is defined as net income (loss) attributable to ordinary shareholders excluding (i) share-based compensation expenses, (ii) amortization of intangible assets resulting from assets and business acquisitions, (iii) revaluation of investments on the share of equity method investments, (iv) impairment of goodwill, (v) impairment of investments, (vi) tax effects on non-GAAP adjustments and (vii) accretion to redeemable non-controlling interests.

Conference Call Information

The Company’s management will hold a conference call on Monday, March 2, 2026, at 7:30 A.M. U.S. Eastern Time or 8:30 P.M. Beijing Time to discuss its financial results and operating performance for the fourth quarter and full year 2025.

United States (toll free):

+1-888-346-8982

International:

+1-412-902-4272

Mainland China (toll free):

400-120-1203

Hong Kong, SAR (toll free):

800-905-945

Hong Kong, SAR:

+852-3018-4992

The replay will be accessible through Monday, March 9, by dialing the following numbers:

United States:

+1-855-669-9658

International:

+1-412-317-0088

Replay Access Code:         

2950633

A live and archived webcast of the conference call will also be available on the Company’s investor relations website at http://ir.yatsenglobal.com.

About Yatsen Holding Limited

Yatsen Holding Limited (NYSE: YSG) is a leading China-based beauty group with the mission of creating an exciting new journey of beauty discovery for consumers around the world. Founded in 2016, the Company has launched and acquired numerous color cosmetics and skincare brands including Perfect Diary, Little Ondine, Pink Bear, Galénic, DR.WU (its mainland China business) and Eve Lom. The Company’s flagship brand, Perfect Diary, is one of the leading color cosmetics brands in China in terms of retail sales value. The Company primarily reaches and engages with customers directly both online and offline, with expansive presence across all major e-commerce, social and content platforms in China.

For more information, please visit http://ir.yatsenglobal.com.

Use of Non-GAAP Financial Measures

The Company uses non-GAAP income (loss) from operations, non-GAAP operating income (loss) margin, non-GAAP net income (loss), non-GAAP net income (loss) margin, non-GAAP net income (loss) attributable to ordinary shareholders and non-GAAP net income (loss) attributable to ordinary shareholders per diluted ADS, each a non-GAAP financial measure, in reviewing and assessing its operating performance. The presentation of these non-GAAP financial measures is not intended to be considered in isolation or as a substitute for the financial information prepared and presented in accordance with U.S. GAAP. The Company presents these non-GAAP financial measures because they are used by the management to evaluate operating performance and formulate business plans. Non-GAAP financial measures help identify underlying trends in its business, provide further information about its results of operations, and enhance the overall understanding of its past performance and future prospects. The Company defines non-GAAP income (loss) from operations as income (loss) from operations excluding (i) share-based compensation expenses, (ii) amortization of intangible assets resulting from assets and business acquisitions and (iii) impairment of goodwill. Non-GAAP operating income (loss) margin is non-GAAP income (loss) from operations as a percentage of total net revenues. The Company defines non-GAAP net income (loss) as net income (loss) excluding (i) share-based compensation expenses, (ii) amortization of intangible assets resulting from assets and business acquisitions, (iii) revaluation of investments on the share of equity method investments, (iv) impairment of goodwill, (v) impairment of investments and (vi) tax effects on non-GAAP adjustments. Non-GAAP net income (loss) margin is non-GAAP net income (loss) as a percentage of total net revenues. The Company defines non-GAAP net income (loss) attributable to ordinary shareholders as net income (loss) attributable to ordinary shareholders excluding (i) share-based compensation expenses, (ii) amortization of intangible assets resulting from assets and business acquisitions, (iii) revaluation of investments on the share of equity method investments, (iv) impairment of goodwill, (v) impairment of investments, (vi) tax effects on non-GAAP adjustments and (vii) accretion to redeemable non-controlling interests. Non-GAAP net income (loss) attributable to ordinary shareholders per diluted ADS is computed using non-GAAP net income (loss) attributable to ordinary shareholders divided by weighted average number of diluted ADS outstanding for computing diluted earnings per ADS.

However, the non-GAAP financial measures have limitations as analytical tools as the non-GAAP financial measures are not presented in accordance with U.S. GAAP and may differ from the non-GAAP information used by other companies, including peer companies, and therefore their comparability may be limited. The Company compensates for these limitations by reconciling the non-GAAP financial measures to the nearest U.S. GAAP performance measure, all of which should be considered when evaluating performance. The Company encourages investors and others to review its financial information in its entirety and not rely on a single financial measure. Reconciliations of Yatsen’s non-GAAP financial measures to the most comparable U.S. GAAP measure are included at the end of this press release.

Safe Harbor Statement

This announcement contains statements that may constitute “forward-looking” statements which are made pursuant to the “safe harbor” provisions of the U.S. Private Securities Litigation Reform Act of 1995. These forward-looking statements can be identified by terminology such as “will,” “expects,” “anticipates,” “aims,” “future,” “intends,” “plans,” “believes,” “estimates,” “likely to,” and similar statements. The Company may also make written or oral forward-looking statements in its periodic reports to the Securities and Exchange Commission (“SEC”), in its annual report to shareholders, in press releases and other written materials and in oral statements made by its officers, directors or employees to third parties. Statements that are not historical facts, including statements about the Company’s beliefs, plans, outlook and expectations, are forward-looking statements. Forward-looking statements involve inherent risks and uncertainties. A number of factors could cause actual results to differ materially from those contained in any forward-looking statement, including but not limited to the following: the Company’s growth strategies; its future business development, results of operations and financial condition; its ability to continue to roll out popular products and maintain popularity of existing products; its ability to anticipate and respond to changes in industry trends and consumer preferences and behavior in a timely manner; its ability to attract and retain new customers and to increase revenues generated from repeat customers; its expectations regarding demand for and market acceptance of its products and services; its ability to integrate newly-acquired businesses and brands; trends and competition in and relevant government policies and regulations relating to China’s beauty market; changes in its revenues and certain cost or expense items; and general economic conditions globally and in China. Further information regarding these and other risks is included in the Company’s filings with the SEC. All information provided in this press release is as of the date of this press release, and the Company does not undertake any obligation to update any forward-looking statement, except as required under applicable law.

For investor and media inquiries, please contact:

Yatsen Holding Limited
Investor Relations
E-mail: ir@yatsenglobal.com


YATSEN HOLDING LIMITED

UNAUDITED CONDENSED CONSOLIDATED BALANCE SHEETS

(All amounts in thousands, except for share, per share data or otherwise noted)

December 31,

December 31,

December 31,

2024

2025

2025

RMB’000

RMB’000

USD’000

Assets

Current assets

Cash and cash equivalents

817,395

765,379

109,448

Restricted cash

42,117

6,023

Short-term investments

539,130

246,008

35,179

Accounts receivable, net

214,558

220,870

31,584

Inventories, net

386,054

508,730

72,747

Prepayments and other current assets

381,404

450,970

64,488

Amounts due from related parties

9,113

114

16

Total current assets

2,347,654

2,234,188

319,485

Non-current assets

Investments

664,579

653,560

93,458

Property and equipment, net

74,373

77,014

11,013

Goodwill, net

155,029

155,029

22,169

Intangible assets, net

559,708

537,509

76,863

Deferred tax assets

1,381

1,435

205

Right-of-use assets, net

147,501

173,915

24,870

Other non-current assets

20,642

14,332

2,049

Total non-current assets

1,623,213

1,612,794

230,627

Total assets

3,970,867

3,846,982

550,112

Liabilities, redeemable non-controlling interests and shareholders’ equity

Current liabilities

Accounts and notes payable

72,090

149,371

21,360

Advances from customers

19,574

28,821

4,121

Accrued expenses and other liabilities

460,143

348,700

49,863

Amounts due to related parties

28,884

21,262

3,040

Income tax payables

20,088

13,690

1,958

Lease liabilities due within one year

39,409

53,435

7,641

Total current liabilities

640,188

615,279

87,983

Non-current liabilities

Deferred tax liabilities

103,306

107,906

15,430

Deferred income-non current

14,832

Lease liabilities

109,526

123,157

17,611

Total non-current liabilities

227,664

231,063

33,041

Total liabilities

867,852

846,342

121,024

Redeemable non-controlling interests

50,984

1,337

191

Shareholders’ equity

Ordinary Shares (US$0.00001 par value; 10,000,000,000 ordinary shares authorized,
comprising of 6,000,000,000 Class A ordinary shares, 960,852,606 Class B ordinary shares
and 3,039,147,394 shares each of such classes to be designated as of December 31, 2024
and December 31, 2025; 2,096,600,883 Class A shares and 600,572,880 Class B ordinary
shares issued as of December 31, 2024 and December 31, 2025; 1,234,627,468 Class A
ordinary shares and 600,572,880 Class B ordinary shares outstanding as of December 31,
2024, 1,276,663,163 Class A ordinary shares and 600,572,880 Class B ordinary shares
outstanding as of December 31, 2025)

173

173

25

Treasury shares

(1,276,330)

(1,250,678)

(178,845)

Additional paid-in capital

12,273,767

12,296,367

1,758,357

Statutory reserve

28,147

31,527

4,508

Accumulated deficit

(8,057,297)

(8,141,545)

(1,164,225)

Accumulated other comprehensive income

86,866

74,760

10,693

Total Yatsen Holding Limited shareholders’ equity

3,055,326

3,010,604

430,513

Non-controlling interests

(3,295)

(11,301)

(1,616)

Total shareholders’ equity

3,052,031

2,999,303

428,897

Total liabilities, redeemable non-controlling interests and shareholders’ equity

3,970,867

3,846,982

550,112


YATSEN HOLDING LIMITED

UNAUDITED CONDENSED CONSOLIDATED STATEMENTS OF OPERATIONS

(All amounts in thousands, except for share, per share data or otherwise noted)

For the Three Months Ended December 31,

For the Year Ended December 31,

2024

2025

2025

2024

2025

2025

RMB’000

RMB’000

USD’000

RMB’000

RMB’000

USD’000

Total net revenues

1,148,522

1,379,443

197,258

3,393,414

4,298,124

614,624

Total cost of revenues

(255,536)

(308,105)

(44,058)

(776,236)

(936,780)

(133,958)

Gross profit

892,986

1,071,338

153,200

2,617,178

3,361,344

480,666

Operating expenses:

Fulfilment expenses

(63,517)

(77,025)

(11,014)

(216,540)

(253,926)

(36,311)

Selling and marketing expenses

(690,584)

(893,771)

(127,808)

(2,268,793)

(2,852,288)

(407,872)

General and administrative expenses

(100,122)

(74,443)

(10,645)

(444,373)

(303,628)

(43,418)

Research and development expenses

(26,345)

(38,788)

(5,547)

(109,287)

(137,296)

(19,633)

Impairment of goodwill

(403,076)

(403,076)

Total operating expenses

(1,283,644)

(1,084,027)

(155,014)

(3,442,069)

(3,547,138)

(507,234)

Loss from operations

(390,658)

(12,689)

(1,814)

(824,891)

(185,794)

(26,568)

Financial income

20,973

6,947

993

86,136

40,721

5,823

Foreign currency exchange (loss) gain

(22,129)

1,176

168

(20,399)

13,374

1,912

(Loss) income from equity method investments, net

(8,104)

2,304

329

1,386

5,940

849

Impairment of investments

(13,453)

(1,924)

(13,453)

(1,924)

Other income, net

18,726

20,150

2,881

44,461

46,690

6,677

(Loss) income before income tax expenses

(381,192)

4,435

633

(713,307)

(92,522)

(13,231)

Income tax benefits (expenses)

2,388

(1,398)

(200)

3,086

108

15

Net (loss) income

(378,804)

3,037

433

(710,221)

(92,414)

(13,216)

Net loss (income) attributable to non-controlling interests and
redeemable non-controlling interests

(5,430)

5,028

719

2,047

11,546

1,651

Net (loss) income attributable to Yatsen’sshareholders

(384,234)

8,065

1,152

(708,174)

(80,868)

(11,565)

Shares used in calculating loss per share(1):

Weighted average number of Class A and Class B ordinary shares:

    Basic

1,930,413,426

1,879,474,484

1,879,474,484

2,025,072,131

1,862,554,166

1,862,554,166

    Diluted

1,930,413,426

2,018,668,765

2,018,668,765

2,025,072,131

1,862,554,166

1,862,554,166

Net (loss) income per Class A and Class B ordinary share

    Basic

(0.20)

0.00

0.00

(0.35)

(0.04)

(0.01)

    Diluted

(0.20)

0.00

0.00

(0.35)

(0.04)

(0.01)

Net (loss) income per ADS (20 ordinary shares equal to 1 ADS)

    Basic

(3.98)

0.09

0.01

(6.99)

(0.87)

(0.12)

    Diluted

(3.98)

0.08

0.01

(6.99)

(0.87)

(0.12)

*   In the fourth quarter of 2025, we made certain out of period adjustments mainly relating to revenues and cost of revenues to correct certain prior periods errors mainly occurred during the sales return and inventory receipt processes, which reduced quarterly profit by RMB14.6 million. Out of the RMB14.6 million adjustments, RMB7.4 million adjustments were related to prior years. Based on our quantitative and qualitative analysis, we do not believe these errors are material to our financial position or results of operations for the current year and for any prior years or prior quarters individually or in aggregate.


For the Three Months Ended December 31,

For the Year Ended December 31,

2024

2025

2025

2024

2025

2025

Share-based compensation expenses are included in the
operating expenses as follows:

RMB’000

RMB’000

USD’000

RMB’000

RMB’000

USD’000

Fulfilment expenses

237

2

0

387

213

30

Selling and marketing expenses (income)

2,259

1,411

202

(42)

4,959

709

General and administrative expenses

17,443

10,940

1,564

89,941

48,646

6,956

Research and development expenses

356

1,636

234

888

5,213

745

Total

20,295

13,989

2,000

91,174

59,031

8,440

(1)   Authorized share capital is re-classified and re-designated into Class A ordinary shares and Class B ordinary shares, with each Class A ordinary share being entitled to one vote and each Class B ordinary share being entitled to twenty votes on all matters that are subject to shareholder vote.


YATSEN HOLDING LIMITED

UNAUDITED RECONCILIATIONS OF GAAP AND NON-GAAP RESULTS

(All amounts in thousands, except for share, per share data or otherwise noted)

For the Three Months Ended December 31,

For the Year Ended December 31,

2024

2025

2025

2024

2025

2025

RMB’000

RMB’000

USD’000

RMB’000

RMB’000

USD’000

Loss from operations

(390,658)

(12,689)

(1,814)

(824,891)

(185,794)

(26,568)

Share-based compensation expenses

20,295

13,989

2,000

91,174

59,031

8,440

Impairment of goodwill

403,076

403,076

Amortization of intangible assets resulting from assets and business
acquisitions

60,447

10,502

1,502

106,385

42,729

6,110

Non-GAAP income (loss) from operations

93,160

11,802

1,688

(224,256)

(84,034)

(12,018)

Net (loss) income

(378,804)

3,037

433

(710,221)

(92,414)

(13,216)

Share-based compensation expenses

20,295

13,989

2,000

91,174

59,031

8,440

Impairment of goodwill

403,076

403,076

Impairment of investments

13,453

1,924

13,453

1,924

Amortization of intangible assets resulting from assets and business
acquisitions

60,447

10,502

1,502

106,385

42,729

6,110

Revaluation of investments on the share of equity method
investments

7,386

(3,475)

(497)

(10,019)

(15,839)

(2,265)

Tax effects on non-GAAP adjustments

(5,421)

3,725

533

(8,644)

1,435

205

Non-GAAP net income (loss)

106,979

41,231

5,895

(128,249)

8,395

1,198

Net (loss) income attributable to Yatsen’s shareholders

(384,234)

8,065

1,152

(708,174)

(80,868)

(11,565)

Share-based compensation expenses

20,295

13,989

2,000

91,174

59,031

8,440

Impairment of goodwill

403,076

403,076

Impairment of investments

13,453

1,924

13,453

1,924

Amortization of intangible assets resulting from assets and business
acquisitions

60,079

10,228

1,463

104,853

41,390

5,919

Revaluation of investments on the share of equity method 
investments

7,386

(3,475)

(497)

(10,019)

(15,839)

(2,265)

Tax effects on non-GAAP adjustments

(5,393)

3,724

533

(8,533)

1,490

213

Non-GAAP net income (loss) attributable to Yatsen’s shareholders

101,209

45,984

6,575

(127,623)

18,657

2,666

Shares used in calculating loss per share:

Weighted average number of Class A and Class B ordinary shares:

    Basic

1,930,413,426

1,879,474,484

1,879,474,484

2,025,072,131

1,862,554,166

1,862,554,166

    Diluted

2,049,750,667

2,018,668,765

2,018,668,765

2,025,072,131

2,009,621,005

2,009,621,005

Non-GAAP net income (loss) attributable to ordinary shareholders per
Class A and Class B ordinary share

    Basic

0.05

0.02

0.00

(0.06)

0.01

0.00

    Diluted

0.05

0.02

0.00

(0.06)

0.01

0.00

Non-GAAP net income (loss) attributable to ordinary shareholders per
ADS (20 ordinary shares equal to 1 ADS)

    Basic

1.05

0.49

0.07

(1.26)

0.20

0.03

    Diluted

0.99

0.46

0.07

(1.26)

0.19

0.03


Shrewsbury International School Hong Kong Launches Key Stage 3, Establishing Seamless Pathways to Global Excellence

HONG KONG, March 2, 2026 /PRNewswire/ — Shrewsbury International School Hong Kong is pleased to announce the launch of its Key Stage 3 programme, welcoming Year 7 students starting August 2026, with Year 8 to follow in August 2027. This strategic expansion transforms Shrewsbury Hong Kong into a through-train school, providing a seamless educational experience from Early Years through Year 8 and beyond, all within the esteemed Shrewsbury family.

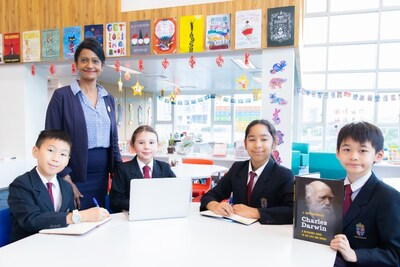
Shrewsbury Hong Kong Principal, Priya Kanthan, with a group of students.

Global Vision: Fostering Future-Ready Leaders

The new Key Stage 3 programme is meticulously designed to cultivate leadership qualities and a global mindset among our students. Our holistic curriculum emphasises critical thinking, creativity, and global citizenship, nurturing a diverse community that honors Hong Kong’s rich cultural heritage. “The expansion into Key Stage 3 is a natural evolution of our mission to nurture curious, confident, and capable global citizens,” stated Priya Kanthan, Principal of Shrewsbury International School Hong Kong.

Seamless Transition to Year 9 at Shrewsbury School in the UK

A key feature of our curriculum is its direct alignment with Year 9 at Shrewsbury School in the UK, one of the prestigious “Great Nine” schools. Students graduating from Year 8 are guaranteed consideration for progression to Shrewsbury School, ensuring academic continuity and a smooth transition.

World-Class Facilities for Holistic Development

Our purpose-built campus is designed to support every facet of student development through exceptional facilities, including an Olympic-certified gymnastics centre, a 25-meter swimming pool, and dedicated spaces for the performing arts. These resources cultivate an inspiring environment where students can pursue their passions and excel both academically and creatively.

Curriculum Highlights:

  1. Personalised Learning Journey: Our Key Stage 3 curriculum offers tailored educational pathways that cater to each student’s unique interests and strengths, supported by dedicated educators who nurture individual talents.
  2. Engaging Interdisciplinary Learning: Through our “Learning Through Lenses” approach, students explore thematic connections across subjects, allowing for the application of knowledge in diverse contexts.
  3. Holistic Development: We prioritise character and social skills alongside academic excellence, instilling core values such as resilience, respect, and collaboration, preparing students to become compassionate global citizens.
  4. Global Citizenship Focus: Students are encouraged to appreciate diversity and engage with global issues, empowering them to contribute positively to society.
  5. Robust Co-Curricular Activities: A wide array of opportunities enable students to explore interests beyond the classroom, cultivating essential skills for their future.
  6. Tailored Assessments: Our continuous assessment strategy provides regular feedback to track academic progress, helping students identify strengths and areas for growth.

At Shrewsbury International School Hong Kong, we are committed to fostering an environment where every student can thrive. The introduction of our Key Stage 3 programme represents a significant advancement in our dedication to nurturing the potential of young learners.

About Shrewsbury International School Hong Kong

Shrewsbury International School Hong Kong draws directly from the heritage of one of Britain’s most distinguished independent schools. Founded by Royal Charter in 1552, Shrewsbury School UK has an exceptional record of excellence in broad academic study. We share a commitment to cultivating confident, articulate, and independent learners. 

As the only premium provider of British education in the region, our inspirational educational programme is grounded in the English National Curriculum, designed to nurture creativity and confidence. Conveniently located just 20 minutes from Central, we offer an exceptional range of experiences for students aged 3 to 13.

www.shrewsbury.edu.hk

@shrewsburyhkg
#WeAreShrewsbury
#TogetherWeFlourish

Media Kit:
https://shorturl.at/GkyZA

KuCoin Enhances Lite Mode With Earn and Feed, Supporting Confident Entry Into Crypto and Broader Adoption

PROVIDENCIALES, Turks and Caicos Islands, March 2, 2026 /PRNewswire/ — KuCoin, a leading global crypto platform built on trust, today announced an upgrade to KuCoin Lite Mode with the integration of Earn and Feed. The update brings together an intuitive entry experience, low-friction earning options, and actionable market content in a single streamlined interface—helping first-time users reduce complexity without sacrificing capability at the start of their crypto journey. The upgrade reflects KuCoin’s user-first product approach and its belief that technology should serve people first.


Building on the recent launch of KuCoin Lite Mode and the evolution of Feed, this enhanced experience extends KuCoin’s “content-to-trade” strategy to a broader audience. By making Feed accessible directly within Lite Mode, users can discover market trends without switching interfaces, supporting more informed decision-making within the KuCoin App. The upgrade also strengthens the connection to passive earning pathways, bringing crypto wealth tools closer to the simplicity users expect from digital banking.

KuCoin Lite is designed as a comprehensive entry point—not a stripped-down version of Pro—helping new users learn, participate, and build confidence with less friction. By simplifying how users discover products and information while maintaining platform reliability and security standards, KuCoin supports more responsible participation from the start.

Key enhancements include:

  • Earn — One-Tap Rewards: A simplified way to access beginner-oriented earning options, designed to reduce operational friction.
  • Feed — Actionable Insights: Curated, bite-sized market updates and community trends that bridge discovery and execution.

This development is part of KuCoin’s broader strategy to lower barriers to entry and raise the standard for beginner-friendly experiences. By reducing information overload and simplifying core workflows, KuCoin continues to drive the next wave of global crypto adoption.

The upgraded KuCoin Lite experience is available in the KuCoin App. Users can switch between Lite and Pro modes at any time.

About KuCoin

Founded in 2017, KuCoin is a leading global crypto platform trusted by over 40 million users across 200+ countries and regions. The platform delivers innovative and compliant digital asset services, offering access to 1,000+ listed tokens, spot and futures trading, institutional wealth management, and a Web3 wallet.

Recognized by Forbes and Hurun, KuCoin holds SOC 2 Type II and ISO 27001:2022 certifications, underscoring its commitment to top-tier security. With AUSTRAC registration in Australia and a MiCA license in Austria, KuCoin continues expanding its regulated footprint under CEO BC Wong, building a reliable and trusted digital-asset ecosystem.

Learn more: www.kucoin.com

Police Launch Three-Month Guidance Phase to Ease Traffic Overhaul in Vientiane

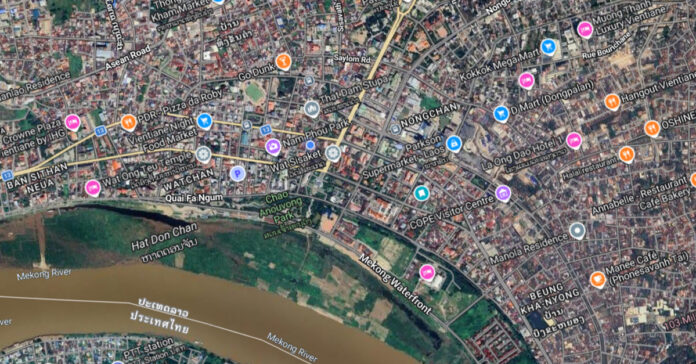
Vientiane is set to adjust traffic flow on nine city center roads starting 28 February. Motorists are advised to review the new directions before traveling.

A new traffic system designed to accommodate the future Bus Rapid Transit (BRT) caused significant confusion for Vientiane commuters this morning.

With long queues and a sense of disarray, the capital’s drivers are struggling to adjust to the changes implemented on 28 February

However, a new guidance phase is helping ease the transition.

The Division of Traffic Management in Chanthabuly district has rolled out a three-month educational project aimed at familiarizing residents with new traffic regulations on major roads, including Khounboulom, Samsenthai, and Donchanh roads, where BRT traffic will soon be integrated.

While the authorities have yet to announce the start date for BRT services, Bounla Vongvinay, Deputy Director of the Traffic Management Division, confirmed that the current priority is education rather than fines. 

“There will be no fines for those who are still confused or unable to follow the new rules,” Bounla said.

The changes have led to adjustments such as converting wide, one-way streets into narrower two-way lanes, particularly along the riverside areas. 

These new systems are creating significant delays, with some commuters reporting that their journeys have doubled in time. 

The public response on social media echoed similar concerns, with many sharing photos of traffic gridlocks.

To assist, the police have deployed several teams, a total of 145 people, to guide drivers during peak hours. Officers are rotating shifts during the morning rush, from 8:00 to 9:30 AM, and evening rush, from 3:30 to 6:30 PM, using loudspeakers to announce changes in real time and help manage the traffic flow.

Yet, the biggest challenge, according to Bounla, is parking, especially near BRT lanes. 

Authorities are urging commuters not to park on the roadside, particularly along Mixay Road, and to only use designated parking spaces.

With the support from the police and patience from the public, the city is on track to make commuting smoother and more efficient. 

MiniMax Announces Full Year 2025 Financial Results

HONG KONG, March 2, 2026 /PRNewswire/ — MiniMax Group Inc. (“MiniMax” or the “Company”; HKEX: 00100), a global AI foundation model company, today announced its financial results for the year ended December 31, 2025.

FY2025 Key Highlights

  • Total revenue increased by 158.9% year over year to US$79.0 million, with more than 70% derived from international markets.
  • Gross profit increased by 437.2% year over year to US$20.1 million. Gross profit margin was 25.4%, an improvement of 13.2 percentage points compared to the same period of 2024.
  • Adjusted net loss(1) was US$250.9 million, compared to US$244.2 million in 2024. Adjusted net margin narrowed significantly year over year compared to the same period of 2024.
  • As of December 31, 2025, MiniMax had cumulatively served more than 236 million users across over 200 countries and regions, as well as 214,000 enterprise customers and developers from more than 100 countries and regions.

Dr. Yan Junjie, Co-founder and CEO of MiniMax, commented, “In 2025, we built full-modality R&D capabilities, with globally competitive models in place across key modalities, including language, video, speech and music. Meanwhile, we continued to enhance the user experience through ongoing technological innovation, upgrading our AI-native product portfolio. We also made further progress in deepening our global footprint.

We believe model intelligence will further advance significantly over the coming year. In coding, we expect to see the emergence of L4 to L5 levels of intelligence, shifting from AI as a tool to AI as a collaborative, colleague-level partner. In workplace scenarios, it will replicate the pace of progress we saw in coding last year. Multimodal creation will also move toward the direct generation of production-ready mid- to long-form content, with new formats emerging that are closer to streaming and real-time output. Taken together, these developments point to a significant expansion in the supply of intelligence at scale, as well as an unprecedented window of innovation at the application layer. The demand placed on our platform will expand to an entirely new magnitude.

Looking ahead, at the strategic level, we will evolve from a large-model company into a platform company for the AI era. We will continue to define and advance new intelligence paradigms, strengthen innovation in technology and products, and enhance scalable infrastructure and token throughput capacity. At the same time, we will deepen our commercialization initiatives and expand global market opportunities, empowering users and partners worldwide with greater intelligence.”

FY2025 Financial Review

Revenue from our AI-native products increased by 143.4% from US$21.8 million in 2024 to US$53.1 million in 2025,  primarily driven by higher user engagement and increased customer willingness to pay for our products, as well as the continued adoption and monetization of products such as Hailuo AI.

Revenue from our Open Platform and other AI-based enterprise services increased by 197.8% from US$8.7 million in 2024 to US$26.0 million in 2025, primarily fueled by a notable increase in paying users.

Gross profit improved by 437.2% from US$3.7 million in 2024 to US$20.1 million in 2025, which is largely higher than the increase of revenue. Gross profit margin increased from 12.2% in 2024 to 25.4% in 2025, which was primarily driven by the improved model and system efficiency, as well as optimization of infrastructure allocation.

Selling and distribution expenses decreased by 40.3% from US$87.0 million in 2024 to US$51.9 million in 2025, as our AI-native products business was primarily driven by organic growth and user referrals, and promotional expenses have decreased accordingly.

Administrative expenses increased by 155.9% from US$14.4 million in 2024 to US$36.8 million in 2025, mainly driven by an increase in staff costs due to increasing headcount and share-based payment expenses for administrative personnel. Moreover, the listing expenses incurred in 2025 also contributed to the overall increase in administrative expenses, which did not occur in 2024.

Research and development expenses increased by 33.8% from US$189.0 million in 2024 to US$252.8 million in 2025, mainly attributed to an increase in cloud services expenses related to training activities, driven by the increased model iteration and upgrades as we continued to develop and refine our foundation models and multimodal capabilities. The year-over-year growth rate of our research and development expenses is significantly lower than our revenue growth rate of 158.9% during the year, demonstrating our improved research and development efficiency.

Adjusted net loss(1) was US$250.9 million in 2025, compared to US$244.2 million in 2024.

Cash balance(2) was US$1,050.3 million as of December 31, 2025, compared to US$880.6 million as of December 31, 2024.

Notes:

(1) We define “adjusted net loss” as net loss adjusted by adding back share-based payment expenses, fair value loss on financial liabilities and listing expenses.

(2) Cash balance included but not limited to cash and cash equivalents, financial assets at amortised cost, financial assets at fair value through profit or loss, restricted cash and time deposit.

FY2025 Business Review

In 2025, we built full-modality R&D capabilities, with globally competitive models in place across key modalities, including language, video, speech and music. Meanwhile, we continued to enhance the user experience through ongoing technological innovation, upgrading our AI-native product portfolio. This includes our enterprise-facing Open Platform, as well as consumer products such as MiniMax Agent, Hailuo AI, Talkie and Xingye. We also made further progress in deepening our global footprint.

In large language models, during the fourth quarter of 2025, we updated three models: M2, M2.1 and M2-her. M2 redefined the balance among performance, cost and speed and incorporated three key capabilities: coding, tool use and deep search. It became the first Chinese model on OpenRouter to exceed 50 billion tokens in daily consumption while ranking first on the Hugging Face global trending leaderboard. M2.1 focused on improving performance on complex, real-world tasks, particularly in coding and workplace scenarios, where it demonstrated stronger capabilities in understanding and executing multi-step instructions. M2-her serves as the underlying model supporting our AI interactive products, Xingye and Talkie. It is designed to deliver more natural and personalized conversational experiences and was ranked first globally in overall performance in 100-turn Long-context Dialogue Testing.

In February 2026, we released M2.5, which achieved globally leading performance across key productivity scenarios, including coding, tool use and workplace applications. In coding, M2.5 delivers a 37% efficiency improvement compared with the previous generation, M2.1. M2.5 makes the operation of complex agents economically scalable. From M2 to M2.1 and now M2.5, each generation has delivered significant improvements in both capability and adoption. In February 2026, average daily token consumption of M2 series text models has grown to over six times that of December 2025,  with token consumption from Coding Plan growing by over ten times.

On the multimodal front, we have now established model coverage across video, speech and music. In October 2025, we released our video model, Hailuo 2.3, which delivered significant improvements in character motion, visual quality and stylistic expression. The Fast model can reduce batch content creation costs by up to 50%. We further upgraded Media Agent within Hailuo AI, which supports full-modality content creation, enabling one-click video generation from a simple description. As of the end of 2025, our video models had helped creators worldwide generate more than 600 million videos in total.  Also in October 2025, we released our speech model, Speech 2.6, which was optimized for Voice Agent scenarios and significantly enhanced voice interaction performance. It achieved globally leading ultra-low latency and supports more than 40 languages. As of the end of 2025, our speech model had helped users worldwide generate over 200 million hours of speech in total, making it one of the core infrastructure platforms in the global voice intelligence ecosystem. Our music models, Music 2.0 and 2.5, also achieved significant advancements. They can reliably handle a wide range of vocal styles and emotional expressions, with individual compositions extending up to five minutes in length.

In the process of developing these models and products, we have also continuously advanced our AI-native organizational evolution. Internally, our agent interns now support nearly 90% of employees, with use cases spanning software development, data analysis, operations management, talent recruitment and sales and marketing. We view ourselves as a testing ground for the evolution of AI-native organizational capabilities, one that will directly shape our future R&D efficiency. In January 2026, we productized these capabilities and successfully launched the MiniMax Agent AI-native workspace.

Conference call

The Company’s management will host a conference call on Monday, March 2, 2026, at 8:00 PM Beijing Time (7:00 AM U.S. Eastern Time) to discuss the results.

Participants are required to pre-register for the conference call at:

Chinese Line (Mandarin):
https://s1.c-conf.com/diamondpass/10053116-eg81mx.html

English Simultaneous Interpretation Line (listen-only mode):
https://s1.c-conf.com/diamondpass/10053115-hu76t5.html

Participants can choose between the Chinese and English simultaneous interpretation options for pre-registration above. Please note that the English simultaneous interpretation option will be in listen-only mode. Please register Chinese Line for Q&A session. Upon registration, participants will receive an email containing conference call dial-in details, event passcode, and a unique registrant ID. This information will allow you to gain immediate access to the call. Participants may pre-register at any time, including up to and after the call start time.

Additionally, live, and archived webcasts of the conference call, for both Chinese and English simultaneous interpretation, will be available on the Company’s investor relations website at https://ir-tool.minimaxi.com/calendar/index.html?lang=en.

About MiniMax

MiniMax is a global AI foundation model company. We are committed to advancing the frontiers of AI towards AGI via our mission Intelligence with Everyone. Our proprietary multimodal models have advanced coding capability and high agentic performance, as well as ultra-long context processing capability, and can understand, generate, and integrate a wide range of modalities, including text, audio, images, video, and music. These models power our major AI-native products, and our enterprise and developer-facing Open API Platform — which collectively deliver intelligent, dynamic experiences to enhance productivity and quality of life for users worldwide. For more information, please visit https://ir.minimaxi.com/en.

Forward-Looking Statements

Certain statements included in this press release, other than statements of historical fact, are forward-looking statements relating to our business outlook, estimates of financial performance, forecast business plans, growth strategies and projections of anticipated trends in our industry. Forward-looking statements generally can be identified by the use of forward-looking terminology such as “may”, “might”, “can”, “could”, “will”, “would”, “anticipate”, “believe”, “continue”, “estimate”, “expect”, “forecast”, “intend”, “plan”, “seek”, or “timetable”. These forward-looking statements are based on information currently available to the Company and are stated herein on the basis of the outlook at the time of this press release. They are based on certain expectations, assumptions and premises, many of which are subjective or beyond our control. These forward-looking statements may prove to be incorrect and may not be realized in the future. Underlying these forward-looking statements are a large number of risks and uncertainties. In light of the risks and uncertainties, the inclusion of forward-looking statements in this press release should not be regarded as representations by the Board or the Company that the plans and objectives will be achieved, and investors should not place undue reliance on such statements. Except as required by law, the Company, the Board, the employees or the Agencies are not obligated, and undertake no obligation, to release publicly any revisions to these forward-looking statements that might reflect events or circumstances occurring after the date of this press release or those that might reflect the occurrence of unanticipated events. Furthermore, they assume no obligations to whatsoever for any loss arising from the failure of any forward-looking statements to materialize or from their becoming inaccurate.

For investor and media inquiries, please contact

MiniMax
Investor Relations
Email: ir@minimax.io

Media Relations
Email: pr@minimax.io

Piacente Financial Communications
E-mail: Minimax@thepiacentegroup.com


CONDENSED CONSOLIDATED INCOME STATEMENT

For the year ended December 31, 2025

Year ended December 31,

2025

2024

USD’000

USD‘000

REVENUE

79,038

30,523

Cost of sales

(58,959)

(26,785)

Gross profit

20,079

3,738

Other income and gains, net

40,369

36,151

Selling and distribution expenses

(51,896)

(86,995)

Administrative expenses

(36,813)

(14,384)

Research and development expenses

(252,771)

(188,979)

Fair value loss on financial liabilities

(1,589,850)

(214,172)

Finance costs

(672)

(509)

Impairment losses on financial assets, net

(63)

(88)

LOSS BEFORE TAX

(1,871,617)

(465,238)

Income tax expense

LOSS FOR THE YEAR

(1,871,617)

(465,238)

Attributable to:

Owners of the parent

(1,871,617)

(465,238)

Non-controlling interests

(1,871,617)

(465,238)

LOSS PER SHARE ATTRIBUTABLE TO ORDINARY EQUITY
   HOLDERS OF THE PARENT

Basic and diluted

– For loss for the year (USD)

(17.23)

(4.28)


CONDENSED CONSOLIDATED BALANCE SHEET

As at December 31,

2025

2024

USD‘000

USD‘000

NON-CURRENT ASSETS

Property, plant and equipment

1,571

1,093

Right-of-use assets

2,357

3,077

Prepayments, other receivables and other assets

887

561

Financial assets at fair value through profit or loss

69,965

95,331

Financial assets at fair value through other comprehensive 
   income

6,224

4,836

Restricted cash

41

38

Total non-current assets

81,045

104,936

CURRENT ASSETS

Trade receivables

10,730

6,982

Prepayments, other receivables and other assets

16,319

13,470

Financial assets at amortised cost

147,444

Financial assets at fair value through profit or loss

438,525

295,220

Restricted cash

20,377

27,293

Time deposits

13,787

26,327

Cash and cash equivalents

507,621

288,912

Total current assets

1,007,359

805,648

CURRENT LIABILITIES

Interest-bearing bank borrowings

35,452

19,455

Trade and bills payables

57,677

51,212

Other payables, accruals and other liabilities

34,068

51,512

Contract liabilities

7,541

1,553

Lease liabilities

1,318

1,964

Convertible redeemable preferred shares

3,597,566

1,581,949

Total current liabilities

3,733,622

1,707,645

NET CURRENT LIABILITIES

(2,726,263)

(901,997)

TOTAL ASSETS LESS CURRENT LIABILITIES

(2,645,218)

(797,061)

NON-CURRENT LIABILITIES

Lease liabilities

638

1,059

Other non-current liabilities

2,334

1,200

Total non-current liabilities

2,972

2,259

Net liabilities

(2,648,190)

(799,320)

DEFICITS

Share capital

Deficits

(2,648,190)

(799,320)

Total deficits

(2,648,190)

(799,320)


Reconciliation of Non-IFRS Measures
For the year ended December 31, 2025

Year ended December 31,

2025

2024

USD’000

USD‘000

Loss for the year(3)

(1,871,617)

(465,238)

Adjusted for:

Share-based payment expenses

24,031

6,823

Fair value loss on financial liabilities(4)

1,589,850

214,172

Listing expenses 

6,880

Adjusted net loss (non-IFRS measure(5)) 

(250,856)

(244,243)


Note:

(3).   Loss for the year in 2025 increased significantly from that in 2024, mainly driven by significant remeasurement losses on our preferred shares due to continued increases in our valuation, which was included in fair value loss on financial liabilities.

(4)     Fair value loss on financial liabilities comprises fair value changes of convertible redeemable preferred shares which will be re-designated from liabilities to equity as a result of the automatic conversion into ordinary shares upon Listing, and convertible bonds, which have subsequently been repaid in full as of December 31, 2025.

(5)      Please refer to section headed ” Non-IFRS Measure” in this annual results announcement for more details.

Club 666 to Debut as Singapore’s First Micro Club, Featuring Capsule rooms for an Intimate, Curated Nightlife Experience

A discreet, reservation-led space in TPI Building designed for intimate experiences, elevated service, and a new kind of all-in-one entertainment destination

SINGAPORE – Media OutReach Newswire – 2 March 2026 – Singapore’s nightlife is about to get a new kind of pulse. One that beats smaller, sharper, and far more intentional. Opening on 6 March 2026, Club 666 will debut at TPI Building, positioning itself as Singapore’s first micro club built around exclusivity, discretion, and thoughtfully curated, intimate experiences.
In recent years, the city’s idea of a great night out has shifted. Less “big room, big chaos,” more considered corners, good company, and spaces that feel designed, not accidental. Club 666 arrives with that same instinct, created for guests with busy schedules, little appetite for wasted time, and a growing preference for nights that feel polished rather than frantic. It is a club concept that leans into the art of going smaller, with the confidence that intimacy can be its own kind of luxury.
Inspired by the secretive allure of world-class private clubs, Club 666 is designed for guests who prefer refinement over noise, and atmosphere over volume. The concept is not about scaling up. It is about stripping back, tightening the room, and making every detail count, from the ambience and acoustics to the art of hosting itself. Anchoring the experience are capsule rooms designed for closeness and comfort, creating intimate pockets where groups can settle in, stay present, and move through the night together.

While the space is intentionally intimate, Club 666 is not designed to stay quiet all night. Each evening will feature two signature hype programmes created to shift the room’s energy at key moments, delivering show-led crowd activation and interactive rituals that are designed to feel unexpected, elevated, and distinctly Club 666, without relying on the usual playbook.

Among the club’s signature offerings is a service style not commonly experienced in Singapore’s nightlife landscape, including personal butler service tailored to guest preferences. With a focus on comfort, privacy, and seamless hosting, Club 666 aims to deliver an experience that feels less like a typical night out and more like being welcomed into a carefully orchestrated space, where the night flows and the service anticipates.

Club 666 is helmed by Glenn, who will be known publicly by his first name only. He is also behind The Gentleman’s Club, located within the same building. With plans for another nightlife concept still under wraps, Glenn’s vision for TPI Building is shaping into a one stop destination made up of distinct spaces that move like chapters, each with its own mood, energy, and purpose.

“People go out because they want variety, but the reality is they end up spending half the night moving from place to place,” said Glenn, owner of Club 666. “I want to build a one-stop entertainment hub where guests can experience different moods and environments without wasting time club-hopping. When we do it right, the night flows better, and guests can focus on enjoying themselves.”

What to expect at Club 666

  • Singapore’s first micro club, built for intimate capacity and elevated ambience
  • Discreet, curated experiences inspired by private club culture
  • Personal butler service and hospitality-led nightlife tailored to guest preferences
  • A new chapter within TPI Building’s evolving entertainment ecosystem
  • Two signature nightly hype programmes, designed as crowd-led moments you will not find elsewhere in Singapore

More than a dance floor and more than a bar, Club 666 positions itself as a social room for people who value belonging as much as atmosphere. By keeping the experience intentionally intimate, the club aims to make it easier to return, reconnect, and share nights that feel considered from the first arrival to the last song.

Hashtag: #Club666 #Clubbing #Singapore #Lifestyle #Nightlife


The issuer is solely responsible for the content of this announcement.

About Club 666

Club 666 is Singapore’s first micro club, redefining exclusivity through thoughtfully curated, intimate experiences. Inspired by the world’s elite private clubs, Club 666 creates a refined space where discretion, distinction, and elevated lifestyle converge. Located in TPI Building, Club 666 is part of a growing, one stop entertainment vision led by founder Glenn.

Operating Hours: Open daily (including public holidays), 10:00PM to 3:00AM. Extended hours on Saturdays and eves of public holidays: 10:00PM to 4:00AM.
Reservations: +65 8414 3466
More information:

Smart Design Global Awards 2026 Call for Final Applications Introducing Dual Incentive Scheme to Empower Local Talents to Go Global

Updated Format Grants Finalists with Exhibition Opportunities to Fuel Creativity


HONG KONG SAR – Media OutReach Newswire – 2 March 2026 – The “Hong Kong Smart Design Awards” has officially been renamed “Smart Design Global” (SDG), marking a new start to Hong Kong’s annual flagship design event as it enters its fifteenth year running. The name change signifies the convergence of local design talents, with the competition serving as a gateway to the world. Organised by the Hong Kong Exporters’ Association and sponsored by the Cultural and Creative Industries Development Agency (CCIDA) of the Government of the Hong Kong Special Administrative Region, the program has been instrumental in taking Hong Kong’s original design global since its inception in 2012.

This year’s rebranding represents a strategic transformation to further establish a holistic design ecosystem, with the goal to shape creativity as a new economic driver for Hong Kong. SDG will implement an incentive scheme which merges creativity with business to help winners connect with international markets. The program will consist of two key phases: the “Smart Design Global Awards 2026” competition, followed by a series of overseas trade shows.

Upgraded Perks: Shortlisted Participants to Secure Exhibition Spots

This year’s “Smart Design Global” comes with an upgraded suite of rewards for participants, and particularly those who qualify for the Corporate Group in order to reward SMEs and local designers that invest in creativity. All shortlisted participants will be allocated a dedicated display space at the Hong Kong Gifts & Premium Fair, where they can showcase their competition entries and other company products. This provides a comprehensive platform for participants to interact with thousands of international buyers, boosting brand exposure and fostering collaboration. The final judging will also take place on the first day of the Gifts & Premium Fair, allowing participants to present their design concepts directly to the jury panel. This face-to-face interaction enables contestants to gather professional feedback and gain deeper insights into their product’s strengths and weaknesses.

Furthermore, award winners will be given the opportunity to take their winning products abroad for touring exhibitions. By taking part in major global trade shows, homegrown designs will shine on an international stage. The SDG Awards also offers a prototype subsidy, which grants crucial early-stage funding to help top winners transform innovative concepts into market-ready products for the world, maximizing value for all participants who enter.

Four Categories: Showcasing Hong Kong’s Unique Charm

“Smart Design Global Awards 2026” is now open for application. This edition focuses not only on the aesthetic appeal of products, but also the market potential, calling for entries from innovative products across four categories:

  • Live: Designs that elevate living spaces and personal style, such as distinctive furniture and home décor.
  • Dine: Kitchen innovations, tableware, and dining decorations that redefine culinary aesthetics and experience.
  • Gift: Exquisite, personalized gifts designed to create lasting memories, including festive products, personal collectibles, and corporate gifts.
  • Play: Nostalgic recreational items or educational games with pedagogical design, such as figures, STEM games, and cross-generational collectibles.
Seize the final chance to showcase unique designs to the world. For detailed information on entry requirements, judging criteria, and registration for “Smart Design Global Awards 2026”, please visit the official website: https://www.sdawards.org.hk.
Smart Design Global 2026 Submission Details
Corporate Group
Application Deadline: 10 March 2026 (Tues)
Application Fee: HK$600 per product category
Exhibition Fee*: HK$3,500 per product category
Conceptual Group
Application Deadline: 10 March 2026 (Tues)
Application Fee: HK$300 per product category (Waived for students)
Exhibition Fee*: Waived

* Shortlisted entries will enjoy an HK$600 registration fee waiver, bringing the actual exhibition fee to HK$2,900.
**For details, please visit the Smart Design Global website: https://www.sdawards.org.hk

Hashtag: #HongKongSmartDesignAwards #SmartDesignGlobal #SDG


The issuer is solely responsible for the content of this announcement.

About Smart Design Global

Where Smart Design Meets Global Markets!

Smart Design Global (SDG) has evolved from the Hong Kong Smart Design Awards (HKSDA) to enhance innovation and collaboration within the design community, benefiting from 14 editions of experience and expertise gained from HKSDA. This extensive history allows us to leverage a network of established professionals in the field, fostering a supportive environment for emerging talent. By incorporating insights from past awardees and industry feedback, we will channel limitless creativity into market potential, redefine Hong Kong’s creative ecosystem, and ensure that SDG not only honors design excellence but also addresses the current and future needs of the global market.

Smart Design Global Website:

About The Hong Kong Exporters’ Association

Founded in 1955, The Hong Kong Exporters’ Association (The HKEA) is a non-profit making trade association registered under the Hong Kong Companies Ordinance as a company limited by guarantee. The HKEA is committed to creating new business opportunities and enhancing market value for Hong Kong exporters, aiming to position Hong Kong as a premier trading hub. The HKEA focuses on serving the industry and taking export trade as its core value, helping members expand their business by closely liaising with the government, initiating different projects, and organizing seminars, business gatherings, business delegation trips and exhibitions. The HKEA also disseminate the latest local and international trade information and provides online product display and search services for additional publicity, to further promote Hong Kong’s export trade and enhance market competitiveness.

The HKEA website:

About Cultural and Creative Industries Development Agency

The Cultural and Creative Industries Development Agency (CCIDA), formerly known as Create Hong Kong (CreateHK) since 2009, was established in June 2024. CCIDA is a dedicated office under the Culture, Sports and Tourism Bureau of the Government of the Hong Kong Special Administrative Region (HKSAR Government) to provide one-stop services and support to the cultural and creative sectors with a mission to foster a conducive environment in Hong Kong to facilitate development of the arts, culture and creative sectors as industries. CCIDA’s strategic foci are nurturing talent and facilitating start-ups, exploring markets, promoting cross-sectoral and multi-disciplinary collaboration, promoting industrialisation of the arts, culture and creative sectors under the industry-oriented principle, and fostering a creative atmosphere in the community, thereby reinforcing Hong Kong as Asia’s creative capital and our positioning as the East-meets-West centre for international cultural exchange.

CCIDA’s website:

Disclaimer: The Government of the Hong Kong Special Administrative Region provides funding support to the project only, and does not otherwise take part in the project. Any opinions, findings, conclusions or recommendations expressed in these materials/events (or by members of the project team) are those of the project organisers only and do not reflect the views of the Government of the Hong Kong Special Administrative Region, the Culture, Sports and Tourism Bureau, the Cultural and Creative Industries Development Agency, the CreateSmart Initiative Secretariat or the CreateSmart Initiative Vetting Committee.

ATFX Strengthens Strategic Engagements Across Key Financial Hubs

HONG KONG, March 2, 2026 /PRNewswire/ — ATFX continues to expand its global footprint through strategic engagements across London, Miami and Dubai, highlighting its commitment to international collaboration and industry innovation. Through sponsorships, conference participation and exclusive networking initiatives, ATFX and ATFX Connect are reinforcing their position within the global financial markets.

Icebreakers Chinese New Year Dinner 2026

In London, ATFX sponsored the Icebreakers Chinese New Year Dinner 2026, held on 6 February at The Dorchester in Mayfair. Recognised as the flagship annual celebration of UK–China relations, the event brought together senior business leaders, policymakers and trade representatives. The evening featured cultural performances and high-level engagement between executives and government figures, reinforcing ATFX’s commitment to international partnerships and global collaborations.

TradeTech FX USA

In Miami, ATFX Connect demonstrated its institutional expertise at TradeTech FX USA, the United States’ largest buy-side FX conference. Drew Niv, Chief Strategy Officer of ATFX, joined a main-stage panel discussion on liquidity and venue selection, addressing liquidity fragmentation, increasing transparency demands and the evolution of direct market connectivity in a competitive FX landscape. The event convened leading asset managers, hedge funds and corporates, reinforcing ATFX Connect’s institutional positioning and its commitment to delivering advanced liquidity, execution and connectivity solutions.

iFX Expo Dubai 2026

At iFX Expo Dubai 2026, one of the world’s largest B2B online trading expos, ATFX was recognised with the Best Broker–MEA 2026 award, while ATFX Connect received Best B2B Liquidity Provider. Building on this recognition, ATFX executives joined high-level discussions on brokerage dynamics, liquidity and macroeconomic trends. Wei Qiang Zhang, Managing Director of ATFX Connect Global, spoke on broker liquidity, while Mohammed Shanti of ATFX MENA discussed how geopolitical tensions are impacting commodity markets and pricing risks into gold, oil and industrial metals.

Smash & Network | ATFX Connect x Centroid Padel Tournament

Further strengthening institutional relationships, ATFX Connect co-hosted the event on 13 February 2026 at the Park Hyatt Dubai. The event  brought together brokers and institutional clients for padel and networking, providing a dynamic environment to build connections while fostering professional collaboration. The tournament highlighted the strategic partnership between ATFX Connect and Centroid Solutions, reflecting their collaboration to support brokers and institutional clients worldwide.

These initiatives showcase ATFX’s cohesive global vision, driving cross-border collaboration, pioneering institutional insights, and forging strategic partnerships that anticipate the evolving needs of international markets.

About ATFX

ATFX is a leading global fintech broker with a local presence in 24 locations and holds 9 licenses from regulatory authorities, including the UK’s FCA, Australia’s ASIC, Cyprus’ CySEC, the UAE’s SCA, Hong Kong’s SFC, South Africa’s FSCA, Mauritius’ FSC, Seychelles’ FSA, and Cambodia’s SERC. With a strong commitment to customer satisfaction, innovative technology, and strict regulatory compliance, ATFX delivers exceptional trading experiences to clients worldwide.

For further information on ATFX, please visit ATFX website https://www.atfx.com.