Home Blog Page 989

WBD Files Definitive Proxy Statement and Schedules Special Meeting for March 20, 2026, to Approve the WBD-Netflix Transaction

The WBD-Netflix Transaction Delivers Incredible Value and Certainty to WBD Stockholders with Clear Path to Timely Regulatory Approval

Netflix is the Superior Deal and the Only Deal Before WBD Stockholders 

Together WBD and Netflix will Protect U.S. Jobs, Bring Great Value to Consumers and Assure Growth of the Broader Entertainment Industry

A PSKY transaction does not have an easier or faster path to regulatory approval and PSKY’s financing challenges and rapid deleveraging plans pose tremendous risk to the entertainment industry

HOLLYWOOD, Calif., Feb. 17, 2026 /PRNewswire/ — Netflix, Inc. today issued the following statement regarding its fully financed definitive agreement with Warner Bros. Discovery, Inc. (WBD) to acquire Warner Bros., including its film and television studios, HBO Max and HBO: 

Today marks another important milestone for our transaction with WBD. WBD has filed and commenced the mailing of its definitive proxy statement for the special meeting to be held on March 20, 2026, to approve our Board-recommended transaction and superior offer.

Throughout the robust and highly competitive strategic review process, Netflix has consistently taken a constructive, responsive approach with WBD, in stark contrast to Paramount Skydance (PSKY). While we are confident that our transaction provides superior value and certainty, we recognize the ongoing distraction for WBD stockholders and the broader entertainment industry caused by PSKY’s antics. Accordingly, we granted WBD a narrow seven-day waiver of certain obligations under our merger agreement to allow them to engage with PSKY to fully and finally resolve this matter.

This does not change the fact that we have the only signed, board-recommended agreement with WBD, and ours is the only certain path to delivering value to WBD’s stockholders. In its press release today, WBD reaffirmed its recommendation that WBD stockholders vote to approve the Netflix transaction at WBD’s special meeting.

Together, Netflix and Warner Bros. will deliver more choice and greater value to audiences worldwide with expanded access to exceptional films and series – both at home and in theaters. Our transaction also expands production capacity and increases investment in original content, leading to long-term job creation. The Netflix transaction is centered on growth, opportunity, and a reinforced commitment to creating world-class films and television – not consolidation and layoffs.

Netflix is confident that our transaction, a largely vertical merger of complementary assets, has a clear path to timely regulatory approval. Netflix and WBD have each submitted their Hart-Scott-Rodino (HSR) filings and are engaged constructively with competition authorities across the world, including the U.S. Department of Justice (DOJ), state Attorneys General, the European Commission, and the U.K. Competition and Markets Authority (CMA). Netflix and WBD are driving the regulatory process forward — collaboratively and constructively and focused on a clear path to closing.

By contrast, PSKY has repeatedly mischaracterized the regulatory review process by suggesting its proposal will sail through, misleading WBD stockholders about the real risk of their regulatory challenges around the world. WBD stockholders should not be misled into thinking that PSKY has an easier or faster path to regulatory approval – it does not.

PSKY is also quick to publicize routine checkpoints to exaggerate “progress.” For example, PSKY cited securing German FDI clearance on January 27, 2026, as evidence of their “regulatory certainty.” In fact, Netflix received German FDI clearance on the very same day. 

Separately, the foreign funding behind PSKY’s bid is already raising serious national security concerns. We expect government reviewers globally, including CFIUS and Team Telecom in the U.S., as well as European authorities, to scrutinize the Middle Eastern investors in PSKY’s consortium and to be skeptical of claims that they are purely passive investors.

In reality, PSKY is far from obtaining all of the regulatory clearances required. Enforcers will focus on the impact of PSKY’s proposal on competition, job losses, reduced output, and downward pressure on wages for film and television workers. PSKY’s offer results in significant horizontal overlaps that will concern antitrust enforcers globally by combining:

    • two of the five major Hollywood studios,
    • two major theatrical distribution channels,
    • two of the major TV studios,
    • two major news networks, and
    • two major sports distributors.

Beyond their regulatory hurdles, PSKY’s aggressive financing package, rapid deleveraging plans, and performance track record pose tremendous risks to both the completion of their proposed deal and the industry. 

PSKY has promised to rapidly de-lever following its proposed transaction which can only be achieved through unprecedented job cuts (on top of the previous PSKY layoffs):

    • Post-merger, PSKY would be over-leveraged with approximately $84 billion of total proforma debt — the largest proposed leveraged buyout in history — and an estimated ~7x leverage ratio (Debt / 2026 LTM EBITDA).
    • PSKY has promised its concerned investors that it “will be below, call it, at closing with accounting for synergies around 4x. And [will] de-lever quickly to below 3x and almost 2x over the convening 2 years to 2.5 years.”1
    • This means PSKY would need to realize ~$16 billion of cost savings in order to meet the midpoint of its leverage target range, far in excess of the $6+ billion synergy figure PSKY has publicly communicated2.
      • The only way to achieve this would be through greater, even deeper job cuts that would irreparably harm the entertainment industry.
      • PSKY is already undershooting its financial projections. Based on their most recent published “Adjusted OIBDA” guidance for 2026, they have underperformed their initial Paramount acquisition business plan by 15%3, which could mean even more cost cuts.
      • This extraordinary execution risk and track record of operational underperformance could impact PSKY’s ability to fund and close a transaction.

A business plan that is dependent upon $16 billion in cost savings should be an unmistakable red flag for regulators, policymakers, union leaders and creatives.

Netflix’s strong cash flow generation supports our all-cash transaction structure while preserving a healthy balance sheet and flexibility to capitalize on future strategic priorities. A combined Netflix and Warner Bros. will strengthen the entertainment industry, preserve choice and value for consumers, and give creators more opportunities. 

WBD Stockholders — your vote is crucial. Vote FOR the Netflix and Warner Bros. deal at votewbdnetflix.com. A dedicated website providing ongoing information and resources about the transaction is available at netflixwbtogether.com

About Netflix, Inc. 
Netflix (NASDAQ:NFLX) is one of the world’s leading entertainment services offering TV series, films, games and live programming across a wide variety of genres and languages. Members can play, pause and resume watching as much as they want, anytime, anywhere, and can change their plans at any time.

Important Information and Where to Find It
In connection with the proposed transaction between Netflix and WBD, WBD filed a definitive proxy statement on Schedule 14A (the “Proxy Statement”) with the U.S. Securities and Exchange Commission (the “SEC”). The Proxy Statement was first mailed to WBD stockholders on or around February 17, 2026. Each of Netflix and WBD may also file with or furnish to the SEC other relevant documents regarding the proposed transaction. This communication is not a substitute for the Proxy Statement or any other document that Netflix or WBD may file with the SEC or mail to WBD’s stockholders in connection with the proposed transaction. INVESTORS AND SECURITY HOLDERS OF NETFLIX AND WBD ARE URGED TO READ THE PROXY STATEMENT, AS WELL AS ANY OTHER RELEVANT DOCUMENTS FILED WITH THE SEC IN CONNECTION WITH THE PROPOSED TRANSACTION OR INCORPORATED BY REFERENCE INTO THE PROXY STATEMENT (INCLUDING ANY AMENDMENTS OR SUPPLEMENTS THERETO), BECAUSE THEY WILL CONTAIN IMPORTANT INFORMATION REGARDING NETFLIX, WBD, THE PROPOSED TRANSACTION AND RELATED MATTERS. Investors and security holders may obtain free copies of the Proxy Statement as well as other filings containing information about Netflix and WBD, without charge, at the SEC’s website, https://www.sec.gov. The documents filed by Netflix with the SEC also may be obtained free of charge at Netflix’s website at https://ir.netflix.net/home/default.aspx. The documents filed by WBD with the SEC also may be obtained free of charge at WBD’s website at https://ir.wbd.com.

Participants in the Solicitation
Netflix, WBD and certain of their respective directors and executive officers may be deemed to be participants in the solicitation of proxies from the stockholders of WBD in connection with the proposed transaction under the rules of the SEC. Information about the interests of the directors and executive officers of WBD and other persons who may be deemed to be participants in the solicitation of stockholders of WBD in connection with the proposed transaction and a description of their direct and indirect interests, by security holdings or otherwise, is included in the Proxy Statement, which has been filed by WBD with the SEC. Information about WBD’s directors and executive officers is set forth in WBD’s proxy statement for its 2025 Annual Meeting of Stockholders on Schedule 14A filed with the SEC on April 23, 2025, WBD’s Annual Report on Form 10-K for the year ended December 31, 2024, and any subsequent filings with the SEC. Information about Netflix’s directors and executive officers is set forth in Netflix’s proxy statement for its 2025 Annual Meeting of Stockholders on Schedule 14A filed with the SEC on April 17, 2025, and any subsequent filings with the SEC. Additional information regarding the direct and indirect interests of those persons and other persons who may be deemed participants in the proposed transaction may be obtained by reading the Proxy Statement regarding the proposed transaction. Free copies of these documents may be obtained as described above.

Cautionary Statement Regarding Forward-Looking Statements
This document contains “forward-looking statements” within the meaning of the federal securities laws, including Section 27A of the U.S. Securities Act of 1933, as amended, and Section 21E of the Securities Exchange Act of 1934, as amended. These forward-looking statements are based on Netflix’s and WBD’s current expectations, estimates and projections about the expected date of closing of the proposed transaction and the potential benefits thereof, their respective businesses and industries, management’s beliefs and certain assumptions made by Netflix and WBD, all of which are subject to change. In this context, forward-looking statements often address expected future business and financial performance and financial condition, and often contain words such as “expect,” “anticipate,” “intend,” “plan,” “believe,” “could,” “seek,” “see,” “will,” “may,” “would,” “might,” “potentially,” “estimate,” “continue,” “expect,” “target,” similar expressions or the negatives of these words or other comparable terminology that convey uncertainty of future events or outcomes. All forward-looking statements by their nature address matters that involve risks and uncertainties, many of which are beyond our control and are not guarantees of future results, such as statements about the consummation of the proposed transaction and the anticipated benefits thereof. These and other forward-looking statements, including the failure to consummate the proposed transaction or to make or take any filing or other action required to consummate the transaction on a timely matter or at all, are not guarantees of future results and are subject to risks, uncertainties and assumptions that could cause actual results to differ materially from those expressed in any forward-looking statements. Accordingly, there are or will be important factors that could cause actual results to differ materially from those indicated in such statements and, therefore, you should not place undue reliance on any such statements and caution must be exercised in relying on forward-looking statements. Important risk factors that may cause such a difference include, but are not limited to: (i) the completion of the proposed transaction on anticipated terms and timing, including obtaining stockholder and regulatory approvals, completing the separation of WBD’s Discovery Global business (“Discovery Global”) and Warner Bros. business, anticipated tax treatment, unforeseen liabilities, future capital expenditures, revenues, expenses, earnings, synergies, economic performance, indebtedness, financial condition, losses, future prospects, business and management strategies, expansion and growth of WBD’s and Netflix’s businesses and other conditions to the completion of the proposed transaction; (ii) failure to realize the anticipated benefits of the proposed transaction, including as a result of delay in completing the transaction or integrating the businesses of Netflix and WBD; (iii) Netflix’s and WBD’s ability to implement their business strategies; (iv) consumer viewing trends; (v) potential litigation relating to the proposed transaction that could be instituted against Netflix, WBD or their respective directors; (vi) the risk that disruptions from the proposed transaction will harm Netflix’s or WBD’s business, including current plans and operations; (vii) the ability of Netflix or WBD to retain and hire key personnel; (viii) potential adverse reactions or changes to business relationships resulting from the announcement, pendency or completion of the proposed transaction; (ix) uncertainty as to the long-term value of Netflix’s common stock; (x) legislative, regulatory and economic developments affecting Netflix’s and WBD’s businesses; (xi) general economic and market developments and conditions; (xii) the evolving legal, regulatory and tax regimes under which Netflix and WBD operate; (xiii) potential business uncertainty, including changes to existing business relationships, during the pendency of the proposed transaction that could affect Netflix’s or WBD’s financial performance; (xiv) restrictions during the pendency of the proposed transaction that may impact Netflix’s or WBD’s ability to pursue certain business opportunities or strategic transactions; (xv) failure to receive the approval of the stockholders of WBD; (xvi) the final allocation of indebtedness between WBD and Discovery Global in connection with the separation could cause a reduction to the consideration for the proposed transaction; (xvii) inherent uncertainties involved in the estimates and assumptions used in the preparation of financial projections, and inherent uncertainties involved in the estimates and judgments used to estimate the differences between WBD’s Global Linear Networks segment results and the expected results of Discovery Global; and (xviii) volatility or a decline in the market price for Discovery Global common stock following the separation. Discussions of additional risks and uncertainties are contained in Netflix’s and WBD’s filings with the SEC, including their Annual Reports on Form 10-K and Quarterly Reports on Form 10-Q, and the Proxy Statement filed by WBD in connection with the proposed transaction. While the list of factors presented here and in the Proxy Statement are considered representative, no such list should be considered to be a complete statement of all potential risks and uncertainties. Unlisted factors may present significant additional obstacles to the realization of forward-looking statements. Consequences of material differences in results as compared with those anticipated in the forward-looking statements could include, among other things, business disruption, operational problems, financial loss, legal liability to third parties and similar risks, any of which could have a material adverse effect on Netflix’s or WBD’s consolidated financial condition, results of operations or liquidity. Neither Netflix nor WBD assumes any obligation to publicly provide revisions or updates to any forward-looking statements, whether as a result of new information, future developments or otherwise, should circumstances change, except as otherwise required by securities and other applicable laws.

1 Paramount Skydance Corporation M&A Call on 12/08/2025
2 Paramount Skydance 12/08/2025 Press Release
3 Creating a Next Generation Leading Entertainment Company and PSKY Q3’25 Shareholder Letter.


Fujitsu automates entire software development lifecycle with new AI-Driven Software Development Platform

Platform will be used in modifications of all 67 software packages provided to medical and governmental industry customers by end of fiscal year 2026

TOKYO, Feb. 17, 2026 /PRNewswire/ — Fujitsu Limited today announced the development and launch of its AI-Driven Software Development Platform, a new initiative to bring software development into the AI age and contribute to the sustainable growth of its customers and society. This platform automates the entire software development process, from requirements definition and design to implementation and integration testing. By leveraging the Takane LLM and agentic AI technology for large-scale software development developed by Fujitsu Research, the AI-Driven Software Development Platform enables AI agents to understand complex, evolving large-scale systems owned by enterprises and public organizations. The platform has multiple AI agents collaboratively execute each stage of software development, achieving full automation of the entire process without human intervention.

Fujitsu aims to use this AI-Driven Software Development Platform to carry out revisions to all 67 types of medical and government business software products provided by Fujitsu Japan Limited by the end of fiscal year 2026. The revisions are necessary due to legal and regulatory changes. From January 2026, the platform has been used in Japan for software modifications made necessary by the 2026 medical fee revisions. In a PoC that updated software as per the 2024 medical fee revisions, the platform demonstrated a significant reduction in development time for one of approximately 300 change requests. Using conventional software development methods the modifications would have taken three person-months. With this technology that was dramatically shortened to four hours, achieving a 100-fold increase in productivity.

By utilizing this AI-driven development platform, Fujitsu will dramatically improve the speed of software modifications necessitated by legal amendments and system changes. In AI-driven development, Fujitsu positions AI-Ready Engineering—the process of preparing assets and knowledge to ensure AI correctly understands existing systems and achieves highly reliable automation—as crucial. With AI-Ready Engineering and the AI-Driven Software Development Platform working in tandem, Fujitsu will accelerate AI-driven software development. Fujitsu will promote a transformation in engineers’ work styles, strengthening its Forward Deployed Engineer (FDE) complement, and shifting the paradigm of software development from a conventional person-month-based approach to a customer value-based approach.

For full release click here

Farmmi Inc. (NASDAQ: FAMI) Intelligent Marketing Subsidiary Bluesage Off to a Winning Start, Formally Signs First Global Client Service Contract

LISHUI, China, Feb. 17, 2026 /PRNewswire/ — NASDAQ-listed Farmmi Inc. (NASDAQ: FAMI) (hereinafter referred to as “Farmmi” or the “Company”) is pleased to announce that its newly established wholly-owned intelligent marketing subsidiary, Bluesage Marketing Inc. (“Bluesage”), formally signed its first global client service contract on February 4, 2026.

Business Implementation: From Strategic Vision to Value Realization

This first client service engagement is a significant milestone in Bluesage’s development history, demonstrating its rapid penetration capability in the AI-driven digital marketing field.

I.  First Order Breakthrough: This engagement signals that Bluesage has successfully transformed advanced AI big data analysis technology into deliverable commercial services.

II.  Full-Chain Empowerment: The performance of this contract will fully combine Farmmi’s strong back-end logistics fulfillment capabilities with Bluesage’s front-end market acquisition advantages, providing clients with a true end-to-end solution.

III.  Global Strategic Layout: This cooperation lays a solid operational foundation for Bluesage to further expand into the global AI precision marketing market.

This marks Bluesage’s rapid transition from strategic planning to the commercial implementation stage, and also validates the market appeal of the Company’s “Smart Logistics + Intelligent Marketing” dual-engine strategy.

Ms. Yefang Zhang, CEO of Farmmi, Inc., commented:

“We are deeply thrilled to have successfully signed the first service contract just two weeks after Bluesage’s establishment. This is not only a recognition of Bluesage’s intelligent marketing capabilities but also proves our clients’ urgent demand for the ‘Logistics + Marketing’ full-chain empowerment model. Moving forward, we will take this as a starting point to continuously improve overall profit margins through digital services and create greater value for shareholders.”

About Farmmi, Inc.

Founded in 1998, Farmmi, Inc. (Nasdaq: FAMI) is an agricultural products supplier, distributor and logistics service provider, with a focus on edible mushrooms (including shiitake and wood ear mushrooms) and other agricultural products. The Company distributes high-quality agricultural goods to the global markets primarily through its established distribution channels. For more information, please visit the Farmmi official website.

Forward-Looking Statements

This press release does not constitute an offer to sell or a solicitation of an offer to buy any securities. Such offers may only be made in accordance with the Securities Act of 1933, as amended, and applicable state securities laws.

Certain statements in this press release regarding the Company’s future growth prospects are forward-looking statements made pursuant to the “safe harbor” provisions of the Private Securities Litigation Reform Act of 1995. These forward-looking statements involve known and unknown risks and uncertainties that may cause actual results to differ materially from those expressed or implied in such statements. These risks and uncertainties include, but are not limited to: our ability to secure financing on favorable terms, customer order fulfillment, earnings volatility, exchange rate fluctuations, our ability to manage growth, the ability to generate revenue from business expansion and acquisitions, our ability to attract and retain qualified professionals, customer concentration, segment concentration, and other factors affecting the general economic conditions of the industry. Further information regarding these and other risks is included in the Company’s filings with the U.S. Securities and Exchange Commission (SEC), which are available at www.sec.gov. Farmmi may also make additional forward-looking statements from time to time in written or oral form, including in filings with the SEC and in reports to shareholders. Please note that all forward-looking statements are based on current assumptions believed to be reasonable as of the date of this press release. The Company undertakes no obligation to update or revise any forward-looking statements, except as required by law.

For more information, please contact: 

Farmmi, Inc.
Investor Relations
Tel: +86-0578-82612876
ir@farmmi.com

ST Engineering iDirect Partners with G&S SatCom to Unify Satellite Network Operations and Service Management

 Integrated capabilities empower ST Engineering iDirect customers to streamline operations and unlock next-generation service capabilities without disruption

HERNDON, Va., Feb. 17, 2026 /PRNewswire/ — ST Engineering iDirect, a global leader in satellite communications, today announced a strategic technology partnership with G&S SatCom to deliver a unified approach to network and service management, enabling customers to unlock new service capabilities across existing networks while maximizing the value of their current investments. As part of this partnership, ST Engineering iDirect will integrate the widely adopted G&S SatConnect® as a module within its next-generation ground system, Intuition.

This integration allows operators and service providers to centralize network and service management across multi-network, multi-platform, and multi-vendor environments, including third-party systems. A standardized API layer enables Intuition, alongside ST Engineering iDirect’s other platforms, to interoperate with external OSS/BSS systems and third-party applications, simplifying integration and reducing operational complexity as services scale. Integration with ST Engineering iDirect’s existing platforms will roll out throughout 2026, extending Intuition’s single-pane-of-glass experience across all networks.

ST Engineering iDirect will leverage G&S SatConnect® to introduce a service management and OSS/BSS layer within Intuition, bridging network operations with service definition, delivery, and lifecycle management. Through a single interface, customers gain a unified operational and commercial platform for network and service management, enabling seamless network configuration, faster service rollouts, and scalable, differentiated satellite services.

The combined capabilities of Intuition’s unified network and service management and G&S SatConnect® deliver measurable efficiency and cost benefits by standardizing workflows across network and service operations. This integration provides cross-platform observability and end-to-end operational control, enabling satellite operators and service providers to reduce migration risks, enhance customer experiences, and respond more quickly to changing market demands while minimizing the need for custom development and integration projects.

“With Intuition and G&S SatConnect®, our customers achieve end-to-end service orchestration with seamless integration between service and network layers,” said Sridhar Kuppanna, CTO and SVP Engineering, ST Engineering iDirect. “This collaboration delivers the automation, scalability, and interoperability required to drive growth and meet evolving market demands.”

“The partnership with ST Engineering iDirect removes barriers for satellite operators and service providers, streamlines workflows, and reduces operational complexity, allowing them to focus on business growth,” said David Schmitz, CEO of G&S SatCom. “Operators and service providers can modernize their networks at their own pace, transition to next-generation capabilities with confidence, and maintain uninterrupted service while unlocking new commercial opportunities.”

ST Engineering iDirect, a subsidiary of ST Engineering, is a global leader in satellite communications (satcom) providing technology and solutions that enable its customers to expand their business, differentiate their services and optimize their satcom networks. With over 40 years of delivering innovation focused on solving satellite’s most critical economic and technology challenges we are committed to shaping the future of how the world connects. The product portfolio, branded iDirect, represents the highest standards in performance, efficiency and reliability, making it possible for its customers to deliver the best satcom connectivity experience anywhere in the world. ST Engineering iDirect is a leader in key industries including mobility, broadcast and military/government. In 2007, iDirect Government was formed to better serve the U.S. government and defense communities. For more information visit www.idirect.net.


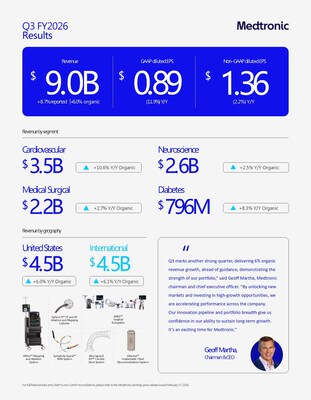
Medtronic reports strong third quarter fiscal 2026 results with highest enterprise revenue growth in 10 quarters

Cardiovascular portfolio up 11% year-over-year; Cardiac Ablation Solutions grew 80% on strength of pulsed field ablation portfolio

GALWAY, Ireland, Feb. 17, 2026 /PRNewswire/ — Medtronic plc (NYSE: MDT), a global leader in healthcare technology, today announced financial results for its third quarter (Q3) of fiscal year 2026 (FY26), which ended January 23, 2026.

Q3 Key Highlights

  • Revenue of $9.0 billion, increased 8.7% as reported and 6.0% organic, 50 basis points ahead of Q3 guidance
  • GAAP diluted EPS of $0.89; non-GAAP diluted EPS of $1.36, three cents ahead of Q3 guidance mid-point
  • Company reiterates FY26 organic revenue growth and EPS guidance
  • Cardiac Ablation Solutions revenue increased 80%, including 137% in the U.S., on strength of pulsed field ablation (PFA) portfolio
  • Secured CE Mark for Sphere-360™ and initiated U.S. pivotal trial
  • Secured U.S. FDA clearance for Hugo™ robotic-assisted surgery; first cases completed this month
  • Secured U.S. FDA clearance for Stealth AXiS™ Surgical System for spinal procedures
  • Diabetes revenue increased 8.3% led by double-digit strength in International markets
  • Executing M&A strategy with two key transactions in the quarter: CathWorks in Coronary and Renal Denervation and Anteris in Structural Heart

“Q3 marks another strong quarter, delivering 6% organic revenue growth, ahead of guidance, demonstrating the strength of our portfolio,” said Geoff Martha, Medtronic chairman and chief executive officer. “By unlocking new markets and investing in high-growth opportunities, we are accelerating performance across the company. Our innovation pipeline and portfolio breadth give us confidence in our ability to sustain long-term growth. It’s an exciting time for Medtronic.”

Financial Results
Medtronic reported Q3 worldwide revenue of $9.017 billion, an increase of 8.7% as reported and 6.0% on an organic basis. The organic revenue growth comparison excludes:

  • Other revenue of $32 million in the current year and $32 million in the prior year
  • Revenue from the Dutch Obesity Clinic (NOK) divestiture with no revenue in the current year and $15 million in the prior year
  • Foreign exchange benefit of $242 million on the remaining segments

Q3 revenue by segment included:

  • Cardiovascular Portfolio revenue of $3.457 billion, an increase of 13.8% as reported and 10.6% organic, with high-teens increase in Cardiac Rhythm & Heart Failure, low-single digit increase in Structural Heart & Aortic, and mid-single digit increase in Coronary & Peripheral Vascular, all on an organic basis
  • Neuroscience Portfolio revenue of $2.558 billion, an increase of 4.1% reported and 2.5% organic, with mid-single digit increase in Neuromodulation, mid-single digit increase in Cranial & Spinal Technologies, and flat result in Specialty Therapies, all on an organic basis
  • Medical Surgical Portfolio revenue of $2.173 billion, an increase of 4.9% as reported and 2.7% organic, with low-single digit increase in Surgical & Endoscopy, and high-single digit increase in Acute Care & Monitoring, all on an organic basis
  • Diabetes business revenue of $796 million, an increase of 14.8% as reported and 8.3% organic

Q3 GAAP operating profit and operating margin were $1.464 billion and 16.2%, respectively. As detailed in the financial schedules included at the end of the release, Q3 non-GAAP operating profit and operating margin were $2.177 billion and 24.1%, respectively.

Q3 GAAP net income and diluted earnings per share (EPS) were $1.143 billion and $0.89, respectively. As detailed in the financial schedules included at the end of this release, Q3 non-GAAP net income and non-GAAP diluted EPS were $1.750 billion and $1.36, respectively.

Guidance
The company reiterates its FY26 organic revenue growth of approximately 5.5% and diluted non-GAAP EPS guidance of $5.62 to $5.66. This includes a potential impact from tariffs of approximately $185 million, unchanged from the prior guidance. Excluding the potential impact from tariffs, this guidance represents FY26 diluted non-GAAP EPS growth of approximately 4.5%.

“This quarter, we again delivered accelerated growth while investing decisively in our future,” said Thierry Piéton, Medtronic chief financial officer. “We continued to invest in R&D to strengthen our innovation pipeline, funded significant growth opportunities while driving G&A leverage, and we executed on our M&A and venture strategy with two key transactions in the quarter. Bottom line, we are executing on our roadmap and positioning the business for sustainable growth.”

Video Webcast Information
Medtronic will host a video webcast today, February 17, at 8:00 a.m. EST (7:00 a.m. CST) to provide information about its business for the public, investors, analysts, and news media. This webcast can be accessed by clicking on the Quarterly Earnings icon at investorrelations.medtronic.com, and this earnings release will be archived at news.medtronic.com. Within 24 hours of the webcast, a replay of the webcast and transcript of the company’s prepared remarks will be available by clicking on the Past Events and Presentations link under the News & Events drop-down at investorrelations.medtronic.com.

Financial Schedules and Earnings Presentation
The third quarter financial schedules and non-GAAP reconciliations can be viewed by clicking on the Quarterly Earnings link at investorrelations.medtronic.com. To view a printable PDF of the financial schedules and non-GAAP reconciliations, click here. To view the earnings presentation, click here.

About Medtronic
Bold thinking. Bolder actions. We are Medtronic. Medtronic plc, headquartered in Galway, Ireland, is the leading global healthcare technology company that boldly attacks the most challenging health problems facing humanity by searching out and finding solutions. Our Mission — to alleviate pain, restore health, and extend life — unites a global team of 95,000+ passionate people across more than 150 countries. Our technologies and therapies treat 70 health conditions and include cardiac devices, surgical robotics, insulin pumps, surgical tools, patient monitoring systems, and more. Powered by our diverse knowledge, insatiable curiosity, and desire to help all those who need it, we deliver innovative technologies that transform the lives of two people every second, every hour, every day. Expect more from us as we empower insight-driven care, experiences that put people first, and better outcomes for our world. In everything we do, we are engineering the extraordinary. For more information on Medtronic (NYSE: MDT), visit www.Medtronic.com and follow on LinkedIn.

FORWARD LOOKING STATEMENTS
This press release contains forward-looking statements within the meaning of the Private Securities Litigation Reform Act of 1995, which are subject to risks and uncertainties, including risks related to competitive factors, difficulties and delays inherent in the development, manufacturing, marketing and sale of medical products, government regulation, geopolitical conflicts, changing global trade policies, material acquisition and divestiture transactions, general economic conditions, and other risks and uncertainties described in the company’s periodic reports on file with the U.S. Securities and Exchange Commission including the most recent Annual Report on Form 10-K of the company. In some cases, you can identify these statements by forward-looking words or expressions, such as “anticipate,” “believe,” “could,” “estimate,” “expect,” “forecast,” “intend,” “looking ahead,” “may,” “plan,” “possible,” “potential,” “project,” “should,” “going to,” “will,” and similar words or expressions, the negative or plural of such words or expressions and other comparable terminology. Actual results may differ materially from anticipated results. Medtronic does not undertake to update its forward-looking statements or any of the information contained in this press release, including to reflect future events or circumstances.

NON-GAAP FINANCIAL MEASURES
This press release contains financial measures, including adjusted net income, adjusted diluted EPS, and organic revenue, which are considered “non-GAAP” financial measures under applicable SEC rules and regulations. References to quarterly or annual figures increasing, decreasing or remaining flat are in comparison to fiscal year 2025, and references to sequential changes are in comparison to the prior fiscal quarter. Unless stated otherwise, quarterly and annual rates and ranges are given on an organic basis.

Medtronic management believes that non-GAAP financial measures provide information useful to investors in understanding the company’s underlying operational performance and trends and to facilitate comparisons with the performance of other companies in the med tech industry. Non-GAAP net income and diluted EPS exclude the effect of certain charges or gains that contribute to or reduce earnings but that result from transactions or events that management believes may or may not recur with similar materiality or impact to operations in future periods (Non-GAAP Adjustments). Medtronic generally uses non-GAAP financial measures to facilitate management’s review of the operational performance of the company and as a basis for strategic planning. Non-GAAP financial measures should be considered supplemental to and not a substitute for financial information prepared in accordance with U.S. generally accepted accounting principles (GAAP), and investors are cautioned that Medtronic may calculate non-GAAP financial measures in a way that is different from other companies. Management strongly encourages investors to review the company’s consolidated financial statements and publicly filed reports in their entirety. Reconciliations of the non-GAAP financial measures to the most directly comparable GAAP financial measures are included in the financial schedules accompanying this press release.

Medtronic calculates forward-looking non-GAAP financial measures based on internal forecasts that omit certain amounts that would be included in GAAP financial measures. For instance, forward-looking organic revenue growth guidance excludes the impact of foreign currency fluctuations, as well as significant acquisitions, divestitures, or other significant discrete items. Forward-looking diluted non-GAAP EPS guidance also excludes other potential charges or gains that would be recorded as Non-GAAP Adjustments to earnings during the fiscal year. Medtronic does not attempt to provide reconciliations of forward-looking non-GAAP EPS guidance to projected GAAP EPS guidance because the combined impact and timing of recognition of these potential charges or gains is inherently uncertain and difficult to predict and is unavailable without unreasonable efforts. In addition, the company believes such reconciliations would imply a degree of precision and certainty that could be confusing to investors. Such items could have a substantial impact on GAAP measures of financial performance.

Contacts:
Justin Paquette 
Public Relations
+1-612-271-7935

Ingrid Goldberg
Investor Relations
+1-763-505-2696


MEDTRONIC PLC

WORLD WIDE REVENUE(1)

(Unaudited)

THIRD QUARTER

YEAR-TO-DATE

REPORTED

ORGANIC

REPORTED

ORGANIC

(in millions)

FY26

FY25

Growth

Currency
Impact(4)

FY26(5)

FY25(5)

Growth

FY26

FY25

Growth

Currency
Impact(4)

FY26(6)

FY25(6)

Growth

Cardiovascular

$     3,457

$  3,037

13.8 %

$         99

$     3,359

$     3,037

10.6 %

$   10,179

$     9,145

11.3 %

$        213

$     9,966

$     9,145

9.0 %

Cardiac Rhythm & Heart Failure    

1,856

1,545

20.1

48

1,808

1,545

17.0

5,394

4,659

15.8

107

5,287

4,659

13.5

Structural Heart & Aortic

929

874

6.3

32

897

874

2.6

2,814

2,610

7.8

71

2,743

2,610

5.1

Coronary & Peripheral Vascular

672

618

8.8

18

654

618

5.9

1,971

1,876

5.0

35

1,935

1,876

3.1

Neuroscience

2,558

2,458

4.1

38

2,520

2,458

2.5

7,536

7,226

4.3

81

7,455

7,226

3.2

Cranial & Spinal Technologies

1,310

1,250

4.8

13

1,296

1,250

3.7

3,819

3,632

5.1

31

3,788

3,632

4.3

Specialty Therapies

746

732

1.9

15

731

732

(0.2)

2,191

2,181

0.4

28

2,163

2,181

(0.8)

Neuromodulation

503

476

5.8

10

493

476

3.6

1,527

1,413

8.1

22

1,504

1,413

6.5

Medical Surgical

2,173

2,072

4.9

61

2,112

2,057

2.7

6,428

6,196

3.7

128

6,295

6,164

2.1

Surgical & Endoscopy

1,654

1,596

3.6

51

1,603

1,581

1.4

4,945

4,790

3.2

106

4,834

4,758

1.6

Acute Care & Monitoring

519

476

9.1

10

509

476

7.0

1,483

1,406

5.5

22

1,461

1,406

3.9

Diabetes

796

694

14.8

44

751

694

8.3

2,274

2,027

12.2

90

2,184

2,027

7.8

Total Reportable Segments

8,985

8,260

8.8

242

8,743

8,245

6.0

26,417

24,593

7.4

512

25,901

24,562

5.4

Other(2)

32

32

3.0

140

17

NM(3)

4

TOTAL

$     9,017

$  8,292

8.7 %

$        243

$     8,743

$     8,245

6.0 %

$   26,557

$   24,610

7.9 %

$        516

$   25,901

$   24,562

5.4 %

See description of non-GAAP financial measures contained in the press release dated February 17, 2026.

(1)

The data in this schedule has been intentionally rounded to the nearest million and, therefore, may not sum. Percentages have been calculated using actual, non-rounded figures and, therefore, may not recalculate precisely.

(2)

Includes the historical operations and ongoing transition agreements from businesses the Company has exited or divested, and for the year-to-date figures, adjustments to the Company’s Italian payback accruals resulting from the two July 22, 2024 rulings by the Constitutional Court and the Legislative Decree published by the Italian government on June 30, 2025 for certain prior years since 2015.

(3)

Not meaningful (NM).

(4)

The currency impact to revenue measures the change in revenue between current and prior year periods using constant exchange rates.

(5)

The three months ended January 23, 2026 excludes $275 million of revenue adjustments, including $32 million of inorganic revenue for the transition activity noted in (2) and $242 million of favorable currency impact on the remaining segments. The three months ended January 24, 2025 excludes $47 million of revenue adjustments, including $32 million of inorganic revenue related to the transition activity noted in (2) and $15 million of inorganic revenue related to a sale of business in the Surgical and Endoscopy division.

(6)

The nine months ended January 23, 2026 excludes $656 million of revenue adjustments, including $39 million reduction in the Italian payback accruals due to changes in estimates further described in note (2), $101 million of inorganic revenue for the transition activity noted in (2), $5 million of inorganic revenue related to a sale of business in the Surgical and Endoscopy division, and $512 million of favorable currency impact on the remaining segments. The nine months ended January 24, 2025 excludes $48 million of revenue adjustments, including $90 million of incremental Italian payback accruals further described in note (2), $106 million of inorganic revenue related to the transition activity noted in (2), and $31 million of inorganic revenue related to a sale of business in the Surgical and Endoscopy division.


MEDTRONIC PLC

U.S. REVENUE(1)(2)

(Unaudited)

THIRD QUARTER

YEAR-TO-DATE

REPORTED

ORGANIC

REPORTED

ORGANIC

(in millions)

FY26

FY25

Growth

FY26

FY25

Growth

FY26

FY25

Growth

FY26

FY25

Growth

Cardiovascular

$     1,589

$     1,405

13.1 %

$     1,589

$     1,405

13.1 %

$     4,660

$     4,242

9.9 %

$     4,660

$     4,242

9.9 %

Cardiac Rhythm & Heart Failure   

953

775

23.0

953

775

23.0

2,708

2,309

17.3

2,708

2,309

17.3

Structural Heart & Aortic

367

372

(1.4)

367

372

(1.4)

1,128

1,129

1,128

1,129

Coronary & Peripheral Vascular

269

258

4.2

269

258

4.2

824

804

2.5

824

804

2.5

Neuroscience

1,709

1,689

1.2

1,709

1,689

1.2

5,063

4,931

2.7

5,063

4,931

2.7

Cranial & Spinal Technologies

977

943

3.6

977

943

3.6

2,833

2,724

4.0

2,833

2,724

4.0

Specialty Therapies

402

419

(4.0)

402

419

(4.0)

1,204

1,235

(2.5)

1,204

1,235

(2.5)

Neuromodulation

330

327

1.1

330

327

1.1

1,026

972

5.6

1,026

972

5.6

Medical Surgical

929

893

4.1

929

893

4.1

2,756

2,718

1.4

2,756

2,718

1.4

Surgical & Endoscopy

634

623

1.7

634

623

1.7

1,920

1,928

(0.4)

1,920

1,928

(0.4)

Acute Care & Monitoring

295

269

9.5

295

269

9.5

836

790

5.8

836

790

5.8

Diabetes

248

236

4.9

248

236

4.9

695

683

1.7

695

683

1.7

Total Reportable Segments

4,475

4,223

6.0

4,475

4,223

6.0

13,174

12,573

4.8

13,174

12,573

4.8

Other(3)

18

15

23.4

60

51

16.8

TOTAL

$     4,493

$     4,237

6.0 %

$     4,475

$     4,223

6.0 %

$   13,234

$   12,624

4.8 %

$   13,174

$   12,573

4.8 %

See description of non-GAAP financial measures contained in the press release dated February 17, 2026.

(1)

U.S. includes the United States and U.S. territories.

(2)

The data in this schedule has been intentionally rounded to the nearest million and, therefore, may not sum. Percentages have been calculated using actual, non-rounded figures and, therefore, may not recalculate precisely.

(3)

Includes historical operations and ongoing transition agreements from businesses the Company has exited or divested.


MEDTRONIC PLC

INTERNATIONAL REVENUE(1)

(Unaudited)

THIRD QUARTER

YEAR-TO-DATE

REPORTED

ORGANIC

REPORTED

ORGANIC

(in millions)

FY26

FY25

Growth

Currency
Impact(4)

FY26(5)

FY25(5)

Growth

FY26

FY25

Growth

Currency
Impact(4)

FY26(6)

FY25(6)

Growth

Cardiovascular

$     1,868

$     1,632

14.5 %

$         99

$     1,770

$     1,632

8.5 %

$     5,519

$     4,904

12.5 %

$        213

$     5,306

$     4,904

8.2 %

Cardiac Rhythm & Heart Failure   

903

770

17.3

48

855

770

11.0

2,686

2,350

14.3

107

2,580

2,350

9.8

Structural Heart & Aortic

562

502

12.0

32

530

502

5.5

1,686

1,482

13.8

71

1,615

1,482

9.0

Coronary & Peripheral Vascular

403

360

12.2

18

385

360

7.1

1,146

1,072

6.9

35

1,111

1,072

3.6

Neuroscience

849

769

10.4

38

811

769

5.4

2,474

2,295

7.8

81

2,392

2,295

4.2

Cranial & Spinal Technologies

333

307

8.4

13

320

307

4.1

985

907

8.6

31

955

907

5.2

Specialty Therapies

343

313

9.7

15

328

313

5.0

987

947

4.3

28

959

947

1.3

Neuromodulation

173

149

16.0

10

163

149

9.1

501

441

13.5

22

478

441

8.4

Medical Surgical

1,244

1,180

5.5

61

1,183

1,165

1.6

3,671

3,478

5.6

128

3,539

3,447

2.7

Surgical & Endoscopy

1,020

973

4.8

51

969

958

1.1

3,024

2,862

5.7

106

2,914

2,831

2.9

Acute Care & Monitoring

224

206

8.5

10

214

206

3.8

647

616

5.0

22

625

616

1.4

Diabetes

548

457

19.8

44

504

457

10.1

1,579

1,344

17.5

90

1,489

1,344

10.9

Total Reportable Segments

4,510

4,038

11.7

242

4,267

4,023

6.1

13,243

12,020

10.2

512

12,726

11,989

6.2

Other(2)

14

17

(14.6)

80

(35)

NM(3)

4

TOTAL

$     4,524

$     4,055

11.6 %

$        243

$     4,267

$     4,023

6.1 %

$   13,323

$   11,986

11.2 %

$        516

$   12,726

$   11,989

6.2 %

See description of non-GAAP financial measures contained in the press release dated February 17, 2026.

(1)

The data in this schedule has been intentionally rounded to the nearest million and, therefore, may not sum. Percentages have been calculated using actual, non-rounded figures and, therefore, may not recalculate precisely.

(2)

Includes the historical operations and ongoing transition agreements from businesses the Company has exited or divested, and for the year-to-date figures, adjustments to the Company’s Italian payback accruals resulting from the two July 22, 2024 rulings by the Constitutional Court and the Legislative Decree published by the Italian government on June 30, 2025 for certain prior years since 2015.

(3)

Not meaningful (NM).

(4)

The currency impact to revenue measures the change in revenue between current and prior year periods using constant exchange rates.

(5)

The three months ended January 23, 2026 excludes $257 million of revenue adjustments, including $14 million of inorganic revenue for the transition activity noted in (2) and $242 million of favorable currency impact on the remaining segments. The three months ended January 24, 2025 excludes $32 million of revenue adjustments, including $17 million of inorganic revenue related to the transition activity noted in (2) and $15 million of inorganic revenue related to a sale of business in the Surgical and Endoscopy division.

(6)

The nine months ended January 23, 2026 excludes $597 million of revenue adjustments, including $39 million reduction in the Italian payback accruals due to changes in estimates further described in note (2), $41 million of inorganic revenue for the transition activity noted in (2), $5 million of inorganic revenue related to a sale of business in the Surgical and Endoscopy division, and $512 million of favorable currency impact on the remaining segments. The nine months ended January 24, 2025 excludes $3 million of revenue adjustments, including $90 million of incremental Italian payback accruals further described in note (2), $55 million of inorganic revenue related to the transition activity noted in (2), and $31 million of inorganic revenue related to a sale of business in the Surgical and Endoscopy division.


MEDTRONIC PLC

CONSOLIDATED STATEMENTS OF INCOME

(Unaudited) 

Three months ended

Nine months ended

(in millions, except per share data)

January 23, 2026

January 24, 2025

January 23, 2026

January 24, 2025

Net sales

$              9,017

$              8,292

$           26,557

$           24,610

Costs and expenses:

Cost of products sold, excluding amortization of intangible assets   

3,261

2,779

9,323

8,485

Research and development expense

722

675

2,202

2,048

Selling, general, and administrative expense

2,956

2,717

8,727

8,129

Amortization of intangible assets

441

416

1,364

1,243

Restructuring charges, net

77

43

131

120

Certain litigation charges, net

62

22

89

104

Other operating expense (income), net

35

(5)

126

(38)

Operating profit

1,464

1,646

4,594

4,519

Other non-operating income, net

(121)

(72)

(247)

(403)

Interest expense, net

181

179

539

555

Income before income taxes

1,404

1,540

4,302

4,367

Income tax provision

254

237

724

737

Net income

1,150

1,303

3,578

3,630

Net income attributable to noncontrolling interests

(6)

(9)

(21)

(24)

Net income attributable to Medtronic

$              1,143

$              1,294

$             3,557

$             3,606

Basic earnings per share

$                0.89

$                1.01

$               2.77

$               2.80

Diluted earnings per share

$                0.89

$                1.01

$               2.76

$               2.79

Basic weighted average shares outstanding

1,282.6

1,282.4

1,282.1

1,286.7

Diluted weighted average shares outstanding

1,289.5

1,286.2

1,288.2

1,290.6

The data in the schedule above has been intentionally rounded to the nearest million.


MEDTRONIC PLC

GAAP TO NON-GAAP RECONCILIATIONS(1)

(Unaudited) 

Three months ended January 23, 2026

(in millions, except per share data)

Net
Sales

Cost of
Products
Sold

Gross
Margin
Percent

Operating
Profit

Operating
Profit
Percent

Income
Before
Income
Taxes

Net Income
attributable
to
Medtronic

Diluted
EPS

Effective
Tax Rate

GAAP

$  9,017

$   3,261

63.8 %

$     1,464

16.2 %

$    1,404

$       1,143

$     0.89

18.1 %

Non-GAAP Adjustments:

Amortization of intangible assets(2)

441

4.9

441

360

0.28

18.4

Restructuring and associated costs(3)

(89)

1.0

172

1.9

172

141

0.11

18.0

Acquisition and divestiture-related items(4)

(6)

0.1

38

0.4

38

33

0.03

13.2

Certain litigation charges, net

62

0.7

62

52

0.04

16.1

(Gain)/loss on minority investments(5)

8

7

0.01

12.5

Certain tax adjustments, net

14

0.01

Non-GAAP

$  9,017

$   3,166

64.9 %

$     2,177

24.1 %

$    2,125

$       1,750

$     1.36

17.3 %

Currency impact

(243)

(52)

(0.4)

(67)

(0.1)

(0.04)

Currency Adjusted

$  8,775

$   3,114

64.5 %

$     2,110

24.0 %

$     1.32

Three months ended January 24, 2025

(in millions, except per share data)

Net
Sales

Cost of
Products
Sold

Gross
Margin
Percent

Operating
Profit

Operating
Profit
Percent

Income
Before
Income
Taxes

Net Income
attributable
to
Medtronic

Diluted
EPS

Effective
Tax Rate

GAAP

$  8,292

$   2,779

66.5 %

$     1,646

19.9 %

$    1,540

$       1,294

$     1.01

15.4 %

Non-GAAP Adjustments:

Amortization of intangible assets

416

5.0

416

339

0.26

18.5

Restructuring and associated costs(3)

(4)

46

0.6

46

37

0.03

19.6

Acquisition and divestiture-related items(4)   

(1)

28

0.3

28

23

0.02

17.9

Certain litigation charges, net

22

0.3

22

18

0.01

22.7

(Gain)/loss on minority investments(5)

68

52

0.04

22.1

Medical device regulations(6)

(8)

0.1

11

0.1

11

9

0.01

18.2

Certain tax adjustments, net

15

0.01

Non-GAAP

$  8,292

$   2,766

66.6 %

$     2,169

26.2 %

$    2,130

$       1,787

$     1.39

15.7 %

See description of non-GAAP financial measures contained in the press release dated February 17, 2026.

(1)

The data in this schedule has been intentionally rounded to the nearest million or $0.01 for EPS figures, and, therefore, may not sum.

(2)

The Company recognized $30 million of accelerated amortization on certain intangible assets within the Cardiovascular Portfolio.

(3)

The charges primarily relate to employee termination benefits, facility related and contract termination costs, and asset write offs.

(4)

The charges primarily include business combination costs, changes in fair value of contingent consideration, exit of business-related charges, and gains related to certain business or asset sales. Exit of business-related charges primarily relate to the impending separation of the Diabetes business. For the three months ended January 23, 2026, charges also include costs associated with the Company’s June 2021 decision to stop the distribution and sale of the Medtronic HVAD System.  

(5)

We exclude unrealized and realized gains and losses on our minority investments as we do not believe that these components of income or expense have a direct correlation to our ongoing or future business operations.

(6)

The charges represent incremental costs of complying with the new European Union (E.U.) medical device regulations for previously registered products and primarily include charges for contractors supporting the project and other direct third-party expenses. We consider these costs to be duplicative of previously incurred costs and/or one-time costs.


MEDTRONIC PLC

GAAP TO NON-GAAP RECONCILIATIONS(1)

(Unaudited)

Nine months ended January 23, 2026

(in millions, except per share data)

Net
Sales

Cost of
Products
Sold

Gross
Margin
Percent

Operating
Profit

Operating
Profit
Percent

Income
Before
Income
Taxes

Net Income
attributable
to Medtronic

Diluted
EPS

Effective
Tax Rate

GAAP

$ 26,557

$   9,323

64.9 %

$     4,594

17.3 %

$    4,302

$         3,557

$     2.76

16.8 %

Non-GAAP Adjustments:

Amortization of intangible assets(2)

1,364

5.2

1,364

1,110

0.86

18.6

Restructuring and associated costs(3)

(105)

0.4

251

1.0

251

202

0.16

19.5

Acquisition and divestiture-related items(4)

(21)

96

0.4

96

73

0.06

24.0

Certain litigation charges, net

89

0.3

89

73

0.06

19.1

(Gain)/loss on minority investments(5)

145

137

0.11

5.5

Other(6)

(39)

(39)

(0.1)

(39)

(30)

(0.02)

20.5

Certain tax adjustments, net(7)

Non-GAAP

$ 26,518

$   9,197

65.3 %

$     6,356

24.0 %

$    6,209

$         5,122

$     3.98

17.2 %

Currency impact

(513)

(48)

(0.5)

(170)

(0.2)

(0.10)

Currency Adjusted

$ 26,005

$   9,149

64.8 %

$     6,185

23.8 %

$     3.88

Nine months ended January 24, 2025

(in millions, except per share data)

Net
Sales

Cost of
Products
Sold

Gross
Margin
Percent

Operating
Profit

Operating
Profit
Percent

Income
Before
Income
Taxes

Net Income
attributable
to Medtronic

Diluted
EPS

Effective
Tax Rate

GAAP

$ 24,610

$   8,485

65.5 %

$     4,519

18.4 %

$    4,367

$         3,606

$     2.79

16.9 %

Non-GAAP Adjustments:

Amortization of intangible assets

1,243

4.9

1,243

1,017

0.79

18.3

Restructuring and associated costs(3)

(24)

0.1

154

0.6

154

124

0.10

19.5

Acquisition and divestiture-related items(4)   

(17)

15

0.1

15

3

73.3

Certain litigation charges, net

104

0.4

104

86

0.07

17.3

(Gain)/loss on minority investments(5)

41

14

0.01

61.0

Medical device regulations(8)

(27)

0.1

38

0.2

38

30

0.02

21.1

Other(6)

90

0.2

90

0.4

90

70

0.05

22.2

Certain tax adjustments, net(7)

49

0.04

Non-GAAP

$ 24,700

$   8,417

65.9 %

$     6,162

24.9 %

$    6,051

$         4,999

$     3.87

17.0 %

See description of non-GAAP financial measures contained in the press release dated February 17, 2026.

(1)

The data in this schedule has been intentionally rounded to the nearest million or $0.01 for EPS figures, and, therefore, may not sum.

(2)

The Company recognized $121 million of accelerated amortization on certain intangible assets within the Cardiovascular Portfolio.

(3)

The charges primarily relate to employee termination benefits, facility related and contract termination costs, and asset write offs.

(4)

The charges primarily include business combination costs, changes in fair value of contingent consideration, exit of business-related charges, and gains related to certain business or asset sales. Exit of business-related charges primarily relate to the impending separation of the Diabetes business and costs associated with the Company’s June 2021 decision to stop the distribution and sale of the Medtronic HVAD System.

(5)

We exclude unrealized and realized gains and losses on our minority investments as we do not believe that these components of income or expense have a direct correlation to our ongoing or future business operations. 

(6)

Reflects adjustments to the Company’s Italian payback accruals resulting from the two July 22, 2024 rulings by the Constitutional Court and the Legislative Decree published by the Italian government on June 30, 2025 for certain prior years since 2015.

(7)

The charges for the nine months ended January 23, 2026 primarily includes a tax benefit recognized due to a change in interest accrued on uncertain tax positions, offset by amortization of previously established deferred tax assets arising from intercompany intellectual property transactions. The charges for the nine months ended January 24, 2025 primarily includes amortization of previously established deferred tax assets arising from intercompany intellectual property transactions.

(8)

The charges represent incremental costs of complying with the new European Union (E.U.) medical device regulations for previously registered products and primarily include charges for contractors supporting the project and other direct third-party expenses. We consider these costs to be duplicative of previously incurred costs and/or one-time costs.


MEDTRONIC PLC

GAAP TO NON-GAAP RECONCILIATIONS(1)

(Unaudited) 

Three months ended January 23, 2026

(in millions)

Net Sales

SG&A
Expense

SG&A
Expense as
a % of Net
Sales

R&D
Expense

R&D
Expense
as a % of
Net Sales

Other
Operating
(Income)
Expense,
net

Other
Operating
(Inc.)/Exp.,
net as a % of
Net Sales

Other Non-
Operating
Income, net

GAAP

$      9,017

$     2,956

32.8 %

$       722

8.0 %

$           35

0.4 %

$          (121)

Non-GAAP Adjustments:

Restructuring and associated costs(2)

(6)

(0.1)

Acquisition and divestiture-related items(3)   

(35)

(0.4)

3

(Gain)/loss on minority investments(4)

(8)

Non-GAAP

$      9,017

$     2,914

32.3 %

$       722

8.0 %

$           38

0.4 %

$          (130)

Nine months ended January 23, 2026

(in millions)

Net Sales

SG&A
Expense

SG&A
Expense as
a % of Net
Sales

R&D
Expense

R&D
Expense
as a % of
Net Sales

Other
Operating
(Income)
Expense,
net

Other
Operating
(Inc.)/Exp.,
net as a % of
Net Sales

Other Non-
Operating
Income, net

GAAP

$    26,557

$     8,727

32.9 %

$    2,202

8.3 %

$         126

0.5 %

$          (247)

Non-GAAP Adjustments:

Restructuring and associated costs(2)

(15)

Acquisition and divestiture-related items(3)   

(96)

(0.3)

21

0.1

Other(5)

(39)

(Gain)/loss on minority investments(4)

(145)

Non-GAAP

$    26,518

$     8,616

32.5 %

$    2,202

8.3 %

$         147

0.6 %

$          (392)

See description of non-GAAP financial measures contained in the press release dated February 17, 2026.

(1)

The data in this schedule has been intentionally rounded to the nearest million, and, therefore, may not sum.

(2)

The charges primarily relate to employee termination benefits, facility related and contract termination costs, and asset write offs.

(3)

The charges primarily include business combination costs, changes in fair value of contingent consideration, exit of business-related charges, and gains related to certain business or asset sales. Exit of business-related charges primarily relate to the impending separation of the Diabetes business and costs associated with the Company’s June 2021 decision to stop the distribution and sale of the Medtronic HVAD System.

(4)

We exclude unrealized and realized gains and losses on our minority investments as we do not believe that these components of income or expense have a direct correlation to our ongoing or future business operations.

(5)

Reflects adjustments to the Company’s Italian payback accruals resulting from the Legislative Decree published by the Italian government on June 30, 2025 for certain prior years since 2015.


MEDTRONIC PLC

GAAP TO NON-GAAP RECONCILIATIONS(1)

(Unaudited)

Nine months ended

(in millions)

January 23, 2026

January 24, 2025

Net cash provided by operating activities

$                      4,757

$                      4,516

Additions to property, plant, and equipment   

(1,416)

(1,400)

Free Cash Flow(2)

$                      3,341

$                      3,116

See description of non-GAAP financial measures contained in the press release dated February 17, 2026.

(1)

The data in this schedule has been intentionally rounded to the nearest million, and, therefore, may not sum.

(2)

Free cash flow represents operating cash flows less property, plant, and equipment additions.


MEDTRONIC PLC

CONSOLIDATED STATEMENTS OF CASH FLOWS

(Unaudited)

Nine months ended

(in millions)

January 23, 2026

January 24, 2025

Operating Activities:

Net income

$                3,578

$                3,630

Adjustments to reconcile net income to net cash provided by operating activities:   

Depreciation and amortization

2,242

2,021

Provision for credit losses

102

96

Deferred income taxes

59

(81)

Stock-based compensation

362

340

Other, net

280

14

Change in operating assets and liabilities, net of acquisitions and divestitures:

Accounts receivable, net

87

(184)

Inventories

(803)

(478)

Accounts payable and accrued liabilities

(77)

(157)

Other operating assets and liabilities

(1,074)

(685)

Net cash provided by operating activities

4,757

4,516

Investing Activities:

Acquisitions, net of cash acquired

(98)

Additions to property, plant, and equipment

(1,416)

(1,400)

Purchases of investments

(6,572)

(6,093)

Sales and maturities of investments

5,982

6,255

Other investing activities, net

(10)

(111)

Net cash used in investing activities

(2,017)

(1,447)

Financing Activities:

Change in current debt obligations, net

173

(1,070)

Issuance of long-term debt

1,747

3,209

Payments on long-term debt

(2,930)

Dividends to shareholders

(2,731)

(2,692)

Issuance of ordinary shares

419

400

Repurchase of ordinary shares

(600)

(2,961)

Other financing activities, net

60

96

Net cash used in financing activities

(3,863)

(3,018)

Effect of exchange rate changes on cash and cash equivalents

52

(95)

Net change in cash and cash equivalents

(1,072)

(44)

Cash and cash equivalents at beginning of period

2,218

1,284

Cash and cash equivalents at end of period

$                1,147

$                1,240

Supplemental Cash Flow Information

Cash paid for:

Income taxes

$                1,598

$                1,515

Interest

573

567

The data in this schedule has been intentionally rounded to the nearest million, and, therefore, may not sum.


Medtronic reports strong third quarter fiscal 2026 results with highest enterprise revenue growth in 10 quarters


PDF – https://mma.prnewswire.com/media/2904972/Earnings_Presentation_FY26Q3_Final.pdf
PDF – https://mma.prnewswire.com/media/2904973/Exhibit_99_1___FY26_Q3_Earnings_Release_2_16.pdf


AT GLOBAL IMPACT SUMMIT, RIVKIN CHAMPIONS CREATOR-CENTERED AI POLICY

AI’s future depends on protecting creativity, building trust, and strengthening value for creators, MPA chairman declares

DELHI, India, Feb. 17, 2026 /PRNewswire/ — On February 16, the opening day of India’s AI Impact Summit, Charles Rivkin, Chairman and CEO of the Motion Picture Association (MPA), joined Shri Ashwini Vaishnaw, Minister for Information & Broadcasting (MIB), Electronics & Information Technology (MeitY), and Railways, Government of India, for a fireside conversation on the future of Artificial Intelligence (AI) and the creative economy.

Both leaders acknowledged that AI represents a new and exciting frontier for the global creative industries – sectors with a long and proven history of embracing transformative technologies in pursuit of creative excellence.

“AI can and must be used to expand creativity in a responsible way,” Rivkin said. “Our member studios are at the forefront of this transformation, recognising the immense potential of AI to enhance storytelling while keeping human creativity at the heart of filmmaking. Strong copyright frameworks are indispensable — they anchor a vibrant creative economy, drive investment in the media & entertainment sector and turn creative ingenuity and storytelling into world-class cultural exports.”

“I commend the Government of India for convening this forum at such a consequential moment,” he added.

Speaking about the intersection of the creative economy and AI, Minister Vaishnaw said: “We believe that human creativity is the most important thing that we have in our entire civilisation. So we must protect it. We must make sure that any system that protects human creativity and enhances it, is a better system. There shouldn’t be a dilutive effect. There should be more of a complementing impact on human creativity.”

The event, Rewarding Our Creative Future in the Age of AI – Strengthening India Through Innovation, Trust and Talent, was organised by the MPA in partnership with the Federation of Indian Chambers of Commerce and Industry (FICCI), MIB, and Creative First, with support from a broad cross-section of film, television and streaming industry organisations.

The AI & Creative Economy track directly supports some of the key pillars underpinning the AI Impact Summit, especially around human capital, trusted AI, and AI for economic and social good. The program builds on the momentum of last year’s WAVES Summit and serves as a bridge to next year’s gathering, reinforcing India’s leadership at the convergence of creativity, technology and culture, and recognizes MPA member studios’ continued contribution to the growth of the screen industry.

The AI Impact Summit, convened at the invitation of Prime Minister Narendra Modi, is positioned as the first major global AI gathering in the southern hemisphere. It has drawn heads of state from 20 nations, ministerial delegations from 45 countries, and CEOs from the biggest technology companies.

Following Monday’s fireside conversation, MPA convened an industry discussion during which production and VFX experts underscored how AI is an active collaborator across the content value chain. The panel session – Where Content Meets Code; Reimagining Storytelling – featured Prasoon Joshi, Poet, Screenwriter, advertising legend and Chairperson of the Central Board of Film Certification; Sushant Sreeram, Head of Marketing & SVOD at JioStar; Tyrone Estephan, Managing Director at Alt.VFX; Merzin Tavaria, Co-Founder and President – Global Production & Operations at DNEG; Niraj Ruparel, Creative Technology Lead at WPP and WPP Media India; and Vatsal Sheth, Co-Founder and CEO of Prismix Studios.

The MPA’s program exploring the intersection of AI and the creative economy will continue throughout 2026 across key markets.

Images from the event are available here.

About The Motion Picture Association

The Motion Picture Association (MPA) serves as the leading voice and advocate of the motion picture, home video, and television industries. It works in every corner of the globe to advance the creative industry, protect its members’ content across all screens, defend the creative and artistic freedoms of storytellers, and support innovative distribution models that bring an expansion of viewing choices to audiences around the world. Its member studios are: Netflix, Paramount Pictures, Prime Video & Amazon MGM Studios, Sony Pictures, Universal Studios, The Walt Disney Studios, and Warner Bros. Discovery. Charles Rivkin is Chairman and CEO.

Little Artists Art Studio, Singapore Shines at Art Capital 2026

PARIS and SINGAPORE, Feb. 17, 2026 /PRNewswire/ — Following the conclusion of Art Capital 2026 at the Grand Palais, Paris, Little Artists Art Studio, Singapore, has once again affirmed its position as a global leader in serious youth art education, marking a rare and consequential consecutive participation at one of the world’s most prestigious and historic art institutions.


Little Artists at Art Capital 2026 Montage

Building on its historic 2025 debut—when Little Artists’ students became the first children ever included in the 200-year history of Art Capital and the studio was awarded the Prix D’Innovation—the 2026 return signals not a singular achievement, but the establishment of a lasting international presence.

During the exhibition, Little Artists’ students presented a curated body of work across age groups, including neurodiverse and special-needs artists, to an international audience of collectors, curators, educators and art professionals. The works were exhibited within the main salon framework, reinforcing the studio’s philosophy that artistic excellence is defined by discipline, depth, and vision—not age. Student were interviewed by international media, jury, art critics, master artists and environmentalist who were impressed by the maturity of the young students imagination and execution.

“To return to the Grand Palais following a historic debut is an exceptional achievement where students works are shown alongside mature and established artists, some whose works are also in the museums. We are grateful to all the Jury who spent their time to consider our students to exhibit their work at Art Capital 2026,” said Shalini Kapoor, Founder and Director of Little Artists Art Studio.

The studio’s presence at Art Capital positions Singapore not merely as a participant in global culture, but as a producer of future cultural leaders, capable of contributing meaningfully to the international art canon. Reflecting on the studio’s impact, Bruno Madelaine, President of the Société des Artistes Français, previously remarked: “We are not accustomed to seeing such young artists here. It is an exceptional event for us, and I am very proud of it.”

Held annually at the Grand Palais, Art Capital brings together more than 3,000 artists and attracts over 150,000 visitors, including leading collectors, curators, critics, and cultural institutions from across the globe. At its core is the Le Salon des Artistes Français, founded in 1881 and descended from the original Paris Salon established under Louis XIV—an institution synonymous with artistic rigor and legacy.

Founded over three decades ago, Little Artists Art Studio has become synonymous with deep foundational training, process-driven artistic development, and international exposure. The studio’s alumni have gone on to study and practice at leading institutions including RISD, Parsons, SOTA, Central Saint Martins, and the Royal College of Art and to exhibit professionally around the world.

As the Art Capital 2026 concludes in Grand Palais, Little Artists Art Studio’s presence stands as a powerful affirmation that the next generation of artists is not waiting in the wings—they are already shaping the future of global art.

The Little Artists at Grand Palais

The Little Artists with the Art Capital jury

Art Capital Jury at Little Artists Exhibit

Datatonic Addresses Productivity Leakage to Move AI From Efficiency to Impact

Datatonic addresses “productivity leakage” as the primary driver of value erosion in enterprise AI value. With only 6% of organizations generating meaningful business impact from AI, Datatonic’s execution-centric framework bridges the gap between pilot-stage efficiency and production-grade financial impact, ensuring AI investments drive revenue rather than just consuming budget. 

LONDON, Feb. 17, 2026 /PRNewswire/ — The era of “good enough” AI efficiency is over. While enterprise investment skyrockets, a silent crisis known as “productivity leakage” is eroding value before it hits the bottom line. Datatonic reinforces its strategic focus to combat this execution gap, providing the infrastructure required to turn isolated efficiency gains into measurable financial returns. Productivity leakage occurs when expected gains from AI fail to translate into business impact because the technology is not embedded into core decision-making structures.

Global AI spending reached $1.5 trillion in 2025, yet only 6% of organizations qualify as high performers generating meaningful business impact, according to McKinsey’s latest State of AI research. The issue is not access to technology but accountability. With 60% of companies lacking defined financial KPIs for AI, many continue to track model accuracy and pilot counts without demonstrating bottom-line results. Datatonic challenges this status quo, offering an engineering-first approach that prioritizes deep workflow integration over superficial tool adoption. 

Defining the Crisis: Why Efficiency Does Not Equal Value 

Most enterprises are bleeding value. They mistake faster email generation for business transformation. This is productivity leakage. Gartner predicts that organizations will abandon 60% of AI projects by 2026 due to a lack of AI-ready data, yet companies continue to pour money into models without fixing their foundations. 

The gap between leaders and underperformers is widening. AI ROI Leaders focus on revenue growth and business model reimagination, while underperformers settle for minor speed improvements. Productivity leakage is the defining difference. Without a defined business problem and a production-grade data foundation, AI initiatives are simply expensive experiments. 

We see companies celebrating ‘productivity’ while their bottom line remains stagnant,” says Scott Eivers, CEO of Datatonic. “We exist to stop the bleeding and restore accountability back into the AI conversation. You don’t need another pilot program; you need to evolve your operating model to capture true value.”

Bridging the Gap: From Leakage to Leverage 

Datatonic’s solution targets the three primary drivers of productivity leakage: poor data readiness, lack of workflow redesign, and resistance to change management. By moving beyond isolated GenAI pilots to agentic, scalable workflows, enterprises can finally capture the value they were promised. 

  • Data Readiness First: As IBM notes, data quality is one of the most common reasons AI initiatives fail. Models shouldn’t be deployed on broken foundations; AI-ready data is essential for scalable impact.
  • Workflow Transformation: McKinsey data shows that organizations reporting significant financial returns are twice as likely to redesign workflows before selecting AI tools. Agentic systems deliver the most value when they operate with context and integrate directly into core business processes.
  • Outcome-Oriented Deployment: Moving from “good enough” to production-grade requires rigor. Datatonic focuses on execution-centric AI that drives direct financial return, such as dramatic cost reductions in invoice processing and accelerated content discovery.

“AI projects that don’t directly drive revenue or protect the bottom line are failures. The real ROI isn’t in new tools, but in redesigning workflows for agentic AI. Whether it’s embedding intelligence into core operations to reduce churn or replacing static concepts with actualized results—the advantage belongs to those who use AI to deliver the outcome, not just the idea,” says Andy Harding, CTO of Datatonic. 

The End of the Pilot Era

As enterprises face tighter budget scrutiny and longer ROI timelines, the tolerance for speculative AI projects has evaporated. Datatonic positions itself as the partner for the leaders willing to undertake the structural changes necessary for survival.

This is not about layering technology; it is about business survival. As AI investment accelerates, the real barrier is no longer access to tools but the ability to execute at scale. Datatonic leverages production-grade AI ecosystems to orchestrate systems that act with reliability and oversight, allowing companies to close the gap between early productivity gains and genuine operational value.

“The time for playing with AI is over,” asserts Harding. “You are either embedding AI into the DNA of your business to drive revenue, or you are leaking productivity until you forfeit your competitive advantage. The choice is yours.” 

About Datatonic 
Datatonic is a global Data and AI consultancy and 10-time Google Cloud Partner of the Year, helping enterprises turn data and AI into clear, measurable business outcomes. As an end-to-end partner, Datatonic drives rapid transformation across strategy, architecture, deployment, enablement, and continuous optimization, empowering organizations to scale AI impact. Learn more at datatonic.com. 

References:

  • Orsborn, M. (2026, January 5). Measuring what matters — AI ROI beyond the hype. Medium. medium.com/@markorsborn/post-10-measuring-what-matters-ai-roi-beyond-the-hype-b9c7eed5071e 
  • Aquino, J., & Jonker, A. (2026, January 15). AI Data Quality. Ibm.com. ibm.com/think/topics/ai-data-quality 
  • Mayer, H., Yee, L., Chui, M., & Roberts, R. (2025, January 28). Superagency in the workplace: Empowering people to unlock ai’s full potential. McKinsey & Company. mckinsey.com/capabilities/tech-and-ai/our-insights/superagency-in-the-workplace-empowering-people-to-unlock-ais-full-potential-at-work
  • Singh, R. (2025, August 24). 95% of companies are getting zero return on their AI investments. Medium; GenusofTechnology. medium.com/genusoftechnology/95-of-companies-are-getting-zero-return-on-their-ai-investments-2a5fe7242f29
  • The Ai Consultancy. (2026, January 20). The 40% problem: Why most UK small business AI projects fail and what the survivors do differently. Medium. medium.com/@ai_93276/the-40-problem-why-most-uk-small-business-ai-projects-fail-and-what-the-survivors-do-differently-e27c117ef0e7

Media Contact:
Karla Jo Helms
JOTO PR™
727-777-4629
jotopr.com