Home Blog Page 150

Power, Comfort and Peace of Mind Put the VinFast VF 8 on the Middle East EV Map

As more Middle East drivers move closer to their first EV purchase, familiar SUV proportions, strong performance and practical ownership support could matter as much as the electric powertrain itself.


DUBAI, UAE – Media OutReach Newswire – 27 August 2026 – The Middle East’s EV market is growing quickly, but it remains far from saturated. Electric car sales in the region reached about 75,000 units in 2025, up more than 40% year on year, according to the International Energy Agency[1]. The UAE alone accounted for almost half of regional EV sales, while Saudi Arabia and Qatar together represented nearly 45% of regional demand.

Photo (28).jpg

With more buyers moving from curiosity to consideration, the next question is what makes an EV feel like a natural replacement for a conventional car. For the VinFast VF 8, the answer comes down to three things: SUV performance, a comfort-focused cabin and an ownership package that goes well beyond the showroom.

SUV performance that means business

The Middle East has a long-standing appetite for SUVs, and the VF 8 speaks that language in electric form. Its dual-motor all-wheel-drive system produces up to 402 horsepower and 620 Nm of torque in the Plus version, while the Eco delivers 349 horsepower and 500 Nm.

The numbers translate into brisk performance, with the VF 8 Plus targeting 0-100 km/h in less than 5.5 seconds and the Eco at 5.9 seconds. Both versions use an 87.7-kWh usable battery, with claimed NEDC ranges of up to 476 km for the Plus and 493 km for the Eco. DC fast charging from 10% to 70% takes a listed 31 minutes.

Going electric does not require giving up the urge to put your foot down. Actual range and performance will vary with driving style, passengers, load, tires, weather and road conditions.

A cabin that takes comfort seriously

Performance may get attention, but the cabin is where drivers spend most of their time. The VF 8 comes with a 15.6-inch infotainment display, two-zone automatic climate control, air-quality control and cabin filtration with an air ionizer.

The Plus adds 12-way powered driver’s seat adjustment with heating, ventilation and memory, alongside a heated and ventilated front passenger seat and heated, ventilated and reclining rear seats. A panoramic sunroof, heated power-adjustable steering wheel and 10-speaker audio system with a subwoofer round out the package.

The technology continues through the companion app, which supports remote vehicle controls, driver profiles, driving statistics and vehicle diagnostics. Over-the-air updates can also deliver software improvements without a workshop visit.

Ownership support that lasts beyond the test drive

A fast-growing EV market also means buyers are asking practical questions surrounding ownership: charging, servicing, repairs and battery longevity.

The VF 8 addresses those concerns with a 10-year or 200,000-km vehicle warranty and a 10-year unlimited-kilometer battery warranty. The package also includes five years or 100,000 km of free service, 24/7 mobile services and roadside assistance, access to DC fast charging and a parts supply target of 24 hours in key markets.

VinFast is also expanding the infrastructure behind that promise. At its 2026 Global Business Conference, the company signed MOUs with 29 aftersales partners, including partners serving the Middle East, and set a target of more than 1,100 service workshops globally in 2026.

For a region where EV adoption is accelerating, the VF 8 arrives with a familiar formula: SUV proportions, plenty of power and a cabin designed for comfort. The electric bit is new; the reasons to want the car are rather more familiar.

Hashtag: #VinFast

The issuer is solely responsible for the content of this announcement.

Youxin Technology Ltd Reports First Half of Fiscal Year 2026 Financial Results

GUANGZHOU, China, Aug. 27, 2026 /PRNewswire/ — Youxin Technology Ltd (Nasdaq: YAAS) (“Youxin Technology” or the “Company”), a software as a service (“SaaS”) and platform as a service (“PaaS”) provider, today announced its unaudited financial results for the first half of fiscal year 2026 ended March 31, 2026.

Mr. Shaozhang Lin, Chief Executive Officer of Youxin Technology Ltd, commented, “We delivered strong revenue growth for the first half of fiscal year 2026, with revenue increasing 444% and gross profit increasing 496%. Gross margin increased to 41% from 37% in the prior-year period. The increase in revenue was primarily attributable to the consolidation of Celnet Technology Co., Ltd. (“Celnet”), with the acquisition completed on October 29, 2025 (the “Acquisition”), together with the gradual growth from our customized CRM system development services.

“We are encouraged by the growing recognition of our third-generation PaaS platform as we expand partnerships with distributors, leading more customers to adopt and pay for our services. As we expand our distributor network and customer base, we anticipate additional opportunities to generate revenue from platform licenses and professional services. At the same time, as of March 31, 2026, we had continued advancing our PaaS platform from the third to fifth generation, incorporating an AI-powered digital enablement solution (“AI + PaaS”) while enhancing its functionality and performance in response to customer feedback and evolving market demand.

“Looking ahead, we will continue to strengthen relationships with distributors, prospective customers, government agencies, and industry partners to support the adoption of our platform. We also plan to continue investing in research and development to advance our AI-enabled digital solutions and support the commercialization and market development of our fifth-generation AI-powered PaaS platform. We believe these efforts will further strengthen our platform capabilities, broaden our customer and distribution network, and position us for long-term business growth.”

First Half of Fiscal Year 2026 Financial Overview

  • Revenue was $1.88 million for the six months ended March 31, 2026, an increase of 444% from $0.35 million for the same period of last year.
  • Gross profit was $0.77 million for the six months ended March 31, 2026, an increase of 496% from $0.13 million for the same period of last year.
  • Gross margin was 41% for the six months ended March 31, 2026, an increase from 37% for the same period of last year.

First Half of Fiscal Year 2026 Financial Results

Revenues

Total revenues were $1.88 million for the six months ended March 31, 2026, an increase of 444% from $0.35 million for the same period of last year. The increase was mainly because the Company completed the acquisition of Celnet’s results of operations following the Acquisition on October 29, 2025, together with the gradual growth from its customized CRM system development services.

For the six months ended March 31,

2026

2025

($)

Revenue

Cost of
Revenue

Gross
Margin

Revenue

Cost of
Revenue

Gross
Margin

Professional services

1,751,139

1,015,595

42

%

229,665

142,405

38

%

Subscription service

88,879

63,976

28

%

97,128

70,812

27

%

Payment channel services and others

43,236

31,203

28

%

19,220

3,169

84

%

Total

1,883,254

1,110,774

41

%

346,013

216,386

37

%

Revenue from professional services was $1.75 million for the six months ended March 31, 2026, or an increase of 662% from $0.23 million for the same period of last year.

  • Revenue from customized CRM system development services was $0.83 million for the six months ended March 31, 2026, an increase of 274% from $0.22 million for the same period of last year. The increase was mainly due to the Company’s consolidation of Celnet and continue progressing the customized CRM system development service.
  • Revenue from the data and workflow migration service, staff outsourcing service and operations and maintenance service was $0.36 million, $0.49 million, and $0.06 million for the six months ended March 31, 2026. The Company didn’t generate revenue from the data and workflow migration service, staff outsourcing service, or operations and maintenance service for the same period of last year. Revenue from the additional function development services was $21,935 for the six months ended March 31, 2026, an increase of 138% from $9,211 for the same period of last year. The increase was mainly primarily driven by growing demand for the function development from existing clients for the six months ended March 31, 2026.

Revenue from subscription service was $0.09 million for the six months ended March 31, 2026, or a decrease of 8% from $0.10 million for the same period of last year.

Revenue from payment channel services and others was $0.04 million for the six months ended March 31, 2026, or an increase of 125% from $0.02 million for the same period of last year.

Cost of Revenues

Cost of revenues was $1.11 million for the six months ended March 31, 2026, an increase of 413% from $0.22 million for the same period of last year.

Gross Profit

Gross profit was $0.77 million for the six months ended March 31, 2026, compared to $0.13 million for the same period of last year.

Gross margin was 41% for the six months ended March 31, 2026, an increase from 37% for the same period of last year.

Operating Expenses

Operating expenses were $2.65 million for the six months ended March 31, 2026, compared to $1.40 million for the same period of last year.

  • Selling expenses were $0.26 million for the six months ended March 31, 2026, an increase of 156% from $0.10 million for the same period of last year. The increase was mainly due to the selling expenses incurred in Celnet of $0.21 million and the amortization of customer relationship of $0.04 million, which was due to the Acquisition.
  • General and administrative expenses were $2.05 million for the six months ended March 31, 2026, an increase of 76% from $1.16 million for the same period of last year. The increase was primarily due to the general and administrative expenses incurred in Celnet of $0.25 million and the share-based compensation related to the shares issued to external consultants in exchange for professional services provided in the past of $0.64 million.
  • Research and development expenses were $0.34 million for the six months ended March 31, 2026, an increase of 143% from $0.14 million for the same period of last year. The increase was primarily attributed to increased investment in AI-related development and higher salaries for research and development personnel for the six months ended March 31, 2026 compared to the six months ended March 31, 2025.

Other Income (Expense), Net

Total net other income was $0.03 million for the six months ended March 31, 2026, compared to a net other expense of $0.46 million for the same period of last year.

Net Loss

Net loss was $1.87 million for the six months ended March 31, 2026, compared to $1.74 million for the same period of last year.

Net Loss Attributable to Ordinary Shareholders

Net loss attributable to ordinary shareholders was $1.93 million for the six months ended March 31, 2026, compared to $1.74 million for the same period of last year.

Basic and Diluted Loss per Share

Basic and diluted loss per share was $0.20 for the six months ended March 31, 2026, compared to $0.19 for the same period of last year.

Financial Condition

As of March 31, 2026, the Company had cash of $4.55 million, compared to $9.91 million as of September 30, 2025.

Net cash used in operating activities was $1.21 million for the six months ended March 31, 2026, compared to $2.26 million for the same period of last year.

Net cash used in investing activities was $4.18 million for the six months ended March 31, 2026, compared to $3.44 million for the same period of last year.

Net cash provided by financing activities was $0.09 million for the six months ended March 31, 2026, compared to $7.24 million for the same period of last year.

About Youxin Technology Ltd

Youxin Technology Ltd is a SaaS and PaaS provider committed to helping retail enterprises digitally transform their businesses through its cloud-based SaaS product and PaaS platform. The Company provides customized, comprehensive and fast-deployment omnichannel digital solutions to its customers. For more information, please visit the Company’s website: https://ir.youxin.cloud.

Forward-Looking Statements

Certain statements in this announcement are forward-looking statements. These forward-looking statements involve known and unknown risks and uncertainties and are based on the Company’s current expectations and projections about future events that the Company believes may affect its financial condition, results of operations, business strategy and financial needs. Investors can identify these forward-looking statements by words or phrases such as “approximates,” “assesses,” “believes,” “hopes,” “expects,” “anticipates,” “estimates,” “projects,” “intends,” “plans,” “will,” “would,” “should,” “could,” “may” or similar expressions. The Company undertakes no obligation to update or revise publicly any forward-looking statements to reflect subsequent occurring events or circumstances, or changes in its expectations, except as may be required by law. Although the Company believes that the expectations expressed in these forward-looking statements are reasonable, it cannot assure you that such expectations will turn out to be correct, and the Company cautions investors that actual results may differ materially from the anticipated results and encourages investors to review other factors that may affect its future results in the Company’s registration statement and other filings with the SEC. References and links (including QR codes) to websites have been provided as a convenience, and the information contained on such websites is not incorporated by reference into this press release.

For investor and media inquiries, please contact:

Youxin Technology Ltd
Investor Relations Department
Email: ir@youxin.cloud

Ascent Investor Relations LLC

Tina Xiao
Phone: +1-646-932-7242
Email: investors@ascent-ir.com


YOUXIN TECHNOLOGY LTD

UNAUDITED CONDENSED CONSOLIDATED BALANCE SHEETS

AS OF MARCH 31, 2026 AND SEPTEMBER 30, 2025

(Expressed in U.S. dollars, except for the number of shares)

March 31, 2026

September 30, 2025

(Unaudited)

ASSETS

CURRENT ASSETS

Cash

$

4,552,381

$

9,912,327

Restricted cash

25,077

24,298

Accounts receivable, net

491,723

213,772

Contract assets

592,412

–

Deferred contract costs

24,124

13,103

Amount due from a related party

22,251

17,486

Prepaid expenses and other current assets

792,249

295,559

Total current assets

6,500,217

10,476,545

NON-CURRENT ASSETS

Property and equipment, net

44,280

2,518

Intangible assets, net

432,300

–

Operating lease right-of-use assets

149,120

78,862

Other non-current assets

10,792

10,457

Long-term prepayments

3,004,769

–

Prepayment for acquisition

–

210,704

Goodwill

1,223,018

–

Deferred tax assets, net

133,834

–

Total non-current assets

4,998,113

302,541

TOTAL ASSETS

$

11,498,330

$

10,779,086

LIABILITIES AND SHAREHOLDERS’ EQUITY

CURRENT LIABILITIES

Short-term bank loan

$

608,872

$

318,865

Accounts payable

76,407

34,190

Contract liabilities

253,659

30,024

Accrued expenses and other current liabilities

72,363

87,439

Payroll payable

1,429,372

1,134,532

Warrant liabilities

335,852

902,287

Amount due to related parties

582,748

–

Long-term bank loan – current

51,740

–

Operating lease liabilities – current

103,299

46,190

Deferred acquisition consideration – current

156,101

–

Total current liabilities

3,670,413

2,553,527

NON-CURRENT LIABILITIES

Operating lease liabilities – non-current

44,421

35,306

Deferred acquisition consideration – non-current

151,116

–

Total non-current liabilities

195,537

35,306

TOTAL LIABILITIES

$

3,865,950

$

2,588,833

COMMITMENTS AND CONTINGENCIES (NOTE 19)

–

–

SHAREHOLDERS’ EQUITY

Class A ordinary shares, ($0.04 par value, 40,950,000 shares
authorized, 545,512 and 465,110 shares issued and outstanding as of
March 31, 2026 and September 30, 2025, respectively) (1)

21,820

18,604

Class B ordinary shares, ($0.0001 par value, 20,000,000 shares
authorized, 8,945,307 shares issued and outstanding as of March 31,
2026 and September 30, 2025)

895

895

Additional paid-in capital

33,261,226

32,614,603

Accumulated deficit

(26,997,783)

(25,065,907)

Accumulated other comprehensive income

594,179

622,058

Total Youxin Technology Ltd shareholders’ equity

6,880,337

8,190,253

Non-controlling interests

752,043

–

Total shareholders’ equity

7,632,380

8,190,253

TOTAL LIABILITIES AND SHAREHOLDERS’ EQUITY

$

11,498,330

$

10,779,086

(1)

All per share amounts and shares outstanding for all periods have been retroactively adjusted to reflect the 1-for-
80 reverse share split and 1-for-5 reverse share split for Class A ordinary share of Youxin Technology Ltd, which
was effective on September 30, 2025 and July 30, 2026, respectively.


YOUXIN TECHNOLOGY LTD

UNAUDITED CONDENSED CONSOLIDATED STATEMENTS OF OPERATIONS AND COMPREHENSIVE LOSS

FOR THE SIX MONTHS ENDED MARCH 31, 2026 AND 2025

(Expressed in U.S. dollars, except for the number of shares)

Six Months Ended March 31,

2026

2025

REVENUES

$

1,883,254

$

346,013

COST OF REVENUES

(1,110,774)

(216,386)

GROSS PROFIT

772,480

129,627

OPERATING EXPENSES

Selling expenses

(257,887)

(100,558)

General and administrative expenses

(2,047,803)

(1,162,739)

Research and development expenses

(341,420)

(140,261)

Total operating expenses

(2,647,110)

(1,403,558)

LOSS FROM OPERATIONS

(1,874,630)

(1,273,931)

OTHER INCOME (EXPENSE)

Other income

44,152

184

Other expense

(61,425)

(6,711)

Investment loss

(518,235)

(457,242)

Change in fair value of warrant liabilities

560,596

–

Total other income (expense), net

25,088

(463,769)

LOSS BEFORE TAXES

(1,849,542)

(1,737,700)

Income tax expense

(19,655)

–

NET LOSS

(1,869,197)

(1,737,700)

Less: Net income attributable to non-controlling interests

62,679

–

Net loss attributable to ordinary shareholders

$

(1,931,876)

$

(1,737,700)

NET LOSS

$

(1,869,197)

$

(1,737,700)

Other comprehensive loss:

Foreign currency translation (loss) income

(24,315)

89,206

TOTAL COMPREHENSIVE LOSS

(1,893,512)

(1,648,494)

Less: Comprehensive income attributable to non-controlling interests

66,243

–

Total comprehensive loss attributable to ordinary shareholders

$

(1,959,755)

$

(1,648,494)

Basic and diluted loss per share

$

(0.20)

$

(0.19)

Weighted average number of ordinary shares outstanding – basic and
diluted (1)

9,441,459

9,004,167

(1)

All per share amounts and shares outstanding for all periods have been retroactively adjusted to reflect the 1-for-
80 reverse share split and 1-for-5 reverse share split for Class A ordinary share of Youxin Technology Ltd, which
was effective on September 30, 2025 and July 30, 2026, respectively.


YOUXIN TECHNOLOGY LTD

UNAUDITED CONDENSED CONSOLIDATED STATEMENTS OF CASH FLOWS

FOR THE SIX MONTHS ENDED MARCH 31, 2026 AND 2025

(Expressed in U.S. dollars, except for the number of shares)

Six Months Ended March 31,

2026

2025

Cash flows from operating activities

Net loss

$

(1,869,197)

$

(1,737,700)

Adjustments to reconcile net loss to cash used in operating
activities:

Expected credit loss of doubtful accounts

43,163

–

Amortization of operating right-of-use assets

29,167

24,524

Depreciation and amortization

48,196

716

Investment loss

518,235

457,242

Change in fair value of warrant liabilities

(560,596)

–

Amortization of discount on deferred acquisition consideration

4,118

–

Stock-based compensation

644,000

–

Deferred income taxes

19,655

–

Changes in operating assets and liabilities

Accounts receivable

342,521

(33,923)

Amount due from related parties

(4,764)

–

Amount due to related parties

14,682

–

Deferred contract costs

(11,021)

–

Contract assets

(266,686)

–

Prepaid expenses and other current assets

55,004

(510,774)

Other non-current assets

–

350

Accounts payable

11,328

2,412

Operating lease liabilities

(28,713)

(24,151)

Payroll Payable

(176,530)

(250,368)

Accrued expenses and other current liabilities

(140,633)

21,546

Contract liabilities

114,636

(206,570)

Net cash used in operating activities

(1,213,435)

(2,256,696)

Cash flows from investing activities

Purchase of property and equipment

(38,642)

–

Purchase of short-term investments

(619,031)

(3,440,000)

Redemption of short-term investments

100,915

–

Prepayment for purchase of property

(2,969,213)

–

Acquisition of subsidiaries, net of cash acquired of $58,651

(155,497)

–

Loan to a third party

(500,000)

–

Net cash used in investing activities

(4,181,468)

(3,440,000)

Cash flows from financing activities

Loan from a related party

282,613

–

Repayment to a related party

(141,260)

(978,594)

Proceeds from short-term bank loans

285,467

–

Repayment of short-term bank loans

(324,006)

–

Repayment of long-term bank loans

(15,881)

–

Issuance of ordinary shares upon warrant series b exercise

2

–

Issuance of ordinary shares upon IPO

–

10,350,000

Payment of offering costs

–

(2,133,785)

Net cash provided by financing activities

86,935

7,237,621

Effect of exchange rates on cash

(51,199)

76,811

Net (decrease) increase in cash and restricted cash

(5,359,167)

1,617,736

Cash and restricted cash at beginning of period

9,936,625

43,021

Cash and restricted cash at end of period

$

4,577,458

$

1,660,757

Reconciliation of cash and restricted cash with consolidated
balance sheets:

Cash

$

4,552,381

$

1,636,920

Restricted cash

25,077

23,837

Cash and restricted cash at end of period

$

4,577,458

$

1,660,757

SUPPLEMENTAL DISCLOSURE OF CASH FLOW
INFORMATION

Cash paid for interest expenses

$

7,194

$

–

Cash paid for income tax

$

–

$

–

SUPPLEMENTAL DISCLOSURE OF NON-CASH FLOWS
INFORMATION:

Operating lease assets obtained in exchange for operating lease
obligations

$

7,423

$

–

Deduction of issuance proceeds of prior years deferred offering cost

$

–

$

478,108

Deferred consideration recognized for acquisition

$

298,561

$

–


Frost & Sullivan Launches New Industry-Tuned AI Brand Equity and Market Presence Advisory Service Powered by Optivara

New service helps companies assess and strengthen their brand presence across AI assistants and search platforms

LONDON, Aug. 27, 2026 /PRNewswire/ — Frost & Sullivan today announced the launch of its AI Brand Equity and Market Presence service, powered by Optivara. This service enables companies to understand how they appear across AI answer engines, how they compare to competitors, their competitive placement by funnel stage, and whether AI-generated market narratives reflect the position they have worked to build.

Designed for marketing, brand, communications and strategy leaders seeking to understand how AI systems represent their organisations throughout the buyer journey, the service identifies visibility gaps, competitive advantages, narrative inconsistencies and the external sources influencing AI-generated answers. These findings are translated into prioritised actions spanning content, messaging, digital authority, third-party validation and market positioning.

For two decades, digital discovery was shaped largely by search engines. Today, buyers are increasingly asking AI systems which suppliers to consider, how companies compare, what risks to evaluate, and which providers are best positioned for their needs. These AI systems are effectively becoming top-of-funnel sales reps.

The service combines Optivara’s AI industry-tuned market presence platform with Frost & Sullivan’s industry expertise, analyst insights, and subject-matter expert validation. Clients receive a market presence benchmark, a competitive peer map, an AI-answer narrative review, a source diagnosis, and a detailed SWOT analysis. From that, an actionable roadmap to better control AI brand dynamics and drive demand is developed and implemented.

“AI is quickly becoming part of how buyers form a first impression of a market, a category, and a supplier,” said Brian Cotton, Senior Vice President of Growth Advisory at Frost & Sullivan. “What makes this service so valuable is not just the technology. It is Frost & Sullivan’s ability to help tune the Optivara platform and interpret the findings through an industry lens. Our analysts and subject matter experts understand the market context, the competitors, the buying criteria, and the strategic shifts our clients are trying to make. That is the difference between getting data and getting results.”

“Optivara was built to reverse-engineer how AI thinks about companies, why they are being represented that way, and what can be done to improve it,” said George Schoenstein, Co-Founder at Optivara. “Partnering with Frost & Sullivan brings an important layer of market expertise and industry-tuning to the process. Together, we can help leadership teams understand whether AI is reinforcing their strategy, missing their story, or allowing competitors and third-party sources to define the narrative. Together, this enables companies to optimise the impact of their marketing dollars.”

To learn more about Frost & Sullivan’s AI Brand Equity and Market Presence advisory services, or request an introductory consultation and demonstration, contact Brian Cotton at brian.cotton@frost.com.

About Frost & Sullivan
Frost & Sullivan, the Growth Pipeline Company, enables clients to accelerate growth and achieve best-in-class positions in growth, innovation, and leadership. The company’s Growth Pipeline as a Service provides the CEO’s Growth Team with transformational strategies and best-practice models to drive the generation, evaluation, and implementation of powerful growth opportunities. For over 60 years, Frost & Sullivan has partnered with investors, corporate leaders, and governments to identify, prioritise, and execute transformational growth strategies.

Your Transformational Growth Journey Starts Here: Schedule Your Growth Pipeline Dialog™ with the Frost & Sullivan team.

Contact:
Kristina Menzefricke
Marketing & Communications
Global Customer Experience, Frost & Sullivan
kristina.menzefricke@frost.com

About Optivara
Optivara is the industry-tuned Generative Engine Optimization (GEO) platform built for agencies. We help agency teams measure and improve client AI answer engine performance by reverse-engineering competitors and top performers in a segment and translating those insights into a roadmap and SWOT analysis to win across the entire customer journey. Our human-in-the-loop, industry-tuned expert models show exactly what to do to improve visibility, reputation, and geographic answer engine performance, while our Generative Positioning Score™ (GPS) provides a consistent way to measure progress over time. To learn more, visit www.optivara.ai or contact pr@optivara.ai

Fosun International Reports 1H2026 Results: Total Revenue RMB86.96 Billion, Net Profit RMB1.72 Billion

Highlights:

  • Total revenue reached RMB86.96 billion, and profit attributable to owners of the parent reached RMB1.72 billion, representing a year-on-year increase of 160.3%;
  • Operational quality of core industries steadily improved, with industrial operation profit reaching RMB3.69 billion, representing a year-on-year increase of 17%;
  • Global operational capabilities continued to improve, with overseas revenue reaching RMB49.16 billion, representing a year-on-year increase of 5.3% and accounting for 56.5% of the Group’s total revenue;
  • Investment in technology innovation reached RMB4.2 billion, representing a year-on-year increase of 16.7%. Innovative drugs entered a period of intensive approvals and value realization, with a total of 20 indications of 7 innovative drugs approved for launch both domestically and overseas;
  • Adhering to proactive and prudent liquidity and debt management, Fosun generated proceeds equivalent to more than RMB12.0 billion from the divestment of non-strategic and non-core assets in the first half of the year, bringing the total debt to total capital ratio down to 55.7%;
  • MSCI ESG rating was upgraded to the highest rating of AAA, reflecting continued recognition from international authoritative institutions.

HONG KONG, Aug. 27, 2026 /PRNewswire/ — Fosun International Limited (HKEX stock code: 00656, “Fosun International”), together with its subsidiaries (“Fosun” or the “Group”), today announced its interim results for the six months ended 30 June 2026 (the “Reporting Period”).

In the first half of 2026, Fosun continued to advance its business streamlining and core business-focused strategy. Powered by the twin engines of innovation and globalization, the operational quality of its core industries, including pharmaceuticals and healthcare, insurance and finance, and cultural tourism and consumer businesses, steadily improved and gained collective momentum, driving a notable increase in profitability. During the Reporting Period, the Group’s total revenue reached RMB86.96 billion, remaining broadly stable despite the continued divestment of non-strategic and non-core assets; industrial operation profit reached RMB3.69 billion, representing a year-on-year increase of 17%; and profit attributable to owners of the parent reached RMB1.72 billion, representing a significant year-on-year increase of 160.3%.

During the Reporting Period, Fosun’s asset base remained solid, with its subsidiaries Fosun Pharma, Yuyuan, Fosun Insurance Portugal (Fidelidade), and Fosun’s Tourism segment generating a total revenue of RMB63.88 billion, accounting for 73.5% of the Group’s total revenue. Overseas revenue reached RMB49.16 billion, representing a year-on-year increase of 5.3%. Its share of total revenue rose by 3 percentage points to 56.5%, underscoring the success of its globalization strategy.

Meanwhile, Fosun adhered to proactive and prudent liquidity and debt management, maintaining sufficient liquidity buffer. During the Reporting Period, the Group generated proceeds equivalent to more than RMB12.0 billion from the divestment of non-strategic and non-core assets. As at 30 June 2026, cash, bank balances and term deposits amounted to RMB61.214 billion, an increase compared to the end of 2025; the total debt to total capital ratio was 55.7%, a further decrease compared to the end of 2025. A healthy debt ratio and ample cash reserves strengthen the Group’s risk resilience while also enhancing its capacity to seize investment opportunities.

Guo Guangchang, Chairman of Fosun International, said: “Over the past few years, Fosun has steadfastly advanced its business streamlining and core business-focused strategy, and completed a systematic realignment of ‘repairing the roof on a sunny day’. The strong earnings recovery we delivered in the first half of this year validates our strategic direction and sustained focus. Fosun has now returned to a growth trajectory and is well-positioned to accelerate its growth going forward.”

Adhering to Innovation-Driven Development, Innovative Drugs Enter a Period of Intensive Approvals and Value Realization

In the first half of 2026, Fosun remained committed to innovation-driven development, fully embraced AI applications, accelerated the conversion of its technology innovations into tangible value, and continued to enhance operational efficiency. During the Reporting Period, Fosun’s investment in technology innovation reached RMB4.2 billion, representing a year-on-year increase of 16.7%. Its global innovation system integrating “independent R&D + investment incubation + ecosystem collaboration” continued to gain momentum, fostering a series of globally competitive innovations.

With a focus on addressing unmet clinical needs, Fosun’s Health segment delivered notable technology innovation achievements. During the Reporting Period, innovative drugs entered a period of intensive approvals and value realization. Fosun Pharma had a total of 20 indications of 7 innovative drugs approved for launch both domestically and overseas. Among them, FUMAINING (luvoxmetinib tablets) was approved for the treatment of paediatric and adolescent patients with relapsed or refractory Langerhans cell histiocytosis (LCH), continuing to fill the gap in the treatment of rare diseases. In terms of neurodegenerative diseases, Fosun Pharma continued to advance its innovation pipeline. Building upon the rights obtained to develop, register, manufacture and exclusively commercialize AR1001 in Chinese mainland, Hong Kong SAR, Macau SAR, and 10 agreed Southeast Asian countries, Fosun Pharma further secured a global exclusive option for AR1001, with the right to exercise the option, thereby expanding the licensed territory to key global markets including the U.S., Europe and Japan, where it would act as the marketing authorization holder in such regions. Meanwhile, post-marketing confirmatory clinical trials for sodium oligomannate capsules in Chinese mainland have progressed steadily, with more than 1,000 patients enrolled as of 31 July 2026. In addition, HT001, an oral brain-penetrant NLRP3 inhibitor for the treatment of Parkinson’s disease in-licensed by Hengtai Bio, an investee and incubated company of Fosun Pharma, commenced its Phase I clinical trial in Australia.

As a core subsidiary in the Health segment, Fosun Pharma achieved operating revenue of RMB20.377 billion. Revenue from innovative drugs recorded a year-on-year increase of 13.84%, with their contribution to pharmaceutical business revenue rising to 33.35%, establishing innovative drugs as a key growth driver.

In terms of biologic innovative drugs, Fosun continued to deliver breakthroughs in the first half of the year. HANSIZHUANG, independently developed by Henlius, received approval from the National Medical Products Administration (NMPA) for its perioperative indication in gastric cancer, making it the world’s first and only anti-PD-1 monoclonal antibody approved for this indication and pioneering a postoperative “chemo-sparing” regimen. HLX43, a core asset in the innovative pipeline, is a potential best-in-class (BIC) broad-spectrum anti-tumor PD-L1 ADC. It has demonstrated preliminary clinical efficacy characterized by high efficacy and low toxicity across multiple solid tumors, including non-small cell lung cancer (NSCLC). To date, more than ten clinical studies of HLX43 as monotherapy or in combination regimens have been initiated, with over 1,500 patients enrolled globally, continuing to evaluate its broad therapeutic potential across multiple solid tumors.

During the Reporting Period, Henlius showcased strong organic growth momentum and sustainable earnings generation, with revenue reaching RMB3.5882 billion, representing a year-on-year increase of 27.3%, and net profit amounting to RMB430.4 million, up 10.3% year-on-year.

Amid the AI wave, Fosun deepened the application of AI across its core businesses and global industrial ecosystem, with a focus on harnessing AI to deliver “practical productivity” and creating tangible industry value.

Fosun Pharma completed the upgrade of its “PharmAID® Pharmaceutical Intelligence Platform V2.0”, establishing four key components to support AI-powered product development across the full lifecycle, from early-stage R&D and clinical validation to post-launch commercialization. As of the end of the Reporting Period, Fosun Pharma had rolled out more than 25 high-value AI projects, with more than 50 use cases simultaneously underway. These initiatives span multiple business functions, including pharmaceutical project evaluation, target prediction and molecule optimization. Two AI‑assisted and structurally generated new molecules have entered the preclinical candidate (PCC) stage. In March 2026, the next-generation recombinant human hyaluronidase (rHuPH20) injection, independently developed by Henlius, was approved to begin clinical trials in China. Leveraging its “AI for Science” platform, Henlius significantly shortened the enzyme-molecule design cycle from 18 months to 5 months.

Beyond pharmaceuticals, Fosun deeply integrated AI into its cultural tourism, insurance, and intelligent manufacturing businesses. Fosun’s Tourism segment accelerated the implementation of “AI G.O” and partnered with a leading technology company to engage in deep collaboration across three key areas: using AI to enhance guest experience, advancing its transition to cloud- and AI-native platforms, and supporting global growth. Leveraging the resource demand brought about by AI technologies, Hainan Mining swiftly expanded its presence in core upstream resources such as fluorite.

Deepening Global Operations to Enhance Quality and Efficiency, Domestic and Overseas Insurance Companies Deliver Broad-Based Improvements

Supported by its business presence and profound operations in more than 40 countries and regions worldwide, Fosun comprehensively advanced its strategy of “Combining Global Resources with China’s Capabilities”, deeply integrating China’s manufacturing capabilities, service capabilities, and innovation dividends with the global market. During the Reporting Period, the Group’s overseas revenue reached RMB49.16 billion, accounting for 56.5% of total revenue.

In the first half of 2026, Fosun’s subsidiaries continued to build on their globalization capabilities, achieving a series of major breakthroughs in international expansion.

In the field of healthcare, Fosun Pharma’s overseas business revenue grew 16.45% year-on-year, accounting for 31.30% of total revenue.This represents an uplift of 3.11 percentage points, and the revenue mix continues to improve. Henlius’ HANSIZHUANG was approved for three new indications in the European Union (EU), while HLX11 (pertuzumab injection) was approved in the EU and two HLX14 (denosumab injection) products were approved and commercially launched in Canada. To date, Henlius has 10 products approved in over 60 countries and regions across Asia, Europe, Latin America, North America, and Oceania, and has benefited over 1.1 million patients worldwide. Fosun Health continued to advance its internationalization strategy, actively expanding into markets such as Indonesia, Bangladesh, Mongolia, Hong Kong SAR, and Macau SAR, while building an open, stable, and professional international medical collaboration network. In addition, the International Medical Center of Foshan Fosun Chancheng Hospital was officially inaugurated, forming a full-process, closed-loop international medical service system.

In terms of the consumer and cultural tourism businesses, Yuyuan generated revenue of RMB532 million in Hong Kong SAR and Macau SAR in the first half of 2026, representing a year-on-year increase of 285.83%, while revenue from the Japanese market reached RMB306 million, representing a year-on-year increase of 6.09%. The jewelry business also made notable progress in overseas expansion. Laomiao opened 5 new stores in Hong Kong SAR, Macau SAR, overseas markets and duty-free channels, bringing the total number of stores across these channels to 15. Club Med continued to expand its global destination network. Club Med Urban Oasis Hangzhou Longwu officially opened in April 2026, while Club Med South Africa Beach & Safari had its soft opening in July 2026.

In the intelligent manufacturing segment, Hainan Mining’s integrated value chain of “Bougouni Lithium Mine in Mali + Hainan Xingzhihai Lithium Salt Processing” operated steadily, serving as a key driver of the company’s earnings growth. It completed the delivery of three shipments totaling 70,000 tons of lithium concentrate from Mali, Africa, to Yangpu Port in Hainan, China in the first half of the year. Wansheng’s phosphate ester flame retardant project at its Thailand facility successfully commenced operations, filling the gap in Wansheng’s overseas manufacturing footprint in this area and further strengthening the resilience of its global supply chain.

With the ongoing advancement of its globalization strategy, Fosun’s domestic and overseas insurance companies delivered broad-based improvements in the first half of 2026. As of the end of the Reporting Period, Fidelidade held a 30.1% overall market share in Portugal, its international business accounted for 26.7% of its consolidated total business, while gross written premiums from overseas markets reached EUR1.035 billion. Despite losses from multiple storms in Portugal during the Reporting Period, Fidelidade recorded net profit attributable to owners of the parent of EUR165 million, up 23.8% year-on-year.

Benefiting from its high-quality client base, disciplined underwriting and global business footprint, Peak Reinsurance maintained solid performance. During the Reporting Period, reinsurance revenue and gross written premiums increased by 25.0% and 11.8% year-on- year, respectively, while net profit after tax reached USD89.70 million. Building on its sound financial strength and growing market position, Moody’s upgraded Peak Re’s rating from Baa1 to A3 in April 2026, with a “stable” outlook.

In Chinese mainland, Pramerica Fosun Life Insurance recorded gross written premiums of RMB8.38 billion in the first half of 2026, up 52.2% year-on-year. Net profit reached RMB780 million, representing a year-on-year increase of 270% and exceeding its net profit for the full year of 2025. Fosun United Health Insurance reported a 36.2% year-on-year increase in revenue and net profit of RMB572 million.

Committed to Business for Good, MSCI ESG Rating Upgraded to AAA

During the Reporting Period, Fosun continued to gain international recognition for its environmental, social and governance (ESG) performance. Its MSCI ESG rating was upgraded to the highest rating of AAA. It was once again included in S&P Global’s Sustainability Yearbook 2026 and ranked among the top 1% in the Sustainability Yearbook (China Edition) 2026. In addition, its FTSE Russell ESG score remained above the global industry and Chinese corporate averages. It was selected as a constituent of the FTSE4Good Index Series for the fifth consecutive year.

Fosun consistently contributed the “China Solution” to malaria control efforts in Africa. As of the end of the Reporting Period, Fosun Pharma had cumulatively supplied more than 460 million vials of its independently developed artesunate for injection worldwide, saving more than 92 million patients with severe malaria. The “Seasonal Malaria Chemoprevention Program”, centered on the SPAQ-CO® series of products, has benefited more than 330 million children in Africa.

The “Rural Doctors Program”, initiated by Fosun Foundation, continued to cover 78 project counties in 16 provinces, cities and autonomous regions, supporting 25,000 rural doctors and benefiting 3 million rural families and 16.34 million rural residents. In the first half of 2026, the program provided a total of more than 12,590 group accidental and critical illness insurance policies for rural doctors in project counties, carried out intelligent upgrading for 59 clinics or hospitals, and supported 263 rural doctors in obtaining the qualification of Assistant General Practitioner. Launched in May, the “AI Rural Doctor Assistant 2.0” achieved a 100% service-success rate and a 92% user-satisfaction rate among rural doctors.

Looking ahead, Guo Guangchang said: “The earnings recovery we delivered in the first half of the year was no coincidence. It was the result of Fosun’s long-term commitment and sustained focus on its core businesses. Going forward, we will continue to advance innovation-driven and global development in industries where we have established competitive advantages. With a clear path ahead, we are confident that we can steadily restore annual profit to the RMB10 billion level.”


Bybit Makes Institutional-Grade Assets Accessible, Expanding RWA Earn With nOPAL, Plume’s BlackOpal Vault

nOPAL unlocks access to a real-world credit yield with BRL exposure hedged and liquidity actively managed

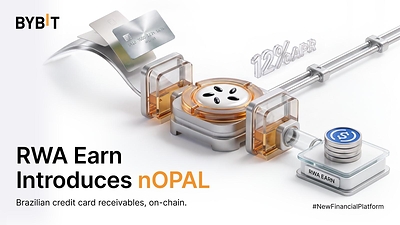
DUBAI, UAE, Aug. 27, 2026 /PRNewswire/ — Bybit, the world’s second-largest cryptocurrency exchange by trading volume, deepens its institutional play with the addition of nOPAL to Bybit RWA Earn. Following a successful launch in June, Bybit RWA Earn has now listed nOPAL, an on-chain credit product built on Brazilian credit card receivables. nOPAL is managed by BlackOpal Finance and structured as a vault on open finance platform, Plume. The access gives Bybit users exposure to a yield source drawn from real commercial activity, structured with currency risk hedged, liquidity actively maintained, and institutional commitments and an investment grade rating behind it.

nOPAL – Capturing Premium Emerging-Market Opportunities

nOPAL’s yield is generated when Brazilian merchants sell their future credit card receivables to BlackOpal at a discount in exchange for upfront cash. When regulated acquirers settle those transactions through the Visa and Mastercard networks, the full amount is paid directly to BlackOpal, and the discount becomes the yield distributed to investors. Brazilian central bank rules require that settlement be paid to the registered holder of the receivable rather than to the merchant, which gives nOPAL a risk profile distinct from traditional unsecured merchant credit.

Local-currency credit markets like Brazil’s credit card receivables market used to be largely inaccessible to crypto-native capital for two structural reasons: FX risk and potential illiquidity from settlement timing. nOPAL on Bybit RWA Earn addresses both barriers:

  • The BRL/USD exposure is hedged through institutional non-deliverable forwards, so returns are denominated and received in USD regardless of currency movements.
  • Liquidity is maintained through a dedicated liquidity allocation, including USCC liquidity as well as nTBILL and cash, to support redemptions independently of the underlying receivables’ settlement cycle.

As of August 2026, nOPAL has recorded a 30-day rolling yield of approximately 12% and holds over $70 million in total value locked. Since November 2025, the strategy behind nOPAL has purchased more than 7,000 receivables with zero defaults and zero credit losses. Subscriptions and redemptions are denominated in USDC, with a minimum investment of 500 USDC and no subscription or redemption fees.

nOPAL is designed to keep credit risk away from investors. Payment comes from regulated acquirers through the card networks, not from the merchant, so the product carries no consumer credit risk. Every receivable is bought outright and held in a bankruptcy-remote structure. Redemptions are accepted daily and settle within one to five business days.

The credit card receivables underlying nOPAL, originated and managed by BlackOpal, carry an investment-grade risk rating from Cicada Partners. The strategy has secured institutional commitments of over $300 million to be deployed over the next 12 months, spanning both Web3-native and traditional asset allocators.

“The organic growth of Bybit RWA Earn attests to strong user demand for real-world opportunities integrated on-chain, signaling a new era in financial product innovation as the Bybit platform increasingly serves as a powerful distribution layer,” said Jerry Li, Head of Financial Products & Wealth Management at Bybit.

“Some of the most compelling sources of yield have historically remained within institutional channels, not because they were inaccessible in principle, but because the infrastructure to distribute them more broadly did not exist. nOPAL on Bybit shows what is possible when that changes. By bringing differentiated institutional credit strategies on-chain through compliant, regulated vault infrastructure, we can open up new sources of yield alongside the vaults already available to the Bybit community,” said Chris Yin, CEO of Plume.

“BlackOpal’s core mission is to bring institutional-grade emerging market asset-backed finance to global capital markets. Brazilian credit card receivables are short-dated and settled through the global card networks, delivered with currency hedging and independent verification built in across the platform. Our track record speaks for itself. Partnering with Plume and Bybit puts this asset class in front of millions of investors for the first time, and we are proud to be delivering on the promise of on-chain open finance,” said Jason Dehni, CEO of BlackOpal.

Bybit Makes Institutional-Grade Assets Accessible, Expanding RWA Earn With nOPAL, Plume's BlackOpal Vault
Bybit Makes Institutional-Grade Assets Accessible, Expanding RWA Earn With nOPAL, Plume’s BlackOpal Vault

Bybit RWA Earn is a platform enabling institutional-grade financial access for eligible Bybit users through tokenized real-world asset (RWA) strategies. Through its diverse product strategy, Bybit RWA Earn brings unique global opportunities to the Bybit community seeking yield in a world of volatility.

nOPAL is now available on Bybit to eligible investors through the RWA Earn product category, alongside two tokenized institutional bond funds, the PIMCO Dynamic Income Opportunities Fund, and the CMB International Investment Grade Bond Fund. To mark the launch, eligible participants will receive an additional promotional APR on top of nOPAL’s underlying yield.

Terms and conditions apply. For restricted regions, eligibility criteria, detailed product information and yield mechanisms, and other requirements, users may visit:  Bybit RWA Earn introduces nOPAL with a limited-time 5% APR launch boost

Disclaimer: RWA Earn is not principal protected and involves risk of loss. APR figures shown are based on historical NAV performance, are not guaranteed, and may change over time. Actual returns may differ materially. Availability varies by jurisdiction and user eligibility.

#Bybit  / #NewFinancialPlatform 

About Bybit

Bybit is The New Financial Platform.

We believe every person should have access to every financial opportunity on earth. That’s why we’re building the first intelligent platform that connects anyone, anywhere to the world’s finance.

Trusted by more than 80 million users worldwide, Bybit brings together investing, trading, payments, and wealth-building in a single secure and intelligent ecosystem. Through the combination of AI-powered technology, deep global liquidity, robust security, and transparent operations, Bybit makes global finance more accessible, efficient, and empowering for everyone.

Built for everyone. Powered by intelligence. Open to the world.

Learn more at Bybit.com
For more details about Bybit, please visit Bybit Press
For media inquiries, please contact: media@bybit.com
For updates, please follow: Bybit’s Communities and Social Media

Facebook | Instagram | LinkedIn | Reddit | Telegram | TikTok | X | Youtube

Anycubic’s 11th Anniversary Celebration Is Coming: 11 Years, 11 Million Ideas

SHENZHEN, China, Aug. 27, 2026 /PRNewswire/ — Anycubic, a global 3D printing brand, is preparing to mark its 11th anniversary with “11 Years, 11 Million Ideas: Make-It-Real with Anycubic.”

Anycubic’s 11th Anniversary Celebration Is Coming: 11 Years, 11 Million Ideas

Starting September 2, the anniversary sale will feature special pricing, the Anniversary Mystery Box, a creator campaign, and additional member benefits for Anycubic users worldwide.

The campaign runs in three stages:

  • Early Access: August 26 – September 1
  • Anniversary Celebration: September 2 – 28
  • Last Call: September 29 – October 8

The Anniversary Prices Are Still a Secret

The anniversary prices haven’t been revealed yet. Customers who subscribe to Anycubic’s Early-Access Alerts will be notified when the prices go live on September 2, covering selected 3D printers, materials, accessories, and more.

The Anniversary Mystery Box

Eligible users can open up to three boxes during the campaign, with one chance available per day.

Prizes include Anycubic 3D printers, order refunds of up to $1,000, 12KG of 3D printing materials, and $5 off printer coupons. Five winners will get to choose between a Photon P1 Max and a Kobra 3 Max V2 Combo, while 11 winners will receive an order refund worth up to $1,000. Another 11 winners will receive 12KG of materials. Full terms are available on the official anniversary campaign page.

Share What You Make

Makers can also take part in Anycubic’s “11 Years, 11 Million Ideas” creator campaign by sharing their 3D printing projects and stories for a chance to earn up to 1,000 Makeronline points.

More Benefits for Anycubic Members

Members will receive additional benefits during the anniversary campaign, including a 30-day return window, 70% off 1KG filament redemptions, and an extra 180 days of warranty coverage.

The Invite & Earn program will also give both the referrer and the new customer a gift card worth 5% of the order value once the order is delivered.

Subscribe to Anycubic’s Early-Access Alerts to receive the anniversary prices and campaign updates when they go live on September 2.

Anniversary Campaign: August 26 – October 8, 2026


Retirement Costs Soar Faster Than Inflation, Monthly Spend Hits HK$15,090: Over 72% of HK Retirees Wish They’d Acted Sooner

  • IFPHK x YF Life: Hong Kong–Macau Retirement Expense Indexrises to 131.6 — Monthly Spending Reaches HK$15,090
  • Retiree Living Costs Have Risen Nearly 3 Times Faster Than General Inflation Since 2020

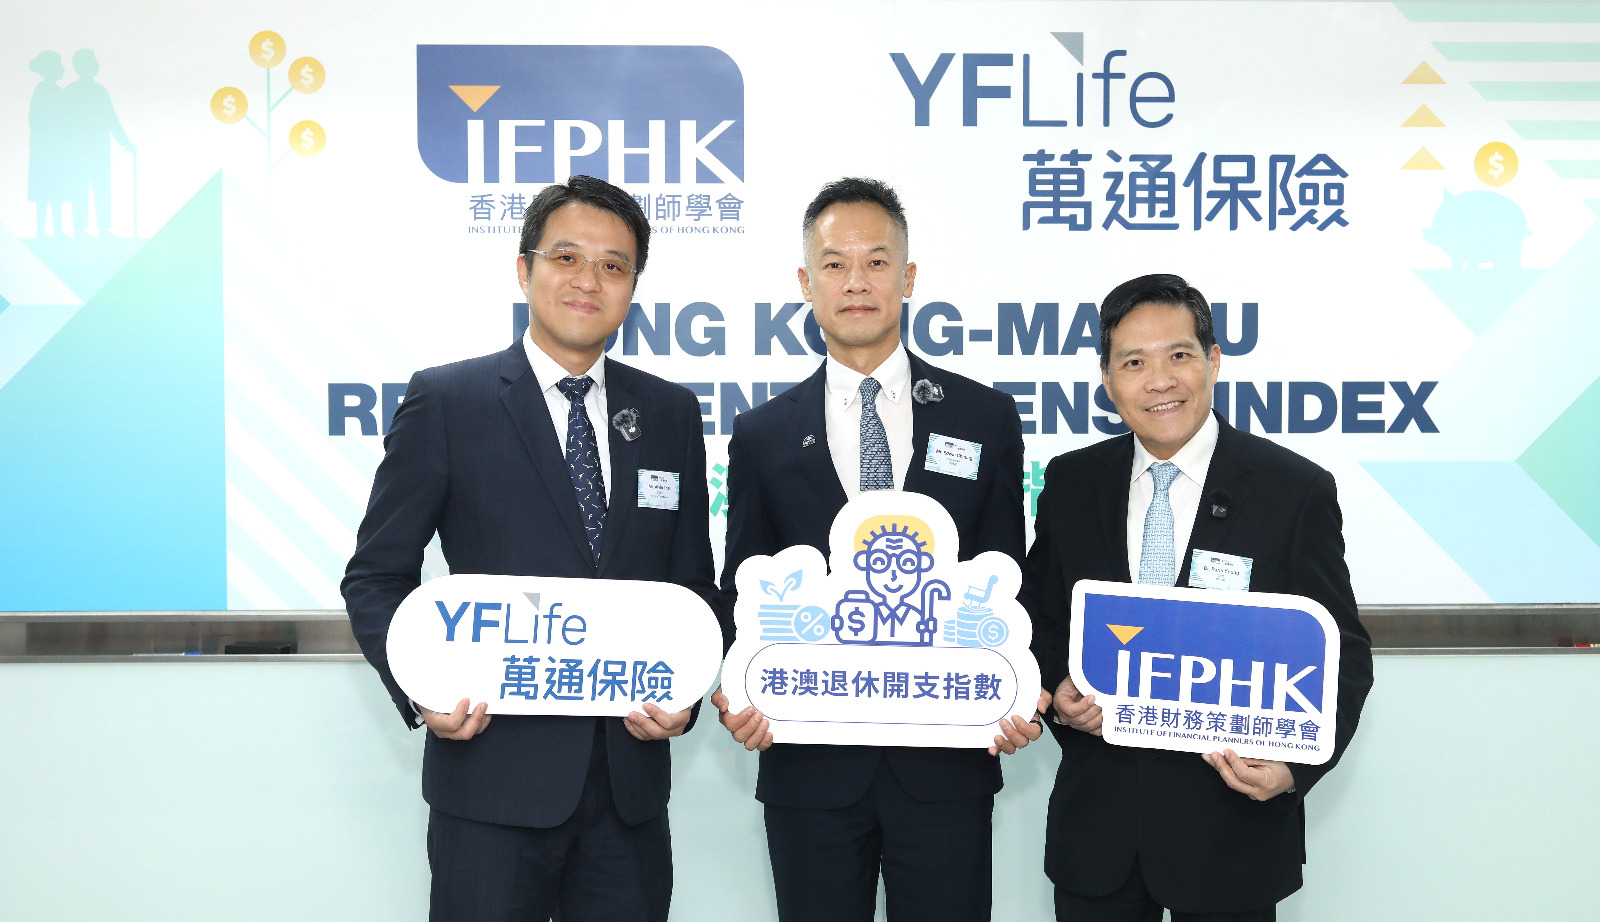
HONG KONG SAR – Media OutReach Newswire – 27 August 2026 – The Institute of Financial Planners of Hong Kong (IFPHK), in collaboration with YF Life Trustees Ltd. (YF Life Trustees), today launched the “IFPHK x YF Life: Hong Kong–Macau Retirement Expense Index” (Index). While the Index has been tracking retiree living expenses since its inception in 2020, this year marks the first time IFPHK and YF Life Trustees have partnered to expand the study to cover both Hong Kong and Macau, providing a broader regional benchmark.

Retirement Costs Soar Faster Than Inflation, Monthly Spend Hits HK$15,090: Over 72% of HK Retirees Wish They'd Acted Sooner

The findings show that retiree inflation in Hong Kong has continued to outpace general inflation. The Index rose to 131.6 in 2026, up from 127.0 in 2023 and 100 in 2020, while average monthly spending increased to about HK$15,090 in 2026. On an annualised basis, the Hong Kong Retirement Expense Index grew by more than 5% per annumfrom November 2020 to May 2026, compared with about 1.8% per annum for Hong Kong’s Composite CPI over the same period, showing that retiree living costs have effectively appreciated close to three times faster than Hong Kong’s general Composite CPI over the same period, underscoring how retirement-specific inflation — driven by travel and dining — is materially outpacing headline price trends.

Furthermore, the study reveals that more than 72% of retirees carry at least one regret regarding their retirement preparation. Most commonly, respondents feel they should have started saving or investing earlier and learned about financial planning sooner, while many continue to express concerns about medical costs, inflation, longevity risk and the risk of outliving their savings.

Dr. Paris Yeung, Chief Executive Officer of IFPHK, stated: “The findings show that satisfaction alone does not mean retirees are fully prepared. More than 72% say they have regrets, and the most common regrets point clearly to the need to start saving, investing and planning earlier. At the same time, retiree inflation has been rising faster than headline inflation, which means future retirees need more robust and flexible plans to protect their purchasing power over time. Through this expanded collaboration with YF Life, we aim to provide deeper regional insights to help future retirees plan with greater confidence.”

He added: “Turning regret into action requires starting earlier, integrating healthcare protection into retirement planning, viewing MPF as a steady retirement paycheck, and engaging qualified financial planners to address estate planning gaps. More importantly, retirement planning should shift from a rigid, set-and-forget approach to a flexible plan that adapts to each retiree’s evolving needs—what we call moving from a ‘fixed plan’ to a ‘flexible, evolving strategy’. Our goal is to help future retirees achieve sustainable and wellplanned golden years.”

Mr. Alvin Tse, Chief Executive Officer of YF Life Trustees, stated: “As the exclusive Project Sponsor of this expanded regional study, YF Life is proud to collaborate with IFPHK on this critical benchmark for Hong Kong and Macau. The 2026 data clearly shows that while retirees desire active lifestyles, they are heavily squeezed by medical inflation and the fear of outliving their wealth. To bridge this gap, retirees must shift away from viewing retirement savings as a static lump sum. By maximizing the flexibility of the MPF through phased withdrawals and mixed-asset strategies, alongside pairing them with lifetime annuity-style income streams and robust medical protection, individuals can effectively convert accumulated assets into a predictable, lifelong paycheck. True financial peace of mind comes from building an integrated fortress that safeguards against both market volatility and longevity risk.”

Key Highlights of the Study:

  • Retiree Inflation Has Outpaced General Inflation: The Index rose from 100 in 2020 to 131.6 in 2026, with average monthly retiree expenses increasing to about HK$15,090 and the Index growing at more than 5% per annum versus about 1.8% for Hong Kong’s Composite CPI for the same period. This escalation is driven partly by travelling and cross‑boundary transport—with roughly four out of five retirees visiting GBA Mainland cities and spending about RMB 1,100 per trip. This suggests that general inflation figures may understate retirees’ actual cash‑flow needs, highlighting the importance of planning for inflation‑protected retirement income and periodically rebasing budgets using a retiree‑specific living expense index rather than general CPI so they can maintain their intended post‑retirement lifestyle.
  • Retirees’ Satisfaction Masks Ongoing Financial Anxiety and Planning Gaps: Although many retirees report being satisfied with their current retirement life, concerns remain widespread, with 51% worrying about unexpected medical expenses, 41% about inflation and 77% still lacking any form of estate or asset planning. This suggests that retirees should turn present satisfaction into future resilience by building healthcare and contingency reserves, setting clear drawdown rules to manage longevity risk, and putting in place basic estate and incapacity documents such as wills, enduring powers of attorney and advance directives well before potential health or family crises arise.
  • Conservative Spending but Widespread Regret—Especially Among Asset‑Rich Retirees
    Actual retirement spending remains conservative, with average retirement expenses in 2026 equal to about 49% of pre‑retirement income. Yet more than 72% of retirees say they would have done something differently in preparing for retirement, most notably saving or investing earlier, learning financial planning earlier and communicating more openly with family about money and care needs. This pattern emphasizes that future retirees should start disciplined saving, investing and family financial discussions much earlier, even when their asset position appears comfortable.
  • MPF Transitioning Toward Income Support: While most eligible retirees still treat MPF as a lump sum, with about 76% having fully withdrawn their benefits in 2026, the scheme is gradually shifting toward an income‑support role, as 22% now use MPF to fund monthly expenses, up from 12% in 2023. Retirees are encouraged to treat MPF as part of a structured retirement income strategy, considering phased withdrawals, annuity‑style income solutions, and planned drawdowns rather than a single cash‑out, converting accumulated MPF assets into a more predictable and sustainable retirement paycheck.

Hashtag: #IFPHK #YFLife #RetirementPlanning

The issuer is solely responsible for the content of this announcement.

About “IFPHK x YF Life: Hong Kong–Macau Retirement Expense Index”

The “IFPHK x YF Life: Hong Kong–Macau Retirement Expense Index” was jointly launched in 2026 by the Institute of Financial Planners of Hong Kong (IFPHK) and YF Life Insurance International Limited. Since 2020, the Index has been the only long-term, retirement-specific benchmark tracking retirees’ actual living expenses. As the first study of its kind by IFPHK, the Index tracks and measures long-term changes in retirees’ actual living expenses with reference to the Composite Consumer Price Index (CPI) and the expenditure weightings published by the Government.

In the Hong Kong survey conducted in June 2026, NielsenIQ (NIQ) interviewed 304 retirees aged 55 to 74 with monthly personal income of at least HK$20,000 before retirement and not receiving means-tested social security or charitable support.

About IFPHK

IFPHK was established in June 2000 as a non-profit organization for the fast–growing financial industry. The Institute is the sole licensing body in Hong Kong authorized by Financial Planning Standards Board Limited to grant the much-coveted and internationally recognized CFP® certification and AFP® certification to qualified financial planning professionals in Hong Kong and Macau. Currently there are more than 236,000 CFP certificants in 29 regions; the majority of these professionals are in the U.S., China, Japan, Canada and Brazil. As at 28 February 2026, Hong Kong had approximately 3,238 CFP certificants.

At present, IFPHK has 5,298 members in Hong Kong including 956 Qualified Retirement Adviser (QRA) holders; and represents financial planning practitioners in diverse professional backgrounds such as banking, insurance, independent financial advisory, stock broking, accounting, and legal services.

About YF Life Trustees Ltd. & YF Life

YF Life Trustees is a member of YF Life Insurance International Limited (YF Life), and was among the first group of institutions approved as a Mandatory Provident Fund (MPF) scheme trustee. The company specializes in providing MPF services and is committed to creating long-term value for its scheme members.

The major indirect shareholders* of YF Life Insurance International Limited (“YF Life”) include Massachusetts Mutual Life Insurance Company (“MassMutual”), which itself has over 170 years of experience and is one of the Five Largest US Life Insurance Companies**, as well as Yunfeng Financial Holdings Limited, among others. YF Life is a long-term strategic partner of Barings. We stay at the forefront of Hong Kong’s insurance industry with our superior global investment capabilities, extensive partnership network, and fintech innovation.

* MassMutual and Yunfeng Financial Holdings Limited have indirect shareholdings in YF Life.
** The “Five Largest US Life Insurance Companies” are ranked according to the results of “Insurance: Life, Health (Mutual)” and “Insurance: Life, Health (Stock)”on total revenues for 2025, and based on the FORTUNE 500 as published on June 3, 2026.

HKT to participate in GenA.I. Sandbox++ to develop AI Agent identity verification


HONG KONG SAR – Media OutReach Newswire – 27 August 2026 – HKT (SEHK: 6823) – HKT Payment Limited[1], HKT’s financial services arm, has been selected by Hong Kong’s financial regulators to participate in the Generative Artificial Intelligence (GenA.I.) Sandbox++ initiative and conduct a pilot trial on registration and verification for AI agent-initiated payment flows, helping to advance responsible innovation in Hong Kong’s financial sector.

As AI agents rapidly gain traction in financial services, they are becoming capable of initiating payments, wallet top-ups, peer-to-peer transfers, and cross-institution transactions on behalf of users. Yet, current Know Your Customer (KYC) and Know Your Business (KYB) frameworks were not designed to address the verification of AI agents or determine who is ultimately responsible for their actions.

In collaboration with Red Date Technology, a provider of decentralised technology and digital infrastructure, HKT will develop an “Agentic ID” framework built on Decentralised Identifiers (DIDs) and Verifiable Credentials (VCs). Under this framework, each AI agent will be bound to a verified individual or enterprise principal, providing a more secured and standardised way to register and verify AI agents acting on behalf of individuals and enterprises.

Designed to strengthen security and governance, the “Agentic ID” framework aims to enhance identity verification, help mitigate the risk of impersonation or unauthorised actions, and establish a clearer audit trail for AI-driven transactions. It also leverages the zero-knowledge proof technology, which enables data to be verified and used without being revealed, giving users full ownership and control over their private information.

Monita Leung, CEO, Digital Ventures, HKT, said, “As the adoption of AI agents in payments and financial services is accelerating, robust safeguards are critical to maintaining trust, security and accountability. Through participating in the GenA.I. Sandbox++ initiative, we are committed to supporting the development of practical solutions for the responsible use of AI in digital finance. We believe this project will contribute to Hong Kong’s vision in establishing a resilient and future-ready fintech hub, as well as advancing the broader ‘AI+’ initiative.”

Launched by the Hong Kong Monetary Authority, the Securities and Futures Commission, the Insurance Authority and the Mandatory Provident Fund Schemes Authority in collaboration with Cyberport, the Gen A.I. Sandbox++ initiative promotes cross-sector collaboration and the responsible adoption of AI across Hong Kong’s financial ecosystem.


[1] HKT Payment Limited (Stored Value Facilities Licence Number: SVF0002)

Hashtag: #HKT

The issuer is solely responsible for the content of this announcement.

About HKT

HKT is a technology, media, and telecommunications leader with more than 150 years of history in Hong Kong. As the city’s true 5G provider, HKT connects businesses and people locally and globally. Our end-to-end enterprise solutions make us a market-leading digital transformation partner of choice for businesses, whereas our comprehensive connectivity and smart living offerings enrich people’s lives and cater for their diverse needs for work, entertainment, education, well-being, and even a sustainable low-carbon lifestyle. Together with our digital ventures which support digital economy development and help connect Hong Kong to the world as an international financial centre, HKT endeavours to contribute to smart city development and help our community tech forward.

For more information, please visit www.hkt.com.
LinkedIn: linkedin.com/company/hkt

Issued by HKT Limited.
HKT Limited is a company incorporated in the Cayman Islands with limited liability.

About Red Date Technology

Red Date Technology is a leading Hong Kong-headquartered technology provider specialising in blockchain infrastructure, decentralised identity solutions, and next-generation financial technology. The company’s Agentic ID framework and Unified Agentic Payment Gateway represent its latest innovation in enabling trustworthy AI agent transactions within regulated financial ecosystems.