The endorsement and international recognition reinforce the growing importance of public-private partnerships in combating organised fraud, recruitment fraud, human trafficking and related financial crimes.
HONG KONG, July 29, 2026 /PRNewswire/ — QNET has formally endorsed the Global Public-Private Partnership Framework Against Fraud, joining a growing coalition of law enforcement agencies, international organisations, financial institutions, technology companies, responsible businesses and civil society organisations committed to strengthening global efforts against transnational fraud.
The endorsement follows QNET’s participation in the inaugural UNODC-INTERPOL Global Fraud Summit in Vienna, where the Framework was officially launched after being introduced by the United Nations Office on Drugs and Crime (UNODC) in March 2026., The Framework provides a practical roadmap for stronger public-private-sector cooperation through intelligence sharing, prevention, investigations, victim support and innovation.
QNET is among the organisations publicly listed by the UNODC as endorsing the Framework, reinforcing its commitment to collaborative efforts that support intelligence sharing, investigations, public awareness and victim support.
The announcement also comes as QNET’s partnership with Ghana’s Economic and Organised Crime Office (EOCO) has gained international recognition as an example of how public-private cooperation can strengthen efforts against organised fraud.
At the Summit, the QNET-EOCO partnership was presented as a practical case study demonstrating how collaboration between law enforcement and responsible businesses can help combat recruitment fraud, human trafficking and the criminal misuse of legitimate brands.
That recognition was further reinforced this month when EOCO, in collaboration with INTERPOL, convened the Regional Case Coordination Workshop on “Model Q“ in Accra. The workshop brought together investigators and prosecutors from across West Africa to strengthen regional coordination against organised criminal networks responsible for recruitment fraud, human trafficking and related financial crimes.
Together, these developments underscore the growing international consensus that organised fraud can only be effectively addressed through sustained collaboration between governments, law enforcement agencies, and responsible private-sector organisations.
“The criminal networks behind today’s fraud schemes do not operate in isolation, and neither can the response,” said Mattias Mildenborn, CEO, QNET. “Our experience working alongside authorities such as Ghana’s EOCO has demonstrated the value of trusted public-private collaboration in disrupting organised criminal networks and protecting vulnerable communities. Endorsing the Framework reflects our commitment to strengthening that cooperation internationally.”
“Our Memorandum of Understanding with QNET demonstrates how collaboration between law enforcement and the private sector can deliver meaningful results in tackling fraud and protecting citizens. Such partnerships are essential in addressing the evolving nature of organised financial crime,” said Raymond Archer, Executive Director, Economic and Organised Crime Office (EOCO)
The partnership between QNET and EOCO was established in 2025 through a Memorandum of Understanding focused on intelligence sharing, investigative cooperation, public awareness and victim support. Since then, both organisations have worked together to combat organised criminal networks that misuse the QNET brand through fraudulent job offers, fake overseas employment schemes and human trafficking.
Beyond Ghana, QNET has expanded its collaboration with law enforcement agencies and regulators across multiple jurisdictions to identify the criminal misuse of its brand, support enforcement action against fraud networks and strengthen consumer protection.
As fraud continues to evolve across borders, QNET believes the principles outlined in the Global Public-Private Partnership Framework Against Fraud provide an important blueprint for strengthening cooperation between governments, law enforcement agencies and responsible private-sector organisations.
“Public-private partnerships are no longer optional in the fight against organised fraud—they are essential,” added Mildenborn. “Our endorsement of the Framework reflects our long-term commitment to sharing practical experience, supporting investigations, protecting consumers and working alongside international partners to ensure legitimate businesses cannot be exploited by organised criminal networks.”
About the Global Public-Private Partnership Framework Against Fraud
The Global Public-Private Partnership Framework Against Fraud was developed through the UNODC-INTERPOL Global Fraud Summit to strengthen international cooperation against fraud. The Framework promotes collaboration between governments, law enforcement agencies, industry and civil society through six guiding principles: shared responsibility, proactive prevention, information sharing, victim support, education and innovation.
About QNET QNET is a wellness and lifestyle-focused direct selling company founded in 1998 and headquartered in Hong Kong. Through its e-commerce platform and independent distributor network, QNET offers health, wellness and lifestyle products in more than 25 countries. The company actively collaborates with governments, regulators and law enforcement agencies to combat recruitment fraud, human trafficking, scams and the criminal misuse of its brand.
CHAM, Switzerland and ALPHARETTA, Ga., July 29, 2026 /PRNewswire/ — Landis+Gyr Group AG (SIX: LAND), a global energy technology leader driving intelligent innovation across the grid, today issued a trading update for its first quarter (April 1 – June 30, 2026) of the financial year 2026 ending March 31, 2027.
In this release, the Group’s financial results are presented for the first time under the new reporting segmentation announced at the 2026 Capital Markets Day, with comparative figures restated accordingly and are unaudited.
Group in USD millions, unless otherwise indicated
Q1 FY 2026
Q1 FY 2025
Change
Order intake
167.0
171.7
(2.7 %)
Net revenue
232.3
249.1
(6.8 %)
Adjusted gross profit margin (in %)
37.4 %
34.6 %
280bps
Adjusted gross profit
87.0
86.2
1.0 %
“In Q1 FY2026, our business performed in line with expectations, and pipeline activity remained very strong. While the anticipated deployment timing affected net revenue, we delivered on significantly improving the profitability of our business and are operating in our new segment structure,” said Peter Mainz, Chief Executive Officer of Landis+Gyr. “Following the successful closing of the EMEA transaction, we intend to accelerate our share buyback through a fixed-price offer to return the proceeds to our shareholders. At the same time, we continue to advance our preparations for a U.S. listing while maintaining our commitment to the Swiss listing and reiterate our FY2026 guidance.”
About Landis+Gyr Landis+Gyr is a global energy technology leader, delivering intelligent solutions that connect devices, data, and decisions across the grid. Trusted by more than 2,000 utilities worldwide, we transform traditional devices into intelligent, networked sensors, giving utilities real-time grid visibility and system control. With these combined insights, electric, gas, and water companies can anticipate demand, optimize operations, and deliver energy that’s more reliable, resilient, accessible, safe, and sustainable for everyone. For more information, please visit our website www.landisgyr.com.
The launch debuts with a Seedance 2.5 Launch Reward that returns 100% of credits spent on Seedance 2.0 to users’ accounts once Seedance 2.5 arrives on SeeAPI, alongside a unified, multi-model API for developers.
SINGAPORE, July 29, 2026 /PRNewswire/ — SeeAPI today announced the launch of its unified AI generation platform, giving creators, marketers, and developers access to leading models from Google, OpenAI, ByteDance, Alibaba, xAI, and more through one account, one shared credit balance, and one unified API.
The launch is anchored by the Seedance 2.5 Launch Reward: from now until ByteDance’s Seedance 2.5 becomes available on SeeAPI, any credits a signed-in user spends generating with Seedance 2.0 on SeeAPI will be returned to their account 1:1 the moment Seedance 2.5 goes live on the platform — in effect, free access to one of the industry’s leading video models for as long as the promotion runs.
One Account, Every Leading Model, No Setup Required
SeeAPI is designed to reduce the complexity of working with a rapidly expanding range of AI generation models.
From launch, users can create directly in the browser with one account and one credit balance across models including Seedance 2.0 (ByteDance), Veo 3.1 (Google), Kling, Wan (Alibaba), GPT Image 2 (OpenAI), Nano Banana Pro (Google), Flux Kontext Max (Black Forest Labs), Seedream 5.0 (ByteDance), and Grok Imagine (xAI), with new models added on an ongoing basis.
“Creators and developers should not have to manage five different platforms and five different integrations just to select the right model for a project,” said Wendy Wen, SeeAPI‘s Marketing Manager. “SeeAPI brings these models into one environment, making it easier to generate, compare, switch, and integrate as the AI ecosystem continues to evolve.”
Seedance 2.5 Launch Reward: Use Seedance 2.0 at No Net Cost
The centerpiece of SeeAPI’s launch is the Seedance 2.5 Launch Reward.
Seedance 2.0 supports multimodal reference-driven video generation, allowing users to combine image, video, and audio inputs to guide motion, lip-sync, visual composition, and character consistency.
SeeAPI is already offering Seedance 2.0 at launch pricing of up to 33% below the model’s official list price.
Under the Seedance 2.5 Launch Reward, credits spent by signed-in users on eligible Seedance 2.0 generations are tracked automatically. Once Seedance 2.5 becomes available on SeeAPI, the full amount of eligible credits will be returned to each user’s account as permanent credits.
For example, a user who spends 100 credits generating with Seedance 2.0 during the promotion will have all 100 credits returned to their account once Seedance 2.5 becomes available on SeeAPI. Those returned credits can then be used to try Seedance 2.5 or generate content with any other supported model on the platform.
The only requirement is being signed in at the time credits are spent — there is no separate application process and no receipts to keep. Because every eligible credit comes back, using Seedance 2.0 during this window carries no net cost: users can treat it as free access to one of the industry’s leading video models until Seedance 2.5 arrives.
Users can start generating with Seedance 2.0, compare it side by side with other video models, and learn more about the Seedance 2.5 Launch Reward at SeeAPI’s dedicated Seedance AI Video Generator, where full terms of the promotion are also posted.
SeeAPI at a Glance
SeeAPI’s launch brings together:
One account and one balance across leading image and video models, including Seedance, Veo, Kling, Wan, GPT Image, Nano Banana, Flux, Seedream, Runway, and Grok Imagine, with no separate sign-ups or per-provider billing
No-setup, browser-based generation, so users can test prompts, upload references, and compare outputs across models before choosing one
The Seedance 2.5 Launch Reward, returning 100% of credits spent on Seedance 2.0 once Seedance 2.5 becomes available on SeeAPI
Launch pricing on selected models, with Seedance 2.0 priced up to 33% below official pricing
The unified API allows developers to:
Integrate multiple image and video models through one API
Use configurable provider routing
Add automatic failover between supported providers
Manage usage and billing through a centralized account
About SeeAPI
SeeAPI is an AI platform that brings leading image and video generation models together under one account and one credit balance, letting creators, marketers, and developers generate and compare outputs from models including Seedance, Veo, Kling, Grok, Nano Banana, GPT Image, Flux, Seedream, Qwen, and Runway directly in the browser.
SeeAPI is operated by GROWCRAFT PTE. LTD., headquartered in Singapore. Learn more atSeeAPI.
DUBAI, UAE, July 28, 2026 /PRNewswire/ — Bybit, the world’s second-largest cryptocurrency exchange by trading volume, announced the launch of Bybit Galaxy, rewarding users for a wide array of engagements on Bybit across trading, wealth building, fiat, payments, interactive tasks, and beyond. For the first time, rewards for CEX activities are unified under one universe. The program is a step up from traditional reward models which offers simple trading incentives, enabling Bybit users to make the most out of sustained and cross-product participation.
Bybit Galaxy invites users to explore the entire Bybit ecosystem on a quest for points. Users can accumulate Galaxy Points through an expansive range of activities to unlock exclusive Rewards Pools.
Turning Every Action into Rewards
Bybit users can earn Galaxy points in two ways:
Trading designated Galaxy trading pairs during specific periods to accumulate points based on qualified trading volume, starting from $2.
Completing daily tasks featuring some of the most popular products on Bybit products, covering Spot, Futures, Earn, Fiat, Loan, TradFi, Alpha, and Bybit Card and Bybit Pay.
No registration is required to participate. Users begin earning points upon their first visit to the Bybit Galaxy landing page, and continue to climb the leaderboard through trading, borrowing, deposits, spending and staking.
Points can be redeemed exclusively through Reward Pools. When a Reward Pool is announced, users are shown the value of the reward in advance. Eligible point thresholds are generated dynamically based on the value of each individual reward pool.
Welcome to Bybit Galaxy, the First Unified Reward Universe Across Financial Products
Bybit Galaxy recognizes users who engage with the full range of what Bybit has to offer, not just those who trade the most. Whether a Bybit user is focusing on yield through Earn, moving funds through Fiat, or exploring TradFi-themed assets, every activity counts. Galaxy is Bybit’s way of rewarding the full relationship users have with the platform beyond transactions.
Bybit Galaxy is part of Bybit’s broader vision to build lasting relationships with its community across its trading, wealth management, and payment product suites. With a growing ecosystem, Bybit is committed to delivering the best New Financial Platform fit for the future of finance and wealth building.
We believe every person should have access to every financial opportunity on earth. That’s why we’re building the first intelligent platform that connects anyone, anywhere to the world’s finance.
Trusted by more than 80 million users worldwide, Bybit brings together investing, trading, payments, and wealth-building in a single secure and intelligent ecosystem. Through the combination of AI-powered technology, deep global liquidity, robust security, and transparent operations, Bybit makes global finance more accessible, efficient, and empowering for everyone.
Built for everyone. Powered by intelligence. Open to the world.
The following announcement was issued today to a Regulatory Information Service approved by the Financial Conduct Authority in the United Kingdom.
DFI RETAIL GROUP HOLDINGS LIMITED
HALF-YEAR RESULTS FOR THE SIX MONTHS ENDED 30 JUNE 2026
Highlights
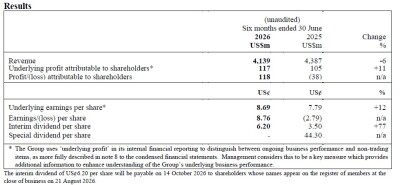
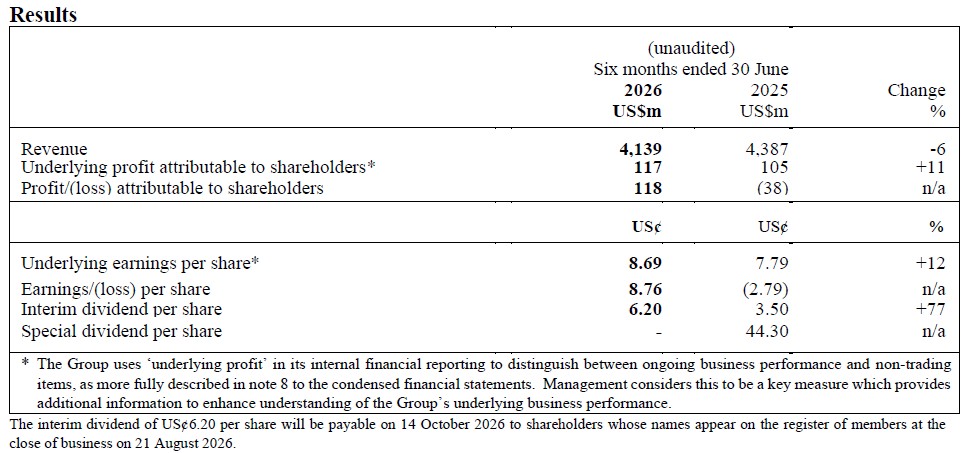
Underlying profit from continuing businesses1 grew 44% to US$117 million
Reported profit was US$118 million, compared to a US$38 million loss in the prior year period
Like-for-like (LFL) subsidiary sales growth from continuing businesses2 improved to 3%
Health & Beauty sustained strong LFL sales; Convenience and Home Furnishings returned to growth
E-commerce and DFIQ Media contributed to approximately 35% of sales growth
Return on capital employed improved to 12%, up from 9% as of December 2025
Interim dividend of US¢6.20 per share, up 77% year-on-year. Maintain full-year dividend payout of 70%
Raised full-year organic revenue3 growth guidance to be between 3.0% and 4.0%, and underlying profit to be between US$285 million and US$305 million
Announced 100% interest acquisition of Cody Hong Kong (Cody HK), one of the leading outdoor advertising solution providers in Hong Kong
HONG KONG SAR – Media OutReach Newswire – 28 July 2026 – “Our first-half performance, with underlying profit1 growth of 44% and a consistently improving LFL subsidiary sales trend, reflects the strength of our strategy in action – a sharper value for customers, a strong focus on returns and execution with discipline. This was supported by sustained momentum in Health & Beauty, as well as strong recovery in Convenience and Home Furnishings segments. Our acquisition of Cody HK’s extensive outdoor media portfolio, together with its experienced leadership team, strengthens our capability to deliver full-funnel, omnichannel advertising solutions while accelerating the growth of DFIQ Media. As we continue to deepen customer engagement and build new profit pools through the DFI Omni Platform, we are well-positioned to deliver sustainable long-term value with greater earnings resilience.”
Scott Price
Group Chief Executive
DFI RETAIL GROUP HOLDINGS LIMITED
HALF-YEAR RESULTS FOR THE SIX MONTHS ENDED 30 JUNE 2026
OVERVIEW
The Group delivered strong performance in an evolving macroeconomic climate, underpinned by disciplined execution and a focus on driving higher returns. A portfolio built on everyday essentials, combined with a strong value proposition with convenience, continues to resonate with customers against the backdrop of oil price volatility. For the first half of 2026, subsidiary LFL sales growth from continuing businesses4 further improved to 3%. This was driven by sustained strong momentum in the Health & Beauty segment, as well as a return to growth in both the Convenience and Home Furnishings businesses. Price reinvestment, supported by a reset in sourcing strategy, drove Food volume growth with Wellcome’s basket price now trading at a discount relative to the Greater Bay Area5, compared to a premium in the prior year.
The Group’s commitment to retail excellence, a lean overhead structure and expanded omnichannel touchpoints enables us to serve our customers with better pricing and better experience. The DFI Omni Platform further strengthens this by seamlessly integrating our extensive store network with digital capabilities, delivering greater convenience and personalisation while unlocking new value pools through rich, cross-format data insights. Developing and scaling high-margin revenue streams, including retail media (DFIQ Media) and insights monetisation (DFIQ Insights), will diversify our profit base and support long-term value creation.
To enhance operational efficiency and improve productivity of team members, the Group introduced GenAI-powered tools in the first half of 2026, with plans to scale deployment across operating markets in the coming months. In parallel, AI capabilities are increasingly embedded across core retail functions, including assortment optimisation, promotion planning and demand forecasting, to drive better, more data-driven decisions.
The Group undertook a thorough review of the cost structure with the aim of driving sustainable savings and improving long-term cost efficiency. This has led to a reallocation of resources and costs toward format-level operations, driving greater agility and responsiveness to evolving market conditions, while continuing to reduce central selling, general and administrative (SG&A) costs through overhead optimisation. Combined with improving digital economics, underlying operating profit from continuing businesses6 grew 14% year-on-year in the first half of 2026. Improved operating performance and lower financing costs contributed to an 11% increase in underlying profit attributable to shareholders, or 44% from continuing businesses7 only.
The Group maintained a healthy balance sheet with a net debt position of US$22 million as of 30 June 2026. Return on capital employed further improved to 12%, up from 9% as of December 2025.
The Group declared an interim dividend of US¢6.20 per share, representing a significant increase of 77% compared to the same period last year. This enhanced interim dividend distribution underscored the Board’s confidence in the Group’s underlying business momentum and strong cash flow generation, while ensuring sufficient capital for future growth in line with our 70% payout policy.
OPERATING PERFORMANCE
Overall For the first half of 2026, underlying subsidiary revenue from continuing businesses6 was US$4.1 billion, up 4% year-on-year and 3% on a LFL basis. The growth was driven by strong performance in the Health & Beauty division, as well as a return to growth in the Convenience and Home Furnishings segments. Total revenue, including Maxim’s, was US$5.6 billion. Excluding divestments7, total revenue increased by approximately 4%.
Overall underlying profit attributable to shareholders from continuing businesses7 grew 44% year-on-year to US$117 million, primarily driven by improved operating profit and lower financing costs.
Underlying subsidiary profit from continuing businesses6 was US$101 million, reflecting a 49% year-on-year increase, primarily driven by earnings recovery in the Home Furnishings and Food segment with lower SG&A expenses as a result of overhead reduction.
Underlying profit from associates was US$16 million, down from US$30 million in the prior comparable period, which included share of profits from Robinsons Retail ahead of its disposal. Excluding this, profit contribution from associates was up 22% year-on-year due to robust sales growth and effective cost optimisation at Maxim’s.
The Group reported operating cash flow after lease payments of US$178 million, 16% higher than the prior year period, driven by underlying operating profit growth. Free cash flow for the period was a net inflow of US$85 million, down 5% year-on-year, due to increased capex investment in priorities that will further strengthen the Group’s competitive position while driving long-term value for shareholders.
Digital Capturing a significant share of daily essential customer missions in Hong Kong, the DFI Omni Platform – powered by yuu – enables deeper customer engagement across offline and online touchpoints, maximises data capture and unlocks incremental margin opportunities beyond core retail through DFIQ Media and DFIQ Insights. Overall digital turned profitable, with e-commerce and DFIQ Media contributing to approximately 35% of total revenue growth in the first half of 2026. This was supported by improved underlying e-commerce economics, a rising online sales penetration8 to 6.9% and 3 times in DFIQ Media revenue compared to first half of 2025. As of June 2026, more than 10,000 digital media-ready screens were available across DFI outlets.
Subsidiaries Sales for the Health & Beauty division were US$1.4 billion, up 8% year-on-year from continuing businesses9, 7% in constant currency, or 6% on a LFL basis, with continued market share gains across key operating markets. Mannings and Guardian deepened their leadership as the trusted advisors for wellness through an enhanced, wellness-focused assortment and continued roll-out of skin and scalp assessment services across a wider store network. The recently announced exclusive distribution partnership with Holland & Barrett, a leading UK health and wellness retailer, will further expand customer access to trusted wellness solutions in Hong Kong and Singapore, followed by a broader rollout across selected Asia markets in the coming years. In Hong Kong and Macau, Mannings delivered 5% LFL sales growth, driven by increased basket size and robust tourist store sales amid higher visitor arrivals. In Southeast Asia, Guardian achieved strong LFL sales growth of 9%, supported by higher basket sizes and improved promotional efficiency, with Indonesia and Vietnam delivering close to 20% LFL growth. Excluding the impact of cost reallocation and closure of Mannings China offline stores, divisional profit increased moderately by 2% to US$109 million. Margin declined primarily due to increased strategic promotions to drive stronger sales and market share in Southeast Asia, particularly in Malaysia where health & beauty retailers did not benefit from the SARA Cash Aid Programme.
Total Convenience sales were US$1.2 billion, up 4% year-on-year or 2% on a LFL basis, as continued growth in higher-margin categories, including ready-to-eat (RTE) and exclusive collectibles, more than offset the decline in lower-margin cigarette volumes. Hong Kong LFL sales returned to growth in the second quarter following ten consecutive quarters of decline, supported by RTE and an expanded non-food assortment, including limited-edition collectibles and K-pop merchandise. Excluding cigarettes, LFL sales were up 3% for the period. In Singapore, effective promotional campaigns and collectible product launches drove strong LFL sales growth of 8%. In South China, continued store network expansion through a capex-light franchise model – including a net addition of 112 stores since June 2025 to nearly 1,980 locations – contributed to 12% sales growth year-on-year or 6% on constant currency basis. LFL sales were 1% higher compared to the prior year period, driven by the successful launch of Own Brand in key categories of frozen products and packaged drinks. The team remains focused on driving footfall and sales through further expansion of the RTE offering across both offline and online channels. This includes a broader rollout of the Food Bar to 453 stores as of June 2026, up from 325 at year-end 2025, and strong overall online sales growth of more than 35%. Excluding cost reallocation impact, profit for the division increased by 2% to reach US$37 million.
Reported sales for the Food division from continuing businesses10 were US$1.1 billion, up 1% year-on-year. LFL sales returned to positive growth of 0.5% in the second quarter of 2026. In Hong Kong, investment in reduced pricing on core basket items, a stronger fresh proposition, and Own Brand offering drove 2% increase in total volume and 0.5% LFL sales growth in the first half of 2026. As of June 2026, Wellcome’s “Everyday Value” range has expanded to nearly 500 items, offering savings of up to 40%, bringing its basket price down from a premium to a discount relative to the Greater Bay Area. The team also accelerated omnichannel growth with more than 35% growth in online order volume. In Cambodia, Lucky reported strong double-digit sales growth, with profit more than doubling year-on-year. The plan to open 50 new stores over the next few years remains on track. Macau Food sales remained challenging as a result of cross-border grocery shopping. Excluding the impact of cost reallocation and the divestment of Singapore Food, overall divisional profit increased by 27% year-on-year to US$17 million.
The Home Furnishings division delivered strong recovery in performance during the first half of 2026, with LFL sales growth of 4%, compared to a decline of 6% in the prior year period. Price reinvestment in core value SKUs, a stronger focus on locally relevant ranges and IKEA Food innovation drove increased footfall and items per baskets, resulting in a 3% LFL sales growth in Hong Kong and 5% in Taiwan. IKEA Food remains a critical traffic and revenue driver, accounting for 15% of total sales. In Indonesia, while offline sales momentum remained soft, LFL sales trend improved on a strengthening IKEA’s omnichannel proposition with online sales penetration reaching 24%. Sales recovery and effective cost optimisation measures contributed to 85% growth in overall divisional profit, excluding cost reallocation impact.
Associates The Group’s share of Maxim’s underlying profits was US$16 million for the first half of 2026, up 15% year-on-year, underpinned by continued cost optimisation and operational efficiency measures. Sales for the period increased by 4%, driven by strong restaurant performance in Southeast Asia and a return to growth in the Chinese mainland, partially offset by weaker sales in Hong Kong.
RECENT BUSINESS DEVELOPMENTS
On 30 June 2026, the Group announced the acquisition of 100% interest in Cody Hong Kong (Cody HK), one of the leading outdoor advertising solution providers in Hong Kong, for a cash consideration of HK$30.2 million (approximately US$3.8 million) from ARN Media Network Limited (ASX: A1N), subject to customary adjustments.
The acquisition advances DFI’s strategy to build a full-funnel advertising solution in Hong Kong through DFIQ Media. By integrating Cody HK’s strategic assets – including multi-year exclusive advertising rights with Kowloon Motor Bus (KMB) and Hong Kong Tramways (HKT) – with DFI’s extensive store network, growing online user base, and closed-loop measurement capabilities, DFIQ Media strengthens its ability to deliver high-impact advertising solutions to a broader advertiser base across online, in-store, and outdoor channels.
Subject to satisfaction of third-party consents, the transaction is expected to complete in the second half of 2026.
PEOPLE
On 6 July 2026, the Group announced four senior leadership appointments effective from 1 August 2026. These moves reflect the Group’s continued focus on strengthening its leadership pipeline and driving the next phase of growth with experienced, proven leaders.
Andrew Wong will be appointed Chief Executive Officer, DFI IKEA. Formerly CEO of Health & Beauty, Andrew brings extensive experience in driving customer-led growth, operational discipline and in-store digitalisation across multiple markets. His earlier leadership of franchise operations at Jardine Restaurant Group positions him well to lead the IKEA business into its next phase of development.
Curtis Liu, having most recently served as Chief Executive Officer of Food, will be appointed Chief Executive Officer, Health & Beauty. His proven leadership in driving customer value repositioning in Hong Kong, combined with deep operational retail knowledge and digital experience at JD.com, positions him well to drive continued momentum and omnichannel growth in Health & Beauty.
Tom van der Lee will be appointed Chief Executive Officer, Food. Tom has played an instrumental role as Group Chief Financial Officer, driving financial discipline and supporting key strategic decisions across the Group. His prior experience at FrieslandCampina, a global food company, and his broad financial leadership across DFI banners in Southeast Asia supported his strong commercial grounding to lead the Food business.
Kaizhi Wu will succeed Tom as Group Chief Financial Officer. Kaizhi currently serves as Group Finance Director, Planning & Reporting, based in Hong Kong. Prior to joining DFI, he served as Executive Vice President and Chief Financial Officer of Yonghui Superstores Co., and earlier held senior roles at Jardine Matheson, Fosun Group and PwC in London. Kaizhi will join the Group’s Management Committee upon assuming his new role.
OUTLOOK
The Group remains confident in our ability to navigate the evolving trading environment, supported by sharpened business priorities, a strong balance sheet and low-cost operating model. Financial outlook outlined at the Investor Day in December 2025 remains intact as DFI continues to execute our multi-year strategic initiatives that are critical to driving sustainable revenue and earnings growth. These initiatives include strengthening our value proposition, strategically expanding store network, enhancing omnichannel capabilities and accelerating digital asset monetisation through data-driven insights. In particular, the growing DFI Omni Platform will deepen our customer engagement, further reinforce our core retail strength and enhance overall earnings resilience in the long term.
Despite an elevated oil price outlook for the remainder of the year, the Group expects to deliver stronger profitability supported by enhanced operational efficiency. As a result, the Group revises up its full-year organic revenue growth11 outlook to be between 3.0% and 4.0% (up from previously 2.0% to 3.0%), and underlying profit attributable to shareholders to be between US$285 million and US$305 million (up from previously US$270 million and US$300 million).
Scott Price Group Chief Executive
—————– 1 Excluding impacts of divestment of Singapore Food business, closure of Mannings China and disposal of minority stake of Robinsons Retail 2 Excluding impacts of divestment of Singapore Food business and closure of Mannings China 3 Excluding Singapore Food and Mannings China 4 Excluding impacts of divestment of Singapore Food business and closure of Mannings China 5 Based on a third-party assured price comparison of a 200-item comparable basket between DFI and Shenzhen 6 Excluding impacts of divestment of Singapore Food business and closure of Mannings China 7 Excluding impacts of divestment of Singapore Food business, closure of Mannings China and disposal of minority stake of Robinsons Retail 8 Excluding cigarettes under Convenience and IKEA Food 9 Excluding Mannings China 10 Excluding Singapore Food business 11 Excluding Singapore Food and Mannings China Hashtag: #DFIRetailGroup #Mannings #Guardian #7-Eleven #Wellcome #MarketPlace #IKEA #yuu #Maxim’s
The issuer is solely responsible for the content of this announcement.
DFI Retail Group
DFI Retail Group (the Group) is a leading Asian retailer, driven by its purpose to ‘Sustainably Serve Asia for Generations with Everyday Moments’.
At 30 June 2026, the Group and its associates operated 7,659 outlets across 12 markets, of which 5,593 stores were operated by subsidiaries. The Group, together with its associates, employed over 81,000 people, with more than 43,000 people employed by subsidiaries. The Group had reported revenue of US$8.9 billion in 2025.
The Group is committed to delivering quality, value and service to consumers across the region through trusted brands, strong local market positions, and a broad retail ecosystem supported by extensive store networks, digital capabilities and efficient supply chains.
The Group and its associates operate a portfolio of well-known brands across five key divisions. The principal brands are:
Health and Beauty
Mannings in Hong Kong and Macau S.A.R.; Guardian in Brunei, Indonesia, Malaysia, Singapore and Vietnam.
Convenience
7-Eleven in Hong Kong and Macau S.A.R., Singapore and Southern China.
Food
Wellcome and Market Place in Hong Kong S.A.R.; San Miu in Macau S.A.R.; Lucky in Cambodia.
Home Furnishings
IKEA in Hong Kong and Macau S.A.R., Indonesia and Taiwan.
Restaurants
Hong Kong Maxim’s group on the Chinese mainland, Hong Kong and Macau S.A.R., Cambodia, Laos, Malaysia, Singapore, Thailand and Vietnam.
The Group’s parent company, DFI Retail Group Holdings Limited, is incorporated in Bermuda and has a primary listing in the equity shares (transition) category of the London Stock Exchange, with secondary listings in Bermuda and Singapore. The Group’s businesses are managed from Hong Kong. DFI Retail Group is a member of the Jardine Matheson group.
The Expansion Unlocks a Compliant Engine for Businesses and Fintechs to Move Value Across Africa and Beyond
LAGOS, Nigeria, July 28, 2026 /PRNewswire/ — Quidax, the first digital assets exchange to receive a provisional licence from Nigeria’s Securities and Exchange Commission (SEC), today announced the expansion of its stablecoin infrastructure to more than 21 countries and 14 currencies, enabling startups, fintechs, and global enterprises to move value seamlessly across Africa and key international markets.
Africa loses an estimated $5 billion annually to cross-border payment fees and inefficiencies. When a business in Accra, Ghana pays a partner in Durban, South Africa through traditional channels, that payment is routed through a correspondent bank in Europe, a journey that can take up to 7 days and costs up to 13% of the transaction value, more than twice the global average of 6%.
Quidax addresses this directly. Its compliant infrastructure settles cross-border payments in under 48 hours with no correspondent bank involved, at a cost below the global average and in line with the G20 and UN Sustainable Development Goal target of 5%.
“Africa is home to the world’s fastest-growing economies, yet individuals and businesses pay an ‘African border levy’ every time they move money across the continent,” said Buchi Okoro, CEO and Co-Founder of Quidax. “Our compliance-first stablecoin infrastructure was created to remove that levy and bring us closer to a world with zero financial borders.”
Nigeria’s first SEC-licensed digital assets exchange, Quidax is one of a select few exchanges operating under direct securities regulation in Africa and is actively expanding its licensing footprint across strategic markets.
The infrastructure supports key African markets including Nigeria, Ghana, Kenya, Tanzania, Rwanda, South Africa, Ethiopia, Cameroon, and Côte d’Ivoire, and extends beyond the continent to Canada, China, the United Arab Emirates, the United Kingdom, the USA, and several European countries. The rails support USDT, XAUT, USAT, and other leading stablecoins, as well as 14 local and international currencies including Naira, Cedi, Central African and West African CFA francs and US Dollar.
Powering more than 5,000 startups and enterprises across payments, remittance, gaming, banking, and more, Quidax counts Tether, the world’s largest stablecoin issuer, and Chainalysis, the global standard in blockchain compliance, among its partners.
About Quidax
Quidax is an African-founded digital assets exchange serving individuals, startups, fintechs, and enterprises. Its unified engine makes sending value within Africa and beyond as easy as sending a text message, powered by an orderbook exchange, an OTC desk, and white-label stablecoin and digital asset APIs, supporting 14+ currencies across 21+ countries. Visit www.quidax.io.
– Earnings Conference Call to be Held on Tuesday, August 11, 2026 at 8:00 pm (Hong Kong Time) / 8:00 am (U.S. Eastern Time)
HONG KONG, July 28, 2026 /PRNewswire/ — China Literature Limited (“China Literature” or “the Company”, 0772.HK), a leading online literature and intellectual property (“IP”) incubation platform in China, will announce its financial results for the first half of 2026 on Tuesday, August 11, 2026.
China Literature’s management team will host a conference call to present an overview of the Company’s financial performance and business operations. A live webcast of the call can be accessed on the Company’s investor relations website at http://ir.yuewen.com.
Details of the conference call and webcast are as follows:
Time:
8:00 pm (Hong Kong Time) / 8:00 am (U.S. Eastern Time)
For participants who wish to join the conference using dial-in numbers, please register in advance using the link provided below and dial in 10 minutes prior to the call. Your dial-in numbers, passcode and unique access PIN would be provided upon registering.
Following its developer launch in November 2025, Aqua now offers a risk-controlled alternative to DeFi’s pool-based model.
1inch unveils a Merkl-powered liquidity incentive program for Aqua, funded with 10 million 1INCH by the 1inch Foundation and 500k USDC from 1inch DAO.
Aqua goes live across 13 EVM chains from day one.
ROAD TOWN, British Virgin Islands, July 28, 2026 /PRNewswire/ — 1inch, the leading DeFi ecosystem, announces the full public launch of Aqua, a self-custodial shared liquidity layer that enables liquidity providers to use the same wallet balance across multiple positions without locking assets in liquidity pools.
Following its developer launch in November 2025, Aqua today offers one of the first risk-controlled alternatives to DeFi’s traditional pool-based model, enabling more capital-efficient liquidity provisioning.
1inch Aqua works as a registry: a user connects their wallet to approve a token balance and create liquidity positions that can access that balance. The Aqua protocol tracks that balance, and when it receives a swap order that meets the criteria of the position, it pulls the requested tokens from the wallet and pushes back received tokens and fees in a single atomic transaction. Otherwise, the user’s tokens remain in their wallet and completely under their control.
“The liquidity provisioning space is broken, but you only see how broken once there’s an alternative. Today, that alternative has arrived. With Aqua, liquidity providers no longer have to accept the inefficient pool structure they’ve put up with for years,”said Sergej Kunz, 1inch co-founder. “DeFi doesn’t just need more liquidity. It needs more useful liquidity, active wherever demand appears. We built Aqua so providers get that reach without giving up custody: your tokens stay in your wallet until the moment a swap fills.”
Alongside the product launch, 1inch Network Incentives goes live — a liquidity reward program for Aqua, led by Degensoft Ltd (BVI) and delivered through Merkl. The 1inch Foundation has committed 10 million 1INCH in provider rewards, and a further 500,000 USDC boost from the 1inch DAO. The initiative is designed to accelerate liquidity growth and swap activity across supported pairs. As a result, liquidity providers not only benefit from Aqua’s improved experience but also have the opportunity to earn additional rewards. Program terms, markets and safeguards are set out in the published campaign configuration.
According to 1inch, the current pool based system is a major limiting factor on DeFi’s ability to scale and bring TradFi capital on chain. For liquidity providers, the current model of depositing into pools means handing over custody, while active capital gets spread thin across protocols, pairs and price ranges. The scale of the problem is stark: per on-chain research by Dune commissioned by 1inch, 85% of concentrated liquidity across major DEXs was underutilized in H1 2026, roughly $1.6 billion of the $1.84 billion tracked. That includes about $542 million sitting fully out of range in an average week, resulting in an estimated $150 million in fees foregone per year.
Through Aqua, 1inch is showcasing a more efficient model for shared liquidity, allowing the same wallet balance to back multiple positions simultaneously. Unlike the traditional model, where liquidity must be split across multiple pools and positions, Aqua enables a single balance to support multiple quotes at once. For example, a $100,000 balance can support three positions collectively quoting $300,000 of liquidity, with the potential to quote more. The underlying tokens remain available to every position at all times; nothing is borrowed, and any swap can only execute against the assets actually held in the wallet.
A position on Aqua can be full range, concentrated or pegged, depending on the selected pair and position type. A user can open and close positions themselves, with no lock-up. Their exposure is capped by the tokens they actually hold, not by the theoretical combined size of every position they create. If their wallet cannot cover a swap, Aqua simply does not call on their tokens.
From today, users can create positions across 13 EVM chains, including Ethereum, Arbitrum, Base, Robinhood Chain and BNB Chain. Aqua also launches with a number of additional functionalities, including a liquidity leaderboard, an incentives screen, liquidity map visualizations, batch position creation, provider profiles with cross-chain positions, sub-wallets, and an AI-assisted liquidity provisioning flow via the 1inch Business MCP with safe batch deployment, coming soon.
Aqua has undergone eight independent security audits conducted by OpenZeppelin, Bailsec, Hashlock, Hexens, MixBytes, Nethermind, Theori, and Decurity. Combined with its fully self-custodial design, which never holds user tokens, a swap can only move assets that are actually in the provider’s wallet at the moment it fills. Revocation stops new fills as soon as it confirms on-chain. Aqua is also protected from JIT fee sniping by design, as each position has a single owner, thus there is no shared fee moment bots can capitalize on. While Aqua’s design keeps exposure bounded and providers in control of their own tokens, swap fees are not guaranteed, prices can move against a position (impermanent loss), and providers bear market and smart-contract risk.
1inch accelerates decentralized finance with a seamless crypto trading experience for27M users. Beyond being the top platform for low-cost, efficient token swaps with$100M+ in daily trades, 1inch offers a range of innovative tools, including a secure self-custodial wallet, a portfolio tracker for managing digital assets, a dedicated business portal giving access to its cutting-edge technology, and even a debit card for easy crypto spending. By continuously innovating, 1inch is simplifying DeFi for everyone.
Aqua involves risk, including loss of funds. It’s built for experienced users — do your own research. Not financial advice. Incentive rewards are variable, not guaranteed, and subject to the program’s published terms.