

SEOUL, South Korea, April 29, 2026 /PRNewswire/ — On April 29, 2026, SK Telecom Co., Ltd. filed its Annual Report on Form 20-F for the year ended December 31, 2025 with the U.S. Securities and Exchange Commission. The 2025 Annual Report on Form 20-F can be viewed on www.sktelecom.com, as well as from the website of the U.S. Securities and Exchange Commission at www.sec.gov. Printed copies of SK Telecom’s complete audited financial statements (including footnotes) as of and for the year ended December 31, 2025 can be requested, free of charge, by written request to skt.ir@sk.com.
United Imaging Healthcare Releases 2025 Annual Report and Q1 2026 Results, Delivering Strong Growth with Accelerated Global Expansion
SHANGHAI, April 29, 2026 /PRNewswire/ — United Imaging Healthcare (688271.SH),a global innovator in advanced medical imaging technologies and intelligent healthcare solutions, announced its 2025 annual results and Q1 2026 performance, both delivering solid growth. In 2025, the company reported revenue of RMB 13.80 billion, representing a year-on-year increase of 33.98%, and net profit attributable to shareholders of RMB 1.87 billion, up 48.14% year-on-year. In Q1 2026, the company maintained steady growth momentum, reporting revenue of RMB 2.91 billion, a year-on-year increase of 17.34%, and net profit attributable to shareholders of RMB 0.40 billion, representing a 7.78% year-on-year increase.
In 2025, United Imaging Healthcare continued to deepen its commitment to innovation, with annual R&D investment reaching RMB 2.62 billion, up 15.95% year-on-year. Leveraging sustained high-intensity R&D investment and its globally coordinated innovation network, the Company made significant progress in core underlying technologies, key component breakthroughs, and system integration capabilities, with multiple strategic products successfully commercialized. A key outcome was the launch of the uSONIQUE ultrasound series, which completed the company’s imaging portfolio and solidified its position as a total-solution provider for the global market.
As of the end of 2025, United Imaging Healthcare had launched more than 150 products, including 75 products with EU CE certification and 58 products cleared by the U.S. FDA via the 510(k) pathway. In addition, over 20 products have received FDA clearance for AI-enabled medical devices, further reinforcing the company’s leadership in both technology and product innovation in the high-end medical equipment sector.
Driven by its strong innovation capabilities, premium brand recognition, and integrated delivery and service capabilities, the company’s overseas revenue reached RMB 3.43 billion in 2025, representing a year-on-year increase of 51.39%. To date, United Imaging Healthcare has expanded its footprint to over 100 countries and regions worldwide, with regional service centers established in 12 countries and regions. The number of overseas service sites has increased to 44, while the global spare parts warehouse network has expanded to 39 locations, significantly shortening service response times and enhancing customer service efficiency.
In North America, the Company maintained steady growth, achieving increases in both orders and revenue. By the end of 2025, its high-end imaging equipment had been installed across more than 90% of U.S. states, with cumulative installations exceeding 640 systems. The company has successfully entered multiple leading global clinical and research institutions, with systems fully installed and actively used in clinical practice.
In Europe, the company delivered rapid growth, with annual revenue increasing by nearly 50% year-on-year. As part of its ongoing regulatory advancements, the company achieved CE certification for a range of products in early 2026, including a key milestone: the approval of its RT (radiotherapy) systems. This marked a significant step in implementing its “integrated diagnosis and therapy” strategy in Europe. This is expected to further accelerate the penetration of its full product portfolio in the region.
In the Asia-Pacific region and other emerging markets, United Imaging Healthcare achieved record-high regional revenue, the Asia-Pacific region achieved a year-on-year growth of over 40%, while emerging markets recorded a growth rate of over 80%. In developed Asia-Pacific markets, the company made notable breakthroughs in collaborations with leading healthcare institutions in countries such as Singapore and Australia. The deployment of high-end equipment accelerated significantly, in emerging markets including South Asia, the Middle East and North Africa (MENA), with new orders secured from countries such as Turkey, Kuwait, and Morocco.
Looking ahead, United Imaging Healthcare remains focused on advancing healthcare through continuous innovation. The company will further develop cutting-edge technologies, enhance clinical outcomes and agile, and efficient global operating model, strengthening the foundation for sustainable growth and enabling broader access to high-quality healthcare for patients worldwide.
Delivering an Open Data Center Ecosystem for AI
|
Driving Innovations from Chip to Grid Across Hyperscale and Local Data Centers
BARCELONA, Spain, April 29, 2026 /PRNewswire/ — The Open Compute Project Foundation (OCP), the nonprofit international organization bringing at-scale innovations and hyperscale best practices to all, today announced newly approved OCP contributions, new projects, and recently formed alliances to deliver on its Open Data Center Ecosystem for AI vision announced in October of 2025 covering IT as well as physical data center infrastructure and facilities.
The newly approved OCP contributions include (1) a roadmap for open data center facilities for AI, Next Generation ML Infrastructure Design Principles, (2) an overview of proposed direct current power distribution architectures Data Center Facility – Low Voltage DC Power Distribution, (3) guidelines for safe design, operation, and maintenance of energy storage systems Requirements for Energy Storage Systems used in Data Centers, (4) new methods for gathering telemetry to enable data center real time IT and OT management Third Party Integration, Telemetry & APIs, (5) using Ethernet for AI scale-up networking ESUN – Network Operator Requirements, (6) a major expansion to the Open Rack ecosystem for AI with the Open Rack Wide (ORW) specification (7) new reference architectures for building AI Clusters Open Cluster Designs for AI White Paper, Open POD Group for M xPUs, and Open Cluster of N xPUs, and (8) developing open chiplet ecosystems with the Foundation Chiplet System Architecture.
“These OCP approved contributions address critical problems for AI data centers, several of which were highlighted in an open letter call for collaboration initiated by Google, Meta, and Microsoft last October. The OCP Community, OCP Foundation Team, and the OCP Board of Directors have been hard at work to overcome the challenges from chip to grid of deploying AI Clusters at scale. With no end in sight to the very large AI data center buildout, the collaborations and innovation standardizations within the OCP Community are more important than ever,” said George Tchaparian, CEO at OCP.
To continue the collaborative work, recently launched projects and workstreams covering significant challenges still to be solved: (1) AI DC facilities: Open Data Center for AI and Data Center Facilities Power Distribution, (2) AI Clusters Connectivity: with Ethernet for Scale-Up Networking (ESUN), Scale-Up Ethernet Transport (SUE-T) and Optics Reliability, and (3) addressing the next wave of AI Inference: with the AI Computing Continuum.
Open Data Center for AI is focused on solving the most pressing challenges facing the deployment of at-scale AI data center facility infrastructure and operational technology (OT). This includes open data center reference designs, energy and grid solutions, telemetry and management solutions, and power estimation methodologies.
DCF Power Distribution aims to increase power density to enable next generation compute by enhancing energy efficiency and streamline power distribution, including the transition to Low Voltage Direct Current – LVDC (≤1500VDC) distribution architectures for the data center.
Scale-up Networking and Optics Reliability aims to advance Ethernet for scale-up domains in AI systems, re-examining how traffic is sent out across the network switches, including protocol headers, error handling, and lossless data transfer. Improving optics reliability with interoperability becomes critical because even a small failure rate across massive fabrics can cascade into significant interruptions, wasted accelerator hours, and degraded overall system utilization.
AI Computing Continuum aims to accelerate the adoption of scalable, interoperable, and sustainable AI systems beyond traditional hyperscale data centers by defining open, modular infrastructure standards that work across diverse hyperscale adjacent environments—including regional colocation, enterprise on premises, telco points of presence, and industrial sites.
We’ve also formed new alliances adding new dimensions to OCP’s ecosystem with (1) the Electric Power Research Institute (EPRI) and (2) the IOWN Global Forum.
EPRI and OCP aim to accelerate digital innovation and further develop the potential of data centers to serve as flexible resources for the power system.
Current/OS and OCP focused on data center power technology standards and best practices. The alliance between the two organizations will fuse OCP’s expertise in open data center hardware with Current/OS’s open standards for safe, interoperable direct current microgrids. This alliance aims to accelerate the shift from traditional AC-based power to efficient hybrid AC/DC or fully DC-native data center infrastructure.
IOWN Global Forum and OCP are working to deliver a seamless computational infrastructure from centralized to edge deployments. IOWN Global Forum and OCP will work together to develop a roadmap for a multi-site, high-bandwidth, low-latency compute and network infrastructure.
“The need for extreme integration and co-design when designing AI clusters has become an imperative in the push to have a significant performance increment in generation over generation infrastructure. The move by the OCP Foundation to expand its Community footprint to cover from chip to grid is in perfect sync with the market and an important focus to deliver innovations needed for next generation AI data centers,” said Ashish Nadkarni, GVP/GM, Worldwide Enterprise Infrastructure at IDC.
About OCP
The Open Compute Project (OCP) brings at-scale innovations and hyperscaler best practices to all, spanning technology domains from the data center to the edge, and the technology stack from silicon, to systems, to site facilities and services. The international OCP Community is made up of organizations and people from hyperscale, neocloud and cloud data center operators, communications providers, colocation providers, diverse enterprises, and technology providers. With The OCP Tenets of Openness, Impact, Efficiency, Scale and Sustainability, the OCP Foundation engages with industry ecosystems, our growing membership, and educates thousands of engineers and industry leaders, every year. Across many projects and initiatives, the OCP Foundation and its Community are meeting the AI Data Center market evolution today and shaping the future. Learn more at: www.opencompute.org.
Media Contact
Dirk Van Slyke
Open Compute Project Foundation
dirkv@opencompute.org
The MIT-IBM Computing Research Lab Launches to Shape the Future of AI and Quantum Computing
Building on a long-standing MIT–IBM collaboration, the new lab will chart the convergence of AI, algorithms, and quantum computing
CAMBRIDGE, Mass., April 29, 2026 /PRNewswire/ — IBM (NYSE: IBM) and the Massachusetts Institute of Technology today announced the launch of the MIT-IBM Computing Research Lab, advancing their long-standing collaboration to shape the next era of computing. The new lab expands its scope to include quantum computing, alongside foundational artificial intelligence research, with the goal of unlocking new computational approaches that go beyond the limits of today’s classical systems.
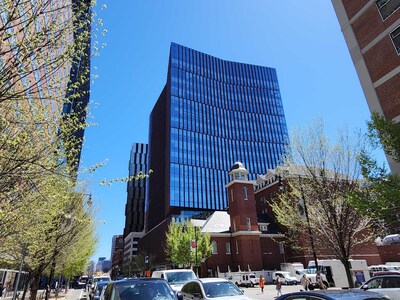
Street‑level view of the MIT‑IBM Computing Research Lab in Cambridge, MA.
The MIT-IBM Computing Research Lab builds on a distinguished history of scientific excellence at the intersection of research and academia. Evolving from the MIT-IBM Watson AI Lab, which originated in 2017 on MIT’s campus, the new lab reflects a transformed technology landscape—one in which AI has entered mainstream deployment, and quantum computing is rapidly advancing toward practical impact. Together, MIT and IBM aim to help lead research in AI and quantum and to redefine mathematical foundations across both domains.
“We expect the MIT-IBM Computing Research Lab to emerge as one of the world’s premier academic and industrial hubs accelerating the future of computing,” said Jay Gambetta, director of IBM Research and IBM Fellow, and IBM chair of the MIT-IBM Computing Research Lab. “Together, the brightest minds at MIT and IBM will rethink how models, algorithms, and systems are designed for an era that will be defined by the sum of what’s possible when AI and quantum computing come together.”
“For a decade, the collaboration between MIT and IBM has produced leading-edge research and innovation, provided mentorship and supported the professional growth of researchers both at MIT and IBM,” said Anantha Chandrakasan, MIT’s provost, who as then-dean of the School of Engineering spearheaded the creation of the MIT-IBM Watson AI Lab and will continue as MIT chair of the lab. “The incredible technical achievements set the bar high for our work together over the next 10 years. I look forward to another decade of impact.”
Addressing the next frontiers in computation
The MIT-IBM Computing Research Lab will serve as a focal point for joint research between MIT and IBM in AI, algorithms, and quantum computing, as well as the integration of these technologies into hybrid computing systems. The lab is designed to accelerate progress toward powerful new computational approaches that take advantage of rapid advances in AI and quantum-centric supercomputing, including those that combine maturing quantum hardware with classical systems and advanced AI methods.
This research initiative will include improving capabilities and integrating AI with traditional computing, alongside pursuing advances in small, efficient, modular language model architectures, novel AI computing paradigms, and enterprise-focused AI systems designed for deployment in real-world environments, where reliability, transparency, and trust are essential.
In parallel, the lab will rethink the mathematical and algorithmic foundations that underpin the next era of computing by accelerating the development of novel quantum algorithms for complex problems, with impacts in areas such as materials science, chemistry, and biology.
Additionally, the lab will investigate mathematical and algorithmic foundations of machine learning, optimization, Hamiltonian simulations, and partial differential equations, which are used to approximate the behaviors of dynamical systems that currently stump classical systems’ scale and accuracy. Innovations from the lab could have wide implications for global industries, from more accurate weather and air turbulence prediction to better forecasts of financial market performance. Similarly, with improved optimization approaches, research from the lab could help lower risks in areas like finance, predict protein structures for more targeted medicine, and streamline global supply chains.
With its focus on AI, algorithms, and quantum, the MIT-IBM Computing Research Lab will complement and enhance the work of two of MIT’s strategic initiatives, the MIT Generative AI Impact Consortium and the MIT Quantum Initiative. MIT President Sally Kornbluth launched the strategic initiatives to broaden and deepen MIT’s impact in developing solutions to serious global challenges. The MIT-IBM Computing Research Lab will also leverage IBM’s longtime leadership and expertise in quantum computing. As part of its ambitious roadmap, IBM has laid out a clear path to delivering the world’s first fault-tolerant quantum computer by 2029, and is working across industries to drive value from quantum-centric supercomputing, tightly integrating quantum computers with high-performance computing and AI accelerators to solve the world’s toughest problems.
Deep integration with scientific domains
The MIT-IBM Computing Research Lab will also continue to serve as a foundation for training the next generation of computational scientists and innovators. It will do so by engaging faculty and students across MIT departments, enabling new computational approaches to accelerate discoveries in the physical and life sciences.
The lab will continue to be co-directed by Aude Oliva, senior research scientist at MIT’s Computer Science and Artificial Intelligence Laboratory, and David Cox, vice president, AI Foundations at IBM Research. MIT and IBM have appointed leads for each of the lab’s three focus areas – AI, algorithms, and quantum. Jacob Andreas, associate professor in the Department of Electrical Engineering and Computer Science (EECS), and Kenney Ng, principal research scientist at IBM Research and the MIT-IBM science program manager, will co-lead AI; Vinod Vaikuntanathan, the Ford Foundation Professor of Engineering in EECS, and Vasileios Kalantzis, IBM Research senior research scientist, will co-lead algorithms; and Aram Harrow, professor of physics, and Hanhee Paik, IBM director of Quantum Algorithm Centers, will co-lead quantum.
“The MIT-IBM Computing Research Lab reflects an important expansion of the collaboration between MIT and IBM and the increasing connections across AI, algorithms and quantum. This deepened focus also underscores a strong alignment with the MIT Schwarzman College of Computing’s mission to advance the forefront of computing and its integration across disciplines,” said Dan Huttenlocher, dean of the MIT Schwarzman College of Computing and MIT co-chair of the lab. “I’m excited about what this next chapter will enable in these three areas and their impact broadly.”
Building on nearly a decade of collaboration
The MIT-IBM Watson AI Lab helped pioneer a model for academic-industry research collaboration, aligning long-term scientific inquiry with real world impact. Since its inception, the lab has funded over 210 research projects involving over 150 MIT faculty members and over 200 IBM researchers. Collectively the projects have led to over 1,500 peer-reviewed articles. The lab also helped shape the career growth of a number of MIT students and junior researchers, funding more than 500 students and postdoctoral scholars.
“The true measure of this lab is not just innovation, but transformation of a field. Hundreds of students have contributed to thousands of publications in top conferences and journals, demonstrating their capabilities to address meaningful problems,” said Oliva. “The MIT-IBM Computing Research Lab builds on an extraordinary legacy of impact to advance a trusted collaboration that will redefine the future of AI and quantum computing in a way never seen before.”
“By coupling academic rigor with industrial scale, the lab aims to define the computational foundations that will power the next generation of AI, quantum, and scientific breakthroughs,” said Cox. “By bringing together advances in AI, algorithms, and quantum computing under one integrated research effort, we’re creating the conditions to rethink the mathematical and computational foundations of science and engineering.”
The MIT-IBM Computing Research Lab will capitalize on this foundation, expanding both the scientific scope and the ecosystem of collaborators across the Cambridge-Boston region and beyond.
About the MIT Schwarzman College of Computing
The MIT Schwarzman College of Computing addresses the opportunities and challenges for the computing age—from hardware and software to algorithms and artificial intelligence. Launched in 2020, the college advances the frontiers of computer science, AI, and other forefront areas of computing, infuses these fields across disciplines at MIT, and leads efforts to tackle the social, ethical, and policy dimensions of a rapidly evolving digital world. Visit computing.mit.edu for more information.
About IBM
IBM is a leading global hybrid cloud and AI, and business services provider, helping clients in more than 175 countries capitalize on insights from their data, streamline business processes, reduce costs and gain the competitive edge in their industries. Thousands of governments and corporate entities in critical infrastructure areas such as financial services, telecommunications and healthcare rely on IBM’s hybrid cloud platform and Red Hat OpenShift to affect their digital transformations quickly, efficiently and securely. IBM’s breakthrough innovations in AI, quantum computing, industry-specific cloud solutions and business services deliver open and flexible options to our clients. All of this is backed by IBM’s legendary commitment to trust, transparency, responsibility, inclusivity and service.
For more information, visit https://research.ibm.com.
Media Contacts
Brittany Forgione
IBM Research Communications
Brittany.Forgione@ibm.com
Ashley Peterson
IBM Research Communications
ashley.peterson@ibm.com
IBM Corporation logo.
LTS Expands CDMO Portfolio with Ophthalmic Drug Delivery Solutions
ANDERNACH, Germany, April 29, 2026 /PRNewswire/ — LTS LOHMANN Therapie-Systeme AG (“LTS”), a leading pharmaceutical technology company specializing in advanced drug delivery systems, today announced the expansion of its service portfolio to include CDMO services for ophthalmic drug delivery solutions, with manufacturing capacities located in the United States at LTS’ Lakewood, New Jersey facility.
The new offering focuses initially on product development through clinical manufacturing of sterile ophthalmic products, filled in preservative–free multidose devices. Leveraging its established commercial aseptic manufacturing capabilities in nasal sprays and vials, LTS is well positioned to meet the high quality and regulatory demands of ophthalmic treatments, including products for chronic and acute eye conditions.
Building on decades of experience in drug delivery technologies, LTS ultimately plans to offer end–to–end CDMO services for ophthalmic drug products, ranging from formulation development through commercial manufacturing. All activities will be conducted in compliance with global regulatory standards, supporting both U.S. and international market requirements.
“Ophthalmic drug delivery presents unique challenges in terms of sterility, efficacy, and patient safety,” said Bas van Buijtenen, CEO at LTS. “Our aseptic manufacturing capabilities in Lakewood, are the perfect foundation to build industry-leading CDMO capabilities and capacity for ophthalmics, powering the future of drug delivery in this field in North America. We look forward to extending our purpose – We CARE. We CREATE. We DELIVER -towards an even wider group of customers, therapies and patients.”
The expanded CDMO services are intended to support pharmaceutical and biotech companies seeking a reliable U.S.-based manufacturing partner for ophthalmic drug delivery solutions. By combining development expertise, sterile manufacturing infrastructure, and a strong quality culture, LTS aims to act as a long–term partner across the entire product lifecycle.
This portfolio expansion reflects LTS’s strategic commitment to continuously broaden its technology and service offerings and to address growing demand for specialized drug delivery solutions in sensitive therapeutic areas.
About LTS Lohmann Therapie-Systeme AG
At LTS, our purpose drives everything we do: We CARE for patients, our partners, employees and communities, we CREATE innovative drug delivery solutions, and we DELIVER high-quality products to global markets with an exceptional track record in commercial manufacturing. As a global CDMO, we offer end-to-end development and manufacturing services for pharmaceutical and biotech companies.
Our technology portfolio spans transdermal patches, oral thin films, nasal and sterile drug delivery products, wearable drug delivery devices as well as microneedle array patches. With over 40 commercial products and 50+ active development programs, we combine deep expertise with patient-centric innovation to advance small molecules, biologics, and vaccines.
Operating from five global sites in the US, Germany and Israel and a representative office in China, LTS powers the future of drug delivery.
For further information, please contact:
LTS Lohmann Therapie-Systeme AG
Dr Iris Schnitzler: iris.schnitzler@ltslohmann.com
+492632-992589
ESG | HitGen Releases 2025 Sustainability Report
|
CHENGDU, China, April 29, 2026 /PRNewswire/ — Shanghai Stock Exchange listed company HitGen Inc. (“HitGen”, SSE: 688222.SH) released its 2025 Sustainability Report on April 29, 2026. This report is the second sustainability report of HitGen, aiming to present the Company’s philosophies and policies in environmental, social, and governance (“ESG”) areas, as well as its sustainable development practices and performance in the year of 2025, to systematically respond to stakeholder concerns.
Dr. Jin Li, Chairman of the Board and CEO of HitGen Inc., commented: “As an innovative biopharmaceutical enterprise committed to ‘contributing to human health’, HitGen has always believed that the core of a company lies in continuously creating value. In 2025, we remained dedicated to practical and determined actions, driving sustainable development to be integrated into strategy, embedded in management, and deeply rooted in operations. This strengthens the solid foundation for long-term success and enables us to continuously contribute, through tangible efforts from HitGen, to our customers, collaborators, investors, employees, as well as the environment and communities on which we depend.”
- Sustainable Corporate Governance
HitGen continuously optimizes its governance system, upholds the principle of integrity in business operations to set an industry benchmark, and establishes a comprehensive risk management system to promote long-term and stable development, creating sustainable value for all stakeholders.
- Responsible Value Chain
HitGen adheres to product safety and service quality, builds a sustainable supply chain, systematically manages all aspects of the value chain, and is committed to collaboratively creating long-term comprehensive value with stakeholders.
- Employees and Community
HitGen regards employees as the core driving force for sustainable development and communities as important partners for mutual growth. Adhering to a responsibility philosophy centred on people and dedicated to giving back to society, HitGen promotes employee growth and community co-development.
- Environment
HitGen adheres to the concept of green development, integrates environmental management into corporate operation and development strategies, and systematically advances environmental management, ecological protection, waste management, resource utilization, addressing climate change and other initiatives.
Dr. Jin Li said, “Every step counts, leading to great distances. On our journey to becoming a world-class innovative biopharmaceutical enterprise, we will continue to adhere to market demand as our guide and technological breakthroughs as our engine, continuously optimizing our innovative drug discovery services system, and contributing to building a more inclusive, healthy, green and accessible world.”
For more information on HitGen’s Sustainability Report, please visit:
https://www.hitgen.com/en/sustainability.html
About HitGen Inc.
HitGen Inc. (SSE: 688222.SH) is dedicated to building a world-class innovative biopharmaceutical enterprise. Driven by the mission to advance human health and quality of life, it provides innovative therapeutic solutions to address unmet medical needs. Centered on its internationally leading DEL (DNA-encoded Library) technology, the Company has expanded into Fragment-Based Drug Discovery and Structure-Based Drug Design and a suite of complementary platforms based on Oligonucleotide-based Therapeutics, Targeted Proximity Drugs, and Cyclic Peptidomimetics, and has developed HAILO, a proprietary “DEL+AI+Automation” molecular optimization platform, thereby establishing a distinctive novel molecule discovery engine that delivers both therapeutics molecules and tool molecules to the global pharmaceutical industry. Headquartered in Chengdu, China, HitGen maintains subsidiaries in Cambridge, UK, and Houston, USA, with its operational network spanning the globe. Through diversified and flexible business models including technical services, project out-licensing and product sales, the Company has forged extensive collaborations with a broad range of pharmaceutical and biotechnology companies, chemical firms, foundations, and research institutions. As of the end of 2025, it has empowered over 600 clients globally and contributed to thousands of their innovative drug development projects. HitGen also advances multiple internal programmes at various clinical and preclinical stages. For more information, please visit www.hitgen.com.
Daqo New Energy Announces Unaudited First Quarter 2026 Financial Results
SHANGHAI, April 29, 2026 /PRNewswire/ — Daqo New Energy Corp. (NYSE: DQ) (“Daqo New Energy” the “Company” or “we”), a leading manufacturer of high-purity polysilicon for the global solar PV industry, today announced its unaudited financial results for the first quarter ended March 31, 2026.
First Quarter 2026 Financial and Operating Highlights
- Aggregate of cash, short-term investments, bank notes receivable, held-to-maturity investments and fixed term bank deposit balance was $2.00 billion at the end of Q1 2026, compared to $2.27 billion at the end of Q4 2025
- Polysilicon production volume was 43,402 MT in Q1 2026, compared to 42,181 MT in Q4 2025
- Polysilicon sales volume was 4,482 MT in Q1 2026, compared to 38,167 MT in Q4 2025
- Polysilicon average total production cost(1) was $5.95/kg in Q1 2026, compared to $5.83/kg in Q4 2025
- Polysilicon average cash cost(1) was $4.59/kg in Q1 2026, compared to $4.46/kg in Q4 2025
- Polysilicon average selling price (ASP) was $5.96/kg in Q1 2026, compared to $5.83/kg in Q4 2025
- Revenue was $26.7 million in Q1 2026, compared to $221.7 million in Q4 2025
- Gross loss was $139.4 million in Q1 2026, compared to gross profit of $15.4 million in Q4 2025; gross margin was negative 521.5% in Q1 2026, compared to 7.0% in Q4 2025
- Net loss attributable to Daqo New Energy Corp. shareholders was $88.4 million in Q1 2026, compared to $7.3 million in Q4 2025; loss per basic American Depositary Share (ADS)(3) was $1.31 in Q1 2026, compared to $0.11 in Q4 2025
- Adjusted net loss (non-GAAP)(2) attributable to Daqo New Energy Corp. shareholders was $88.4 million in Q1 2026, compared to $7.3 million in Q4 2025
- Adjusted loss per basic ADS(3) (non-GAAP)(2) was $1.31 in Q1 2026, compared to adjusted loss per basic ADS(3) (non-GAAP)(2) of $0.11 in Q4 2025; EBITDA (non-GAAP)(2) was negative $83.1 million in Q1 2026, compared to $52.5 million in Q4 2025; EBITDA margin (non-GAAP)(2) was negative 311.1% in Q1 2026, compared to 23.7% in Q4 2025
|
Three months ended |
|||
|
US$ millions except as indicated otherwise |
Mar. 31, |
Dec. 31, |
Mar. 31, |
|
Revenues |
26.7 |
221.7 |
123.9 |
|
Gross (loss)/profit |
(139.4) |
15.4 |
(81.5) |
|
Gross margin |
(521.5) % |
7.0 % |
(65.8) % |
|
Loss from operations |
(150.8) |
(20.9) |
(114.1) |
|
Net loss attributable to Daqo New Energy Corp. |
(88.4) |
(7.3) |
(71.8) |
|
Loss per basic ADS(3) ($ per ADS) |
(1.31) |
(0.11) |
(1.07) |
|
Adjusted net loss (non-GAAP)(2) attributable to Daqo |
(88.4) |
(7.3) |
(53.2) |
|
Adjusted loss per basic ADS(3) (non-GAAP)(2) ($ per |
(1.31) |
(0.11) |
(0.80) |
|
EBITDA (non-GAAP)(2) |
(83.1) |
52.5 |
(48.4) |
|
EBITDA margin (non-GAAP)(2) |
(311.1) % |
23.7 % |
(39.1) % |
|
Polysilicon sales volume (MT) |
4,482 |
38,167 |
28,008 |
|
Polysilicon average total production cost ($/kg)(1) |
5.95 |
5.83 |
7.57 |
|
Polysilicon average cash cost (excl. dep’n) ($/kg)(1) |
4.59 |
4.46 |
5.31 |
|
Notes: |
Management Remarks
Mr. Xiang Xu, CEO of Daqo New Energy, commented, “In the first quarter of 2026, market sentiment across the solar PV industry remained cautious amid seasonal softness and elevated inventory levels. It was further exacerbated by rising module prices, driven by higher silver, aluminum, and glass costs, which led to a market slowdown in China. Geopolitical tensions in the Middle East also weighed on end-market demand in the region. Against this backdrop, persistent industry overcapacity continued to exert downward pressure on polysilicon prices, resulting in quarterly operating and net losses. Notwithstanding these headwinds, we continued to maintain a robust and healthy balance sheet with zero debt. As of March 31, 2026, we held a cash balance of $559.4 million, short-term investments of $288.3 million, bank notes receivables of $20.8 million, held-to-maturity investments of $50.3 million, and a fixed term bank deposit balance of $1.1 billion. In total, these assets that can be converted into cash stood at $2.0 billion, providing us with ample liquidity. This solid financial position gives us the confidence and strategic flexibility to navigate the current market downturn.”
“On the operational front, we continued to take proactive measures to navigate challenging market conditions and weak selling prices, with nameplate capacity utilization rate operating at approximately 57%. Total production volume at our two polysilicon facilities was 43,402 MT for the quarter, exceeding our guidance range of 35,000 MT to 40,000 MT. With market prices for polysilicon experiencing a notable decline to be below production costs during the quarter, we adhered to the Chinese authorities’ self-regulation guidelines by declining to engage in below-cost sales. We adopted a disciplined, wait-and-see approach pending further implementation of the national anti-involution policies we highlighted last quarter. As a result, our sales volume dropped to 4,482 MT, while our average selling price increased 2.3% sequentially to $5.96/kg. On the cost side, total production and cash costs increased marginally by 2% and 3%, respectively, on a sequential basis, primarily driven by exchange rate movements. However, despite higher silicon metal costs, manufacturing costs in RMB terms actually declined slightly on a sequential basis, reflecting our continued improvements in manufacturing efficiency.”
“In light of the current market dynamics, we expect total polysilicon production volume in the second quarter of 2026 to be approximately 35,000 MT to 40,000 MT. For the full year of 2026, we expect production volume to remain in the range of 140,000 MT to 170,000 MT.”
“With the solar market impacted by seasonality surrounding the Chinese New Year holidays and the absence of concrete updates on capacity rationalization policies, polysilicon transactions and shipment volumes remained low during the quarter. N-type polysilicon prices dropped from RMB 48-55/kg at the end of 2025 to RMB 35-37/kg by the end of the first quarter. However, polysilicon prices heading into the second quarter are showing signs of bottoming out, with weekly declines gradually easing. While producers awaited clear guidelines from authorities to tackle overcapacity, a weak demand outlook, industry inventory build-up, and financial pressure forced several peers to adjust their production and pricing strategies toward a more market-oriented approach. As a result, industry-level monthly polysilicon supply fell to approximately 93,000 MT during the quarter, representing an industry average utilization rate of just 39%. Looking ahead, we expect government authorities to strengthen the anti-involution policies necessary to address these industry-wide overcapacity issues. As an encouraging move, on April 17, the Ministry of Industry and Information Technology, the National Development and Reform Commission, the State Administration for Market Regulation, the National Energy Administration, and other key national departments jointly held a symposium on regulating market competition within the solar PV sector, reinforcing the urgent need to address irrational competition and curb destructive involution. Additionally, all relevant authorities are now required to deploy concerted measures to strengthen industry governance and promote the high-quality development of the solar PV industry, including in respect of capacity regulation, standards guidance, innovation-driven development, price law enforcement, quality supervision, mergers and acquisitions, and intellectual property rights protection.”
“More broadly, the solar PV industry continues to exhibit compelling long-term growth prospects. Growing vulnerabilities in global energy markets have sparked widespread concerns about national energy security, in which the solar PV and renewable energy sectors can play a crucial role. As one of the world’s lowest-cost producers of the highest-quality N-type polysilicon, backed by a robust balance sheet and zero debt, we remain optimistic about the sector and are well positioned to capitalize on the anticipated market recovery and long-term growth opportunities. We will continue to strengthen our competitive edge through advancements in high-efficiency N-type technology and cost optimization via digital transformation and AI adoption. As the world accelerates its transition to clean energy, we are confident in our ability to play a leading role in shaping that future.”
Outlook and guidance
The Company expects to produce approximately 35,000 MT to 40,000 MT of polysilicon during the second quarter of 2026. The Company expects to produce approximately 140,000 MT to 170,000 MT of polysilicon for the full year of 2026, inclusive of the impact of the Company’s annual facility maintenance.
This outlook reflects Daqo New Energy’s current and preliminary view as of the date of this press release and may be subject to changes. The Company’s ability to achieve these projections is subject to risks and uncertainties. See “Safe Harbor Statement” at the end of this press release.
First Quarter 2026 Results
Revenues
Revenues were $26.7 million, compared to $221.7 million in the fourth quarter of 2025 and $123.9 million in the first quarter of 2025. The decrease in revenues compared to the fourth quarter of 2025 was primarily due to a decrease in sales volume, as the Company reduced sales in light of the relative low selling prices.
Gross (loss)/profit and margin
Gross loss was $139.4 million, compared to gross profit of $15.4 million in the fourth quarter of 2025 and gross loss of $81.5 million in the first quarter of 2025. Gross margin was negative 521.5%, compared to 7.0% in the fourth quarter of 2025 and negative 65.8% in the first quarter of 2025. The decrease in gross margin compared to the fourth quarter of 2025 was primarily due to an increase in provisions for inventory impairment.
Selling, general and administrative expenses
Selling, general and administrative (SG&A) expenses were $12.2 million, compared to $18.7 million in the fourth quarter of 2025 and $35.1 million in the first quarter of 2025. The sequential decrease was primarily due to lower sales volume in the first quarter of 2026. The year-over-year decrease was also because the Company recognized $18.6 million in non-cash share-based compensation related to its share incentive plans in the first quarter of 2025.
Research and development expenses
Research and development (R&D) expenses were $0.8 million, compared to $0.7 million in the fourth quarter of 2025 and $0.5 million in the first quarter of 2025. R&D expenses can vary from period to period and reflect R&D activities that take place during the quarter.
Loss from operations and operating margin
As a result of the foregoing, loss from operations was $150.8 million, compared to $20.9 million in the fourth quarter of 2025 and $114.1 million in the first quarter of 2025.
Operating margin was negative 564.4%, compared to negative 9.4% in the fourth quarter of 2025 and negative 92.0% in the first quarter of 2025.
Net loss attributable to Daqo New Energy Corp. shareholders and loss per ADS
As a result of the foregoing, net loss attributable to Daqo New Energy Corp. shareholders was $88.4 million, compared to $7.3 million in the fourth quarter of 2025 and $71.8 million in the first quarter of 2025.
Loss per basic ADS was $1.31, compared to $0.11 in the fourth quarter of 2025 and $1.07 in the first quarter of 2025.
Adjusted net loss (non-GAAP) attributable to Daqo New Energy Corp. shareholders and adjusted loss per ADS (non-GAAP)
Adjusted net loss (non-GAAP) attributable to Daqo New Energy Corp. shareholders, excluding non-cash share-based compensation costs, was $88.4 million, compared to $7.3 million in the fourth quarter of 2025 and $53.2 million in the first quarter of 2025.
Adjusted loss per basic ADS was $1.31, compared to $0.11 in the fourth quarter of 2025 and $0.80 in the first quarter of 2025.
EBITDA
EBITDA (non-GAAP) was negative $83.1 million, compared to $52.5 million in the fourth quarter of 2025 and negative $48.4 million in the first quarter of 2025. EBITDA margin (non-GAAP) was negative 311.1%, compared to 23.7% in the fourth quarter of 2025 and negative 39.1% in the first quarter of 2025.
Financial Condition
As of March 31, 2026, the Company had $559.4 million in cash, cash equivalents and restricted cash, compared to $980.3 million as of December 31, 2025 and $791.9 million as of March 31, 2025. As of March 31, 2026, short-term investment was $288.3 million, compared to $114.0 million as of December 31, 2025 and $168.2 million as of March 31, 2025. As of March 31, 2026, the notes receivable balance was $20.8 million, compared to $135.5 million as of December 31, 2025 and $62.7 million as of March 31, 2025. Notes receivable represents bank notes with maturity within six months. As of March 31, 2026, held-to-maturity investment was $50.3 million, compared to nil as of December 31, 2025 and nil as of March 31, 2025. As of March 31, 2026, the balance of fixed term deposit within one year was $1.0 billion, compared to $972.4 million as of December 31, 2025 and $1.1 billion as of March 31, 2025.
Cash Flows
For the three months ended March 31, 2026, net cash used in operating activities was $147.5 million, compared to $38.9 million in the same period of 2025.
For the three months ended March 31, 2026, net cash used in investing activities was $275.8 million, compared to $211.0 million in the same period of 2025. The net cash used in investing activities in 2026 was primarily related to the purchase of short-term investments and fixed term deposits.
For the three months ended March 31, 2026, net cash used in financing activities was $7.8 million, compared to nil in the same period of 2025. The net cash used in financing activities in 2026 was primarily related to $7.8 million in stock repurchases made by the Company’s subsidiary, Xinjiang Daqo, from its minority shareholders.
Use of Non-GAAP Financial Measures
To supplement Daqo New Energy’s consolidated financial results presented in accordance with United States Generally Accepted Accounting Principles (“US GAAP”), the Company uses certain non-GAAP financial measures that are adjusted for certain items from the most directly comparable GAAP measures including earnings before interest, taxes, depreciation and amortization (“EBITDA”) and EBITDA margin; adjusted net income attributable to Daqo New Energy Corp. shareholders and adjusted earnings per basic and diluted ADS. Our management believes that each of these non-GAAP measures is useful to investors, enabling them to better assess changes in key element of the Company’s results of operations across different reporting periods on a consistent basis, independent of certain items as described below. Thus, our management believes that, used in conjunction with US GAAP financial measures, these non-GAAP financial measures provide investors with meaningful supplemental information to assess the Company’s operating results in a manner that is focused on its ongoing, core operating performance. Our management uses these non-GAAP measures internally to assess the business, its financial performance, current and historical results, as well as for strategic decision-making and forecasting future results. Given our management’s use of these non-GAAP measures, the Company believes these measures are important to investors in understanding the Company’s operating results as seen through the eyes of our management. These non-GAAP measures are not prepared in accordance with US GAAP or intended to be considered in isolation or as a substitute for the financial information prepared and presented in accordance with US GAAP; the non-GAAP measures should be reviewed together with the US GAAP measures, and may be different from non-GAAP measures used by other companies.
The Company uses EBITDA, which represents earnings before interest, taxes, depreciation and amortization, and EBITDA margin, which represents the proportion of EBITDA in revenues. Adjusted net income attributable to Daqo New Energy Corp. shareholders and adjusted earnings per basic and diluted ADS exclude costs related to share-based compensation. Share-based compensation is a non-cash expense that varies from period to period. As a result, our management excludes this item from our internal operating forecasts and models. Our management believes that this adjustment for share-based compensation provides investors with a basis to measure the Company’s core performance, including compared with the performance of other companies, without the period-to-period variability created by share-based compensation.
A reconciliation of non-GAAP financial measures to comparable US GAAP measures is presented later in this document.
Conference Call
The Company has scheduled a conference call to discuss the results at 8:00 AM U.S. Eastern Time on Wednesday, April 29, 2026 (8:00 PM Beijing / Hong Kong time on the same day).
The dial-in details for the earnings conference call are as follows:
Participant dial in (U.S. toll free): +1-888-346-8982
Participant international dial in: +1-412-902-4272
China mainland toll free: 4001-201203
Hong Kong toll free: 800-905945
Hong Kong local toll: +852-301-84992
Please dial in 10 minutes before the call is scheduled to begin and ask to join the Daqo New Energy Corp. call.
Webcast link:
https://event.choruscall.com/mediaframe/webcast.html?webcastid=iLpvzzAF
A replay of the call will be available 1 hour after the conclusion of the conference call through May 6, 2026. The dial-in details for the conference call replay are as follows:
U.S. toll free: +1-877-344-7529
International toll: +1-412-317-0088
Canada toll free: 855-669-9658
Replay access code: 7616875
To access the replay through an international dial-in number, please select the link below.
https://services.choruscall.com/ccforms/replay.html
Participants will be asked to provide their name and company name upon entering the call.
About Daqo New Energy Corp.
Daqo New Energy Corp. (NYSE: DQ) (“Daqo” or the “Company”) is a leading manufacturer of high-purity polysilicon for the global solar PV industry. Founded in 2007, the Company manufactures and sells high-purity polysilicon to photovoltaic product manufacturers, who further process the polysilicon into ingots, wafers, cells and modules for solar power solutions. The Company has a total polysilicon nameplate capacity of 305,000 metric tons and is one of the world’s lowest cost producers of high-purity polysilicon.
Safe Harbor Statement
This announcement contains forward-looking statements. These statements are made under the “safe harbor” provisions of the U.S. Private Securities Litigation Reform Act of 1995. These forward-looking statements can be identified by terminology such as “will,” “expects,” “anticipates,” “future,” “intends,” “plans,” “believes,” “estimates,” “guidance” and similar statements. Among other things, the outlook for the second quarter and the full year of 2026 and quotations from management in these announcements, as well as Daqo New Energy’s strategic and operational plans, contain forward-looking statements. The Company may also make written or oral forward-looking statements in its reports filed or furnished to the U.S. Securities and Exchange Commission, in its annual reports to shareholders, in press releases and other written materials and in oral statements made by its officers, directors or employees to third parties. Statements that are not historical facts, including statements about the Company’s beliefs and expectations, are forward-looking statements. Forward-looking statements involve inherent risks and uncertainties, all of which are difficult or impossible to predict accurately and many of which are beyond the Company’s control. A number of factors could cause actual results to differ materially from those contained in any forward-looking statement, including but not limited to the following: the demand for photovoltaic products and the development of photovoltaic technologies; global supply and demand for polysilicon; alternative technologies in cell manufacturing; the Company’s ability to significantly expand its polysilicon production capacity and output; the reduction in or elimination of government subsidies and economic incentives for solar energy applications; the Company’s ability to lower its production costs; and changes in political and regulatory environment. Further information regarding these and other risks is included in the reports or documents the Company has filed with, or furnished to, the U.S. Securities and Exchange Commission. All information provided in this press release is as of the date hereof, and the Company undertakes no duty to update such information or any forward-looking statement, except as required under applicable law.
|
Daqo New Energy Corp. |
|||||||
|
Unaudited Condensed Consolidated Statements of Operations |
|||||||
|
(US dollars in thousands, except ADS and per ADS data) |
|||||||
|
Three months Ended |
|||||||
|
Mar. 31, |
Dec. 31, |
Mar. 31, |
|||||
|
Revenues |
26,722 |
221,711 |
123,914 |
||||
|
Cost of revenues |
(166,088) |
(206,272) |
(205,449) |
||||
|
Gross (loss)/profit |
(139,366) |
15,439 |
(81,535) |
||||
|
Operating expenses |
|||||||
|
Selling, general and administrative expenses |
(12,163) |
(18,730) |
(35,085) |
||||
|
Allowance for expected credit loss |
– |
(19,294) |
– |
||||
|
Research and development expenses |
(783) |
(722) |
(507) |
||||
|
Other operating income |
1,500 |
2,418 |
3,074 |
||||
|
Total operating expenses |
(11,446) |
(36,328) |
(32,518) |
||||
|
Loss from operations |
(150,812) |
(20,889) |
(114,053) |
||||
|
Interest income, net |
2,516 |
1,821 |
2,670 |
||||
|
Foreign exchange (loss)/gain |
(2) |
3 |
22 |
||||
|
Investments income |
4,987 |
5,658 |
6,354 |
||||
|
Loss before income taxes |
(143,311) |
(13,407) |
(105,007) |
||||
|
Income tax benefit |
21,644 |
3,546 |
12,274 |
||||
|
Net loss |
(121,667) |
(9,861) |
(92,733) |
||||
|
Net loss attributable to non-controlling interest |
(33,292) |
(2,581) |
(20,896) |
||||
|
Net loss attributable to Daqo New Energy Corp. |
(88,375) |
(7,280) |
(71,837) |
||||
|
Loss per ADS |
|||||||
|
Basic |
(1.31) |
(0.11) |
(1.07) |
||||
|
Diluted |
(1.31) |
(0.11) |
(1.07) |
||||
|
Weighted average ADS outstanding |
|||||||
|
Basic |
67,666,301 |
67,666,301 |
66,938,183 |
||||
|
Diluted |
67,666,301 |
67,666,301 |
66,938,183 |
||||
|
Daqo New Energy Corp. |
|||||||
|
Unaudited Condensed Consolidated Balance Sheets |
|||||||
|
(US dollars in thousands) |
|||||||
|
Mar. 31, 2026 |
Dec. 31, 2025 |
Mar. 31, 2025 |
|||||
|
ASSETS: |
|||||||
|
Current Assets: |
|||||||
|
Cash, cash equivalents and restricted cash |
559,421 |
980,292 |
791,930 |
||||
|
Short-term investments |
288,279 |
113,979 |
168,203 |
||||
|
Accounts and notes receivable |
20,779 |
135,518 |
62,818 |
||||
|
Inventories |
258,284 |
169,103 |
125,918 |
||||
|
Fixed term deposit within one year |
1,018,832 |
972,358 |
1,125,323 |
||||
|
Other current assets |
365,917 |
321,138 |
303,156 |
||||
|
Held-to-Maturity Investments |
50,333 |
– |
– |
||||
|
Total current assets |
2,561,845 |
2,692,388 |
2,577,348 |
||||
|
Property, plant and equipment, net |
3,396,463 |
3,399,055 |
3,460,203 |
||||
|
Prepaid land use right |
157,388 |
155,576 |
152,854 |
||||
|
Fixed term deposit over one year |
64,587 |
63,212 |
– |
||||
|
Other non-current assets |
158,994 |
135,305 |
120,281 |
||||
|
TOTAL ASSETS |
6,339,277 |
6,445,536 |
6,310,686 |
||||
|
Current liabilities: |
|||||||
|
Accounts payable and notes payable |
118,895 |
129,663 |
28,694 |
||||
|
Advances from customers – short term portion |
23,543 |
45,433 |
33,032 |
||||
|
Payables for purchases of property, plant and equipment |
251,216 |
278,957 |
357,562 |
||||
|
Other current liabilities |
32,084 |
43,780 |
39,471 |
||||
|
Total current liabilities |
425,738 |
497,833 |
458,759 |
||||
|
Advance from customers – long term portion |
5,511 |
13,208 |
20,967 |
||||
|
Other non-current liabilities |
18,329 |
18,180 |
17,610 |
||||
|
TOTAL LIABILITIES |
449,578 |
529,221 |
497,336 |
||||
|
EQUITY: |
|||||||
|
Total Daqo New Energy Corp.’s shareholders’ |
4,392,608 |
4,406,727 |
4,329,201 |
||||
|
Non-controlling interest |
1,497,091 |
1,509,588 |
1,484,149 |
||||
|
Total equity |
5,889,699 |
5,916,315 |
5,813,350 |
||||
|
TOTAL LIABILITIES & EQUITY |
6,339,277 |
6,445,536 |
6,310,686 |
||||
|
Daqo New Energy Corp. |
|||||
|
Unaudited Condensed Consolidated Statements of Cash Flows |
|||||
|
(US dollars in thousands) |
|||||
|
For the three months ended March 31, |
|||||
|
2026 |
2025 |
||||
|
Operating Activities: |
|||||
|
Net loss |
(121,667) |
(92,733) |
|||
|
Adjustments to reconcile net income to net cash provided by |
160,069 |
123,788 |
|||
|
Changes in operating assets and liabilities |
(185,914) |
(69,936) |
|||
|
Net cash used in operating activities |
(147,512) |
(38,881) |
|||
|
Investing activities: |
|||||
|
Purchases of property, plant and equipment |
(28,691) |
(57,632) |
|||
|
Purchase of investments |
(474,635) |
(1,014,899) |
|||
|
Redemption of short-term investments and fixed term deposits |
227,559 |
861,517 |
|||
|
Net cash used in investing activities |
(275,767) |
(211,014) |
|||
|
Financing activities: |
|||||
|
Net cash used in financing activities |
(7,790) |
– |
|||
|
Effect of exchange rate changes |
10,198 |
3,476 |
|||
|
Net decrease in cash, cash equivalents and restricted cash |
(420,871) |
(246,419) |
|||
|
Cash, cash equivalents and restricted cash at the beginning of the |
980,292 |
1,038,349 |
|||
|
Cash, cash equivalents and restricted cash at the end of the year |
559,421 |
791,930 |
|||
|
Daqo New Energy Corp. |
|||||||
|
Reconciliation of non-GAAP financial measures to comparable US GAAP measures |
|||||||
|
(US dollars in thousands) |
|||||||
|
Three months Ended |
|||||||
|
Mar. 31, 2026 |
Dec. 31, 2025 |
Mar. 31, 2025 |
|||||
|
Net loss |
(121,667) |
(9,861) |
(92,733) |
||||
|
Income tax benefit |
(21,644) |
(3,546) |
(12,274) |
||||
|
Interest income, net |
(2,516) |
(1,821) |
(2,670) |
||||
|
Depreciation & amortization |
62,705 |
67,776 |
59,245 |
||||
|
EBITDA (non-GAAP) |
(83,122) |
52,548 |
(48,432) |
||||
|
EBITDA margin (non-GAAP) |
(311.1) % |
23.7 % |
-39.1 % |
||||
|
Three months Ended |
|||||||
|
Mar. 31, 2026 |
Dec. 31, 2025 |
Mar. 31, 2025 |
|||||
|
Net loss attributable to Daqo New Energy |
(88,375) |
(7,280) |
(71,837) |
||||
|
Share-based compensation |
– |
– |
18,606 |
||||
|
Adjusted net loss attributable to Daqo New |
(88,375) |
(7,280) |
(53,231) |
||||
|
Adjusted loss per basic ADS (non-GAAP) |
(1.31) |
(0.11) |
(0.80) |
||||
|
Adjusted loss per diluted ADS (non-GAAP) |
(1.31) |
(0.11) |
(0.80) |
||||
Dead Fish in Xe Don River Spark Questions Over Official Investigation
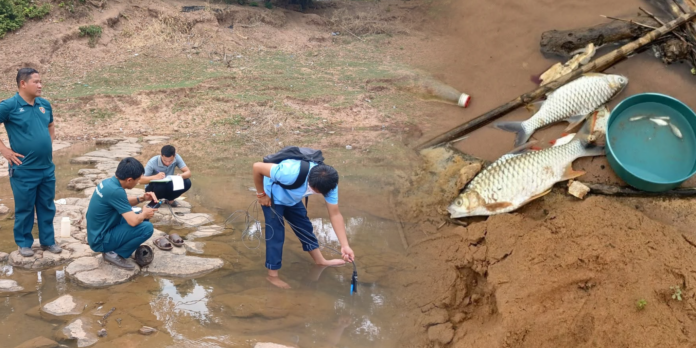
Authorities in Salavanh province have attributed the mass death of fish along the Xe Don River to extreme heat, but the explanation has drawn public skepticism and raised concerns about possible pollution.
Residents first reported dead fish floating along the riverbank in Khongxedon district on 23 April, accompanied by a strong odor and fears over water safety.
On 28 April, officials from the Livestock and Fisheries Sector conducted on-site inspections across multiple villages in Khongxedon and Salavanh districts. Head of the sector Phetnykone Sinthasack announced that water quality tests found no signs of pollution or toxic wastewater.
According to the Salavanh authorities, test results showed pH levels between 7.8 and 8.06 and dissolved oxygen levels between 6.8 and 7.12, both within safe ranges for aquatic life. However, water temperatures reached 32.1 degree Celsius, above seasonal norms and potentially harmful to heat-sensitive fish species.
Authorities emphasized that the heat is linked to El Niño, a natural climate pattern caused by warmer Pacific Ocean temperatures that can bring hotter and drier weather to parts of Southeast Asia, according to the World Health Organization.
Therefore, environmental officials believed the combination of hotter water and reduced water-flow likely placed stress on fish, especially species less tolerant of heat.
Officials also noted that illegal fishing methods, including electric shock devices, may have contributed to fish deaths in some locations.
Public Questions Official Explanation as Concerns Grow
The official conclusion has triggered skepticism online, with many residents calling for a deeper and more transparent investigation.
One commenter wrote, “If fish died because of hot weather, then fish across the whole country should be dying,” reflecting doubts that temperature alone could explain the incident.
Another said, “The water looks polluted just by seeing the surface,” suggesting that contamination could be a cause rather than the heat.
Beyond that, some also pointed to nearby plantations and factories as possible sources of the incident. The comments show wider public concern over water safety and environmental monitoring.
