Home Blog Page 46

Lao Bullion Bank Joins Japan Bullion Market Association

A picture of Lao Bullion Bank officials receiving Japan Bullion Market Association membership. (Photo by LBB)

On 4 November, Lao Bullion Bank (LBB) has joined the Japan Bullion Market Association (JBMA), connecting the Lao bank with an international network of precious metals market participants and standards.

The membership shows LBB’s efforts to align its operations with international practices in transparency, governance, operational standards, and market integrity.

Through its membership, LBB plans to exchange market information and industry knowledge, strengthen cooperation with participants in Japan and international bullion markets, and support greater regional connectivity and efficiency in the precious metals sector.

One potential area of cooperation is the market for high-purity 5N gold, which has a purity of 99.999 percent and is used in semiconductor manufacturing and electronic equipment.

Building relationships with industry participants in Japan could help LBB better understand market requirements, identify potential partners, and explore business opportunities in the semiconductor and precious metals supply chains.

LBB said it will continue developing bullion-related products and services while seeking to create long-term value for customers, investors, and other stakeholders, and contribute to the sustainable growth and international integration of Laos’ bullion market.

Cheche Group Announces Extraordinary General Meeting

BEIJING, Nov. 6, 2026 /PRNewswire/ — Cheche Group Inc. (NASDAQ: CCG) (“Cheche” or the “Company”), China’s leading auto insurance technology platform, today announced that an extraordinary general meeting of the Company (the “Meeting”) will be held at 10 A.M. on November 25, 2026, Beijing time (9 P.M. on November 24, 2026, U.S. Eastern time) at 8/F, Desheng Hopson Fortune Plaza, 13-1 Deshengmenwai Avenue, Xicheng District, Beijing 100088, China. The Company has established the close of business on November 5, 2026, Eastern time (the “Record Date”), as the record date for determining shareholders entitled to notice of, and to vote at, the Meeting and any adjournments or postponements thereof. The purpose of the Meeting includes, among others:

(1) to approve by ordinary resolution the creation of a new class of ordinary shares of the Company designated as class C ordinary shares, each with a par value of US$0.00035 (the “Class C Ordinary Shares”), with the rights and restrictions set forth in the proposed third amended and restated memorandum and articles of association of the Company (the “New M&A”), including 300 votes per Class C Ordinary Share;

(2) to approve by ordinary resolution that the authorized share capital of the Company be amended:

(i) FROM: US$50,000 divided into 142,857,143 shares comprising (i) 114,285,714 class A ordinary shares of a par value of US$0.00035 each, and (ii) 28,571,429 class B ordinary shares of a par value of US$0.00035 each,

(ii) TO: US$50,000 divided into 142,857,143 shares comprising (i) 114,285,714 class A ordinary shares of a par value of US$0.00035 each; (ii) 18,571,429 class B ordinary shares of a par value of US$0.00035 each; and (iii) 10,000,000 class C ordinary shares of a par value of US$0.00035 each;

(3) to approve by ordinary resolution that 10,000,000 authorized but unissued class B ordinary shares of the Company of a par value of US$0.00035 each be re-classified as 10,000,000 class C ordinary shares of the Company of a par value of US$0.00035 each with the rights attached to it in the New M&A; and

(4) to approve by special resolution the amendment and restatement of the Company’s second amended and restated memorandum and articles of association currently in effect (the “Current M&A”) be replaced in their entirety with the New M&A to provide for, among other things, the creation and rights of the Class C Ordinary Shares.

Copies of the notice of the Meeting and the form of proxy are available on the Company’s corporate investor relations website at https://ir.chechegroup.com/.

Safe Harbor Statements

This press release includes “forward-looking statements” within the meaning of the “safe harbor” provisions of the United States Private Securities Litigation Reform Act of 1995. Forward-looking statements may be identified by the use of words such as “estimate,” “plan,” “project,” “forecast,” “intend,” “will,” “expect,” “anticipate,” “believe,” “seek,” “target” or other similar expressions that predict or indicate future events or trends or that are not statements of historical matters. These forward-looking statements also include, but are not limited to, statements regarding existing and new partnerships and customer relationships, projections, estimation, and forecasts of revenue and other financial and performance metrics, projections of market opportunity and expectations, the Company’s ability to scale and grow its business, the Company’s advantages and expected growth, and its ability to source and retain talent, as applicable. These statements are based on various assumptions, whether or not identified in this press release, and on the current expectations of the Company’s management and are not predictions of actual performance. These statements involve risks, uncertainties, and other factors that may cause the Company’s actual results, levels of activity, performance, or achievements to materially differ from those expressed or implied by these forward-looking statements. Further information regarding these and other risks, uncertainties, or factors is included in the Company’s filings with the U.S. Securities and Exchange Commission. Although the Company believes that it has a reasonable basis for each forward-looking statement contained in this press release, the Company cautions you that these statements are based on a combination of facts and factors currently known and projections of the future, which are inherently uncertain. The forward-looking statements in this press release represent the views of the Company as of the date of this press release. Subsequent events and developments may cause those views to change. Except as may be required by law, the Company does not undertake any duty to update these forward-looking statements.

About Cheche Group Inc.

Established in 2014 and headquartered in Beijing, China, Cheche is a leading auto insurance technology platform with a nationwide network of around 108 branches licensed to distribute insurance policies across 25 provinces, autonomous regions, and municipalities in China. Capitalizing on its leading position in auto insurance transaction services, Cheche has evolved into a comprehensive, data-driven technology platform that offers a full suite of services and products for digital insurance transactions and insurance SaaS solutions in China. Learn more at https://www.chechegroup.com/en.

Cheche Group Inc.:
IR@chechegroup.com

Crocker Coulson
crocker.coulson@aumadvisors.com
(646) 652-7185

STAK Inc. Discloses Initial Progress in Gas-Powered Generator Business

CHANGZHOU, China, Nov. 6, 2026 /PRNewswire/ — STAK Inc. (the “Company”) (Nasdaq: STAK), a fast-growing company specializing in the research, development, manufacturing, and sale of oilfield-specialized production and maintenance equipment, today announced that its second-tier subsidiary, STAK Industry Energy Ltd., has entered into a non-binding letter of intent (the “LOI”) regarding the potential procurement of gas-powered generators. The LOI represents an initial development in the Company’s recent expansion into the gas-powered generator business.

The indicative value of the initial proposed procurement under the LOI is in the hundreds of thousands of U.S. dollars, with additional potential procurements contemplated in subsequent phases totaling millions of U.S. dollars, excluding the initial procurement amount. These indicative amounts are calculated on an ex-works (EXW) basis and exclude transportation, insurance, on-site installation, and other ancillary costs, which would be quoted separately. The proposed amounts are preliminary and non-binding and do not constitute confirmed orders, minimum purchase commitments, or revenue forecasts.

The proposed subsequent procurements are contingent upon the successful delivery and final acceptance of the initial batch of equipment. Each subsequent batch would require a separate formal purchase contract between the relevant parties. Acceptance of the initial batch would not automatically obligate the potential buyer to proceed with any subsequent purchases. Final transaction values, pricing, and execution arrangements would be subject to further negotiations and the execution of applicable purchase contracts.

For clarity, the proposed procurements contemplated under the LOI are non-binding and do not constitute formal purchase orders or create any obligation on the part of the potential buyer to purchase, or the Company to supply any equipment. Any actual procurement would be subject to the execution of a definitive purchase contract. While certain ancillary provisions of the LOI are binding as of its effective date, such provisions do not constitute a purchase commitment.

The Company cannot assure that the relevant parties will enter into formal purchase contracts, that any proposed transactions will be completed, or that any revenue will ultimately be generated. Accordingly, receipt of the LOI does not constitute a completed sale or provide a basis for revenue recognition. Any potential transaction remains subject to agreement on final commercial terms and satisfaction of applicable technical, certification, and other requirements.

To protect commercially sensitive information, the Company is not disclosing the identity of the potential buyer or specific commercial and technical terms beyond the indicative procurement amounts described above. The Company will provide further updates and disclosures as appropriate and in accordance with applicable laws and stock exchange regulations.

Incorporated in Texas, the United States, in September 2026, STAK Industry Energy Ltd. is wholly owned by STAK Vision Energy Inc., a joint venture in which STAK Vision Ltd., a wholly owned subsidiary of STAK, holds a 60% equity interest.

About STAK Inc.

STAK Inc. is a fast-growing company specializing in the research, development, manufacturing, and sale of oilfield-specific production and maintenance equipment. The Company designs and manufactures oilfield-specialized production and maintenance equipment, then collaborates with qualified specialized vehicle manufacturing companies to integrate the equipment onto vehicle chassis, producing specialized oilfield vehicles for sale. Additionally, the Company sells oilfield-specialized equipment components, related products, and provides automation solutions. Its vision is to help oilfield services companies reduce costs and increase efficiency by providing the cutting-edge integrated oilfield equipment and automation solutions service. Its mission is to become a powerful provider for the niche markets of specialized oilfield vehicles and equipment in China. For more information, please visit the Company’s website at https://www.stakindustry.com/ir/.

Forward-Looking Statements

Certain statements in this announcement are forward-looking statements. These forward-looking statements involve known and unknown risks and uncertainties and are based on the Company’s current expectations and projections about future events that the Company believes may affect its financial condition, results of operations, business strategy and financial needs. Investors can find many (but not all) of these statements by the use of words such as “may,” “will,” “expect,” “anticipate,” “aim,” “estimate,” “potential,” “intend,” “plan,” “believe,” “likely to” or other similar expressions in this announcement. The Company undertakes no obligation to update or revise publicly any forward-looking statements to reflect subsequent occurring events or circumstances, or changes in its expectations, except as may be required by law. Although the Company believes that the expectations expressed in these forward-looking statements are reasonable, it cannot assure you that such expectations will turn out to be correct, and the Company cautions investors that actual results may differ materially from the anticipated results and encourages investors to review other factors that may affect its future results in the Company’s registration statement and other filings with the U.S. Securities and Exchange Commission (the “Commission”).

For more information, please contact:

STAK Inc.
Investor Relations Department
Email: ir@stakindustry.com

Ascent Investor Relations LLC
Tina Xiao
Phone: +1-646-932-7242
Email: investors@ascent-ir.com

Quantinuum Reports Third Quarter 2026 Results and Raises Full-Year Revenue Outlook

  • Third-Quarter Revenue Grew 233% Year-Over-Year; Raised FY2026 Revenue Outlook
  • Extended Fault-Tolerance Industry Leadership with Back-to-Back World Records, Validating Most Credible Path to Universal, Fault-Tolerant Quantum Computing
  • Announced Nexus Roadmap Through Apollo; Platform Adoption Grew Nearly 20% Quarter-Over-Quarter and Job Submissions Increased Tenfold Year-Over-Year for the 12 Months Ended August 2026
  • Secured Largest Cloud Agreement in Company History, Including Multi-Year Committed Full-Stack Access Through Apollo
  • Expanded Enterprise Reach Through Leading Hyperscaler Agreement and Oracle Beta Launch

BROOMFIELD, Colo., Nov. 6, 2026 /PRNewswire/ — Quantinuum Inc. (Nasdaq: QNT) (the “Company”), a leading full-stack quantum computing company, today announced financial results for the third quarter ended September 30, 2026.

“In the third-quarter, we extended our technology leadership in the critical area of fault-tolerance, added to our customer base, and expanded our routes to market,” said Rajeeb Hazra, President and Chief Executive Officer of Quantinuum. “This accelerated momentum is supporting our raised revenue outlook for 2026 and giving us more confidence than ever in the opportunity in front of us.”

Third Quarter 2026 Financial Highlights

  • Revenue was $9.1 million, an increase of 233% year-over-year, compared with $2.7 million in the prior-year period.
  • GAAP gross margin was 33.3%, compared with (43.5%) the prior-year period.
  • Adjusted gross margin was 74.6%, up 853 basis points versus the prior-year period.
  • Adjusted EBITDA loss was $80 million, compared with a loss of $45 million in the prior-year period.
  • GAAP net loss was $118 million, compared with a net loss of $52 million in the prior-year period.
  • GAAP net loss per share attributable to Class A common stockholders was $0.46.
  • Adjusted net loss per share was $0.29.
  • Cash & cash equivalents were $1.94 billion as of September 30, 2026.

Adjusted EBITDA, Adjusted Gross Margin and Adjusted net loss per share are non-GAAP financial measures defined under “Non-GAAP Financial Measures.” For a reconciliation of these non-GAAP financial measures to the most directly comparable GAAP financial measures, refer to the Appendix tables at the end of this press release.

Third Quarter and Recent Business Highlights

Commercial Highlights:

  • Signed the largest cloud agreement in Company history, securing a multi-year extension with a leading global financial institution that includes committed access through Apollo and Nexus.
  • Signed with another top 5 global pharmaceuticals company on applying quantum computing and AI to cancer-therapy materials that offer the potential to accelerate drug development and enable more effective treatments. 
  • Signed agreement with GE Vernova to advance application development in superconducting materials.
  • Signed deal with Abu Dhabi Maritime Academy and Quincus for research and applications in maritime logistics.
  • Expanded cloud distribution through a new agreement with a leading hyperscaler serving millions of developers and advanced Oracle partnership by launching a joint beta program for hybrid quantum-AI applications.
  • Deepened U.S. government commitments by continuing to execute on DARPA QBI Stage B contract, actively discussing a Stage C scope of work, and participating in four winning proposals under Phase 1 of the Department of Energy’s Genesis Mission
  • Advanced international deployments, with Helios assembly underway in Singapore ahead of spring 2027 commissioning and a Reimei system upgrade at RIKEN in Japan scheduled for completion this month.

Product Technology & Supply Chain:

  • Validated the Company’s leading path to universal, fully fault-tolerant quantum computing by 2029 with back-to-back accuracy world records on Helios using two codes within the same scalable, end-to-end logical architecture. Reached 99.9995% logical fidelity in October—within Apollo’s target range—with an error rate ten times lower than September’s record and 100 times lower than the best published result across other hardware modalities. Results also demonstrate Quantinuum’s significant overhead and scalability advantage.
  • Sol remains on track for 2H 2027, with full-scale control-system validation complete and integration and assembly targeted for Q1 2027, ahead of validation and tuning toward 100 logical qubits at a target logical error rate of 10⁻⁵.
  • Apollo remains on track for 2029, supported by design milestones, including validating that our cryogenic system can be deployed at the required scale.
  • Strengthened the manufacturing foundation for future systems through partnerships with GlobalFoundries, Infineon, Honeywell Aerospace and Monarch Quantum, and finalized the CHIPS R&D award as the only trapped-ion company selected.

Software:

  • Announced a multi-generational Nexus roadmap through Apollo, aligning application development and hybrid deployment with successive hardware generations to build what the Company believes will be the first developer platform designed for the fault-tolerant era.
  • Expanded fault-tolerant capabilities through a September Nexus release that extends Guppy tools for logical-qubit programming and supported error-correction encoding, reducing the need to rewrite applications for specific codes. Planned December release will expand responsive hybrid quantum-classical workflows, supported error-correction codes, and execution analytics for application optimization.
  • Accelerated Nexus adoption and usage, with adoption growing nearly 20% quarter-over-quarter to 215 organizations; total job submissions increased tenfold in the 12 months through August 2026 compared with the preceding 12-month period.

Ecosystem: 

  • Introduced QUOPS with Sandia National Laboratories and NVIDIA, benchmarking useful computational scale and speed. Quantinuum is building industry-wide alignment toward a common standard that supports customer comparisons and purchasing decisions.
  • Expanded the quantum user ecosystem, growing Q-Net to more than 800 members, adding eight startup partners and partnering with Singapore’s National Quantum Office to organize a global quantum challenge that attracted more than 200 submissions.

Financial Outlook

  • Raising full-year 2026 revenue outlook to $31 to $34 million, up from $28 to $32 million previously.

Third Quarter 2026 Conference Call
Quantinuum will host a conference call at 5 PM Eastern time on Thursday, November 5, 2026, to discuss its results for the third quarter ended September 30, 2026, and provide a business update. The call will be available live via webcast here.

An archive replay of the webcast will be made available on the Quantinuum Investor Relations website following the call and will remain available for one year.

Non-GAAP Financial Measures
To supplement Quantinuum’s condensed consolidated financial statements presented in accordance with U.S. generally accepted accounting principles (“GAAP”), the Company uses the following non-GAAP financial measures presented in this release: Adjusted Gross Profit, Adjusted Gross Margin, Adjusted Net Loss, fully distributed, Adjusted EBITDA, and Adjusted Net Loss Per Share, fully distributed.

Adjusted Gross Profit starts with GAAP gross profit and adds back equity compensation and related employer taxes attributable to cost of revenue and depreciation and amortization attributable to cost of revenue.

Adjusted Gross Margin is calculated as Adjusted Gross Profit divided by revenue, net.

Adjusted Net Loss, fully distributed starts with GAAP net loss on an as-converted basis, adjusts for equity compensation and related employer taxes, costs of the initial public offering and the transition to public company reporting, severance expense, the change in fair value of liability-classified warrants, and loss on disposal and write down of assets, and then applies an assumed statutory tax rate to the resulting adjusted pre-tax loss. No tax benefit is recognized in respect of losses subject to a full valuation allowance, and accordingly no tax benefit is reflected in the periods presented.

Adjusted EBITDA starts with Adjusted Net Loss, fully distributed, and further excludes income tax expense, interest income, net, depreciation, and amortization of acquired intangibles.

Adjusted Net Loss Per Share, fully distributed is calculated as Adjusted Net Loss, fully distributed, divided by adjusted shares, fully distributed, basic and diluted, comprising weighted-average Class A common shares outstanding and Common Units of Quantinuum Holdings.

Management believes these measures provide investors with additional information useful in evaluating the Company’s operating performance and trends across periods. Quantinuum’s results include large non-cash charges that management does not consider indicative of ongoing operating performance, principally stock-based compensation recognized on completion of the Reorganization and remeasurement of liability-classified warrants. Both are driven by accounting triggers and external inputs rather than operating activity. As an early commercial-stage business, Quantinuum’s period-to-period results also are affected by the timing of individual contracts. Measures that isolate underlying operating performance from non-cash and transition items help investors assess trends across periods.

Quantinuum’s Up-C structure means that GAAP net loss attributable to Quantinuum Inc. reflects only the Class A share of the economics. Presenting adjusted results on an as-converted, fully distributed basis describes the whole economic enterprise, which is how management assesses performance and how the business is managed. Management uses these measures for internal planning and forecasting, evaluating operating performance, and preparing budgets.

These non-GAAP financial measures are supplemental and are not prepared in accordance with GAAP. They are not intended to be considered in isolation or as a substitute for the most directly comparable financial information prepared in accordance with GAAP. Quantinuum’s non-GAAP measures may differ from similarly titled measures used by other companies and, therefore, may not be comparable. Investors should review the reconciliations and should not rely on any single financial measure to evaluate the Company’s business.

Each non-GAAP financial measure is reconciled to its most directly comparable GAAP financial measure in the tables at the end of this release.

About Quantinuum
Quantinuum is a leading quantum computing company offering a full-stack platform designed to make quantum computing deployable in real-world environments. The company has commercially deployed multiple generations of trapped-ion based quantum systems built on the well-established QCCD architecture, which it has implemented with novel designs and capabilities to achieve the industry’s highest accuracy levels based on average two-qubit gate fidelity. Quantinuum has active engagements with market leaders across pharmaceuticals, material science, financial services, and government and industrial markets, as well as academic and research institutions globally.

The company has a global workforce of approximately over 850 employees, including top scientists and researchers. Over 70% of its technology team holds PhDs or Master’s degrees. Quantinuum’s headquarters is in Broomfield, Colorado, with additional facilities across the United States, United Kingdom, Germany, Japan, Qatar, and Singapore.

Availability of Information on Quantinuum’s Website
Investors and others should note that Quantinuum routinely announces material information to investors and the marketplace using SEC filings, press releases, public conference calls, webcasts, and the Quantinuum Investor Relations website. While not all of the information that the Company posts to the Quantinuum Investor Relations website is of a material nature, some information could be deemed to be material. Accordingly, the Company encourages investors, the media, and others interested in Quantinuum to review the information that it shares on ir.quantinuum.com.

Forward-Looking Statements
This press release contains forward-looking statements within the meaning of the Private Securities Litigation Reform Act of 1995. These statements are based on the current beliefs and expectations of Quantinuum’s management and are subject to significant risks and uncertainties. Actual results may differ materially from those described in the forward-looking statements. Any statements made in this press release that are not statements of historical fact, including statements about our beliefs, expectations and outlook are forward-looking statements. Forward-looking statements include information concerning possible or assumed future results of operations, including our guidance and descriptions of our business plans and strategies. These statements often include words such as “anticipate,” “expect,” “guidance,” “suggest,” “plan,” “believe,” “intend,” “estimate,” “target,” “project,” “should,” “could,” “would,” “may,” “will,” “forecast,” “outlook,” “potential,” “continues,” “seeks,” “predicts,” or the negatives of these words and other similar expressions.

Factors that could cause actual results to differ materially from those described in forward-looking statements include, but are not limited to: our ability to develop, commercialize and achieve market acceptance of our quantum computing hardware and software products; the pace of development of the quantum computing industry and the timing of commercial quantum advantage; our ability to attract and retain customers for our quantum computing systems and quantum computing as a service offerings; the risk of technological obsolescence or the emergence of competing quantum computing approaches, including superconducting, photonic, or other modalities; our dependence on key suppliers and manufacturers of specialized components, including those necessary for our trapped-ion quantum systems; our ability to scale production of our quantum computers and related systems; our ability to protect our intellectual property and proprietary technology; the significant research and development costs inherent in developing next-generation quantum computing capabilities; our ability to attract and retain highly skilled scientists, engineers and other personnel in a competitive labor market; changes in government funding, export controls, or regulations affecting quantum technologies; uncertainty regarding the timing and extent of commercial applications; cybersecurity risks and the protection of sensitive customer data; and macroeconomic conditions, geopolitical instability and their potential effects on our business and operations. For additional information on these and other risks that could affect the Company’s forward-looking statements, see the Company’s risk factors discussed in its filings with the U.S. Securities and Exchange Commission, including its most recent Quarterly Report on Form 10-Q, as such risk factors may be updated from time to time. You should evaluate all forward-looking statements made in this press release in the context of these risks and uncertainties. The Company disclaims any intent or obligation to update, revise or withdraw any forward-looking statement in this press release, except as required by applicable law or regulation.

Contacts

Investor & Media Contact
Shub Mukherjee – Investor Contact – investors@quantinuum.com
Aaron Sorenson – Media Contact – press@quantinuum.com

Appendix


Condensed Consolidated Statements of Operations (Unaudited)

(dollars in thousands, except share and per share data)

Amounts may not sum due to rounding.

Three Months Ended September 30,

Nine Months Ended September 30,

2026

2025

2026

2025

Revenue—net

9,050

2,715

22,285

23,908

Costs and expenses:

Cost of revenue

3,194

1,058

14,618

3,728

Amortization expense

4,184

2,839

12,554

8,517

Research and development expenses—net

97,482

42,382

519,433

117,822

Sales and marketing expenses

14,856

3,977

57,920

10,779

General and administrative expenses

22,149

5,334

182,752

16,903

Total costs and expenses

141,865

55,590

787,277

157,749

Loss from operations

(132,815)

(52,875)

(764,992)

(133,841)

Interest income—net

(14,324)

(3,072)

(23,807)

(5,415)

Loss on change in fair value of warrant
liabilities

—

2,100

111,815

9,900

Other (income)/expense—net

(283)

3

(2,296)

803

Loss before taxes

(118,208)

(51,906)

(850,704)

(139,129)

Tax (benefit)/expense

(357)

130

260

313

Net loss

(117,851)

(52,036)

(850,964)

(139,442)

Less: Net loss attributable to Quantinuum
(Cayman) prior to the Transactions

—

N/A

(246,680)

N/A

Less: Net loss attributable to the non-
controlling interest

(100,899)

N/A

(521,914)

N/A

Net loss attributable to Quantinuum Inc.

(16,952)

N/A

(82,370)

N/A

Net loss per share attributable to Class A
common stockholders—basic and diluted¹

(0.46)

N/A

(2.27)

N/A

Weighted-average shares used in computing net
loss per share attributable to Class A common
stockholders—basic and diluted¹

36,806,913

N/A

36,216,440

N/A

(1) For the nine months ended September 30, 2026, net loss per share of Class A common stock and weighted-average shares of Class A common stock are presented for the period during the Transactions through September 30, 2026, which is the period effective with and following the Transactions as defined in Note 1 — Description of Organization found in the June 30, 2026 form 10-Q.


Condensed Consolidated Balance Sheets (Unaudited)

(dollars in thousands)

September 30, 2026

December 31, 2025

Assets

Current assets:

Cash and cash equivalents

1,936,114

762,642

Accounts receivable

3,254

5,068

Due from related parties

336

604

Inventories

8,057

—

Net investment in lease, current

5,773

5,773

      Other current assets

39,894

27,754

Total current assets

1,993,428

801,841

Property and equipment—net

162,598

120,965

Right-of-use assets

30,171

10,000

Goodwill

771,506

784,822

Other intangible assets—net

101,027

114,282

Net investment in lease, non-current

5,773

10,102

Other assets—net

20,373

3,613

Total assets

3,084,876

1,845,625

Liabilities

Current liabilities:

Accounts payable

19,478

10,620

Due to related parties

—

1,273

Accrued liabilities

60,475

44,358

Total current liabilities

79,953

56,251

Warrant liability

—

38,400

License payable, non-current portion

55,345

55,345

Operating lease liabilities, non-current

29,137

7,143

Other liabilities

605

893

Temporary equity

Series A convertible redeemable preferred stock, $0.0001 par value per share; 31,983,034
shares authorized as of December 31, 2025; 23,119,001 shares issued and outstanding as of
December 31, 2025; liquidation preference of $423,540 as of December 31, 2025

—

288,129

Series A-1 convertible redeemable preferred stock, $0.0001 par value per share; 28,016,966
shares authorized, issued and outstanding as of December 31, 2025; liquidation preference
of $479,930,628 as of December 31, 2025

—

400,978

Series B convertible redeemable preferred stock, $0.0001 par value per share; 31,753,266
shares authorized as of December 31, 2025; 31,336,698 shares issued and outstanding as of
December 31, 2025; liquidation preference of $878,367,645 as of December 31, 2025

—

824,834

Shareholders’ equity / Quantinuum (Cayman) equity

Quantinuum (Cayman) equity

—

173,652

Preferred stock, $0.0001 par value per share; 20,000,000 shares authorized, as of September
30, 2026; no shares issued and outstanding as of September 30, 2026

—

—

Class A common stock, $0.0001 par value per share; 2,000,000,000 shares authorized as of September
30, 2026; 43,386,129 shares issued and 43,313,266 shares outstanding as of September 30, 2026

4

—

Class B common stock, $0.0001 par value per share; 2,000,000,000 shares authorized as of
September 30, 2026; 222,338,654 shares issued and outstanding as of September 30, 2026

22

—

Class A common stock held in treasury, at cost; 72,863 shares and 0 shares as of September
30, 2026 and December 31, 2025, respectively

(3,803)

—

Additional paid-in-capital

541,704

—

Accumulated other comprehensive (loss) income

(1,466)

—

      Accumulated deficit

(82,370)

—

Total equity attributable to Quantinuum Inc. / Quantinuum (Cayman)

454,091

173,652

      Non-controlling interest

2,465,745

—

Total equity

2,919,836

173,652

Total Liabilities and equity

3,084,876

1,845,625


Condensed Consolidated Statements of Cash Flows (Unaudited)

(dollars in thousands)

Amounts may not sum due to rounding.

Nine Months Ended September 30,

2026

2025

Cash flows from operating activities:

Net loss                                                                                                                                                                                                        

(850,964)

(139,442)

Adjustments to reconcile to net cash used for operating activities

Depreciation and amortization

27,868

22,442

Noncash lease expense

4,510

1,799

Sales under sales-type lease

—

(16,526)

Stock compensation expense

484,699

—

Loss on change in fair value of warrant liabilities

111,815

9,900

(Gain)/Loss on disposal and write down of assets

(4)

909

Interest expense

5

6

Foreign exchange (gain)/loss—net

(118)

(8)

Access to quantum computing hardware

6,889

4,746

Changes in operating assets and liabilities

Accounts receivable

1,804

1,769

Due from related parties

224

424

Other current assets

(20,836)

(1,064)

Net investment in leases

4,330

4,330

Other assets—net

(16,100)

926

Accounts payable

4,864

5,718

Due to related parties

(1,126)

76

Accrued liabilities

12,481

7,052

Other liabilities

(253)

84

Net cash used for operating activities

(229,912)

(96,859)

Cash flows from investing activities:

Capital expenditures

(64,705)

(61,021)

Net cash used for investing activities

(64,705)

(61,021)

Cash flows from financing activities:

Proceeds from the issuance of preferred stock to Honeywell

—

350,000

Proceeds from issuance of Series B Convertible Preferred Stock, net of issuance costs

—

251,103

Proceeds from issuance of common stock

1,628,774

—

Common stock issuance costs

(28,844)

—

Other issuance Costs

(814)

Withholding taxes paid on stock compensation

(130,780)

—

Net cash provided by financing activities

1,468,336

601,103

Effect of exchange rate changes on cash and cash equivalents

(247)

1,589

Net increase in cash and cash equivalents

1,173,472

444,812

Cash and cash equivalents at beginning of period

762,642

172,343

Cash and cash equivalents at end of period

1,936,114

617,155

Non-cash investing and financing activities:

Unpaid purchases of property and equipment

9,094

3,913

Unpaid other issuance costs

1,774

7,263

Value of shares issued via cashless warrant exercise

150,215

—


Reconciliation of GAAP Gross Profit to Adjusted Gross Profit (Unaudited)

(dollars in thousands, except percentages)

Amounts may not sum due to rounding.

Three Months Ended September 30,

Nine Months Ended September 30,

2026

2025

2026

2025

Revenue, net

9,050

2,715

22,285

23,908

Cost of revenue

3,194

1,058

14,618

3,728

Amortization of acquired intangibles, cost of revenue portion¹

2,839

2,839

8,518

8,517

GAAP gross profit

3,017

(1,182)

(851)

11,663

GAAP gross margin

33.3 %

(43.5 %)

(3.8 %)

48.8 %

Equity compensation and related employer taxes²

748

—

7,321

—

Depreciation and amortization³

2,985

2,975

10,024

9,553

Adjusted gross profit

6,750

1,793

16,494

21,216

Adjusted gross margin

74.6 %

66.1 %

74.0 %

88.7 %

(1) Our condensed consolidated statements of operations present amortization of acquired intangibles as a single separate line and do not present a gross profit subtotal. The amount shown in this table is the portion of that line attributable to cost of revenue, allocated according to the assets to which it relates. Cost of revenue is presented as reported. The remaining portion is presented within research and development.   

(2) Represents stock-based compensation expense and the related employer payroll taxes on equity vesting, in each case attributable to cost of revenue. Employer payroll taxes were 2 and 244 for the three and nine months ended September 30, 2026, respectively, and 0 in the corresponding prior year periods. These amounts are a subset of the equity compensation and related employer taxes adjustment presented in the reconciliation of GAAP net loss.                                                               

(3) Represents depreciation of property and equipment and amortization of acquired intangible assets attributable to cost of revenue.              


Reconciliation of GAAP Net Loss to Adjusted Net Loss, Adjusted EBITDA and Adjusted Earnings Per Share (Unaudited)

(dollars in thousands, except share and per share amounts)

Amounts may not sum due to rounding.

Three Months Ended September 30,

Nine Months Ended September 30,

2026

2025

2026

2025

Numerator

Net loss attributable to Quantinuum Inc.

(16,952)

N/A

(82,370)

N/A

Net loss attributable to Quantinuum (Cayman) prior to the Transactions

—

N/A

(246,680)

N/A

Net loss attributable to the non-controlling interest

(100,899)

N/A

(521,914)

N/A

GAAP net loss, as-converted¹

(117,851)

(52,036)

(850,964)

(139,442)

Equity compensation and related employer taxes²

37,333

—

501,920

—

IPO and public company readiness, legal and other transaction costs³

4,937

—

24,738

—

Severance expense

353

—

353

—

Warrant fair value adjustment⁴

—

2,100

111,815

9,900

Loss on disposal and write down of assets

6

8

(4)

909

Adjusted net loss, fully distributed

(75,222)

(49,928)

(212,142)

(128,633)

Income tax (benefit) expense

(357)

130

260

313

     Interest income, net

(14,324)

(3,072)

(23,807)

(5,415)

Depreciation and other⁵

5,224

4,751

15,314

13,925

Amortization of acquired intangibles⁶

4,184

2,839

12,554

8,517

Adjusted EBITDA

(80,495)

(45,280)

(207,821)

(111,293)

Denominator⁷

     Weighted-average Class A common shares outstanding, basic and diluted

36,806,913

N/A

36,216,440

N/A

Common Units of Quantinuum Holdings

225,242,666

N/A

226,892,141

N/A

Adjusted shares, fully distributed, basic and diluted

262,049,579

N/A

263,108,581

N/A

Per share⁸

      GAAP net loss per Class A common share, basic and diluted               

(0.46)

N/A 

(2.27)

N/A

Adjusted net loss per share, fully distributed, basic and diluted

(0.29)

n.m.

(0.81)

n.m.

(1) The as-converted basis includes the economic interests represented by Class A common stock and Common Units of Quantinuum Holdings as if all Common Units were exchanged for Class A common stock. It is used because Class A common stock represents a minority of the economic interest in Quantinuum Holdings.

(2) Represents non-cash compensation expense associated with equity-based awards, including expense recognized in connection with the Reorganization, together with the related employer payroll taxes on equity vesting. Employer payroll taxes were $94 and $17,221 for the three and nine months ended September 30, 2026, respectively, and zero in the corresponding prior year periods. The stock-based compensation component agrees to the stock compensation expense line in the condensed consolidated statements of cash flows.                                               

(3) Represents costs of the initial public offering, transaction costs, and the transition to public company reporting. These costs represent professional fees for advisory, legal, accounting, valuation and other professional or consulting services incurred related to the IPO. These costs are scoped by reference to their cause and have a defined end. They do not include the ongoing costs of operating as a public company.                                                          

(4) Represents the non-cash change in fair value of liability-classified warrants, which is driven by valuation inputs and accounting remeasurement rather than operating activity.                                                            

(5) Represents total depreciation and amortization per our condensed consolidated statements of cash flows, less amortization of acquired intangibles shown separately below. Includes amortization of capitalized software.

(6) Represents total amortization of acquired intangible assets for the period and agrees to the amortization expense line in the condensed consolidated statements of operations.                                                        

(7) The denominator comprises Class A common stock and all Common Units of Quantinuum Holdings. Class B common stock is non-economic, carries voting rights only, and is cancelled upon exchange of the corresponding Common Units.                                                         

(8) GAAP net loss per Class A common share covers only the period from June 5, 2026, following the Transactions, while adjusted net loss per share, fully distributed, covers the full nine month period presented. The two measures therefore are not calculated on the same period basis. No per share amounts are presented for periods prior to the Reorganization because the calculation would not produce values meaningful to users.         


Flatkey Launches Flatkey Compute, a NeoCloud for Dedicated NVIDIA B300 Clusters

Each customer gets an entire cluster reserved for it alone, built and operated by Flatkey as a compliant inference cloud for AI workloads only

SAN JOSE, Calif., Nov. 6, 2026 /PRNewswire/ — Flatkey Inc. (https://flatkey.ai) today launched Flatkey Compute, a NeoCloud that builds and operates dedicated NVIDIA B300 clusters for its customers. Every cluster is reserved for a single customer and shared with no one. Flatkey runs each cluster as a compliant, trusted inference cloud, and the company works only on AI, not general-purpose computing.

Flatkey Compute builds and operates dedicated NVIDIA B300 clusters, each reserved for a single customer.

Why dedicated clusters

Most AI teams buy GPU capacity from general-purpose clouds, where many tenants share the same physical hardware. That works for experiments. Production inference is harder: latency has to be predictable, another tenant’s workload can slow yours down, and regulated customers have to document who else has access to the machines.

A Flatkey Compute cluster removes those variables. The whole cluster belongs to one customer, so no other tenant’s workload can affect its performance, and a security review has no co-tenants to account for.

Built and run by Flatkey

Ahead of today’s launch, Flatkey has delivered compute capacity to dozens of major customers. It sizes each cluster to the customer’s workload. GPU count, region and network topology are set per deployment instead of being picked from a list of standard instance types. Once the cluster is live, Flatkey operates it, so the customer does not need its own infrastructure team to run it.

A B300 inference cloud, for AI only

Clusters run on the NVIDIA B300 and are built for AI inference. Flatkey does not offer general-purpose computing, and it designs its infrastructure around AI workloads alone. On data protection, Flatkey is GDPR compliant, monitors its security controls continuously through Vanta, and does not retain request content.

Pricing and terms

Customers request capacity at https://flatkey.ai/compute, stating the GPU count, region and term they need. Flatkey replies within 24 hours, then sends a formal quote that sets the price, configuration, region and provisioning date. Reserved terms of one, three and five years are available, and longer commitments are priced lower. A reference GPU price index on the same page shows indicative rates before a customer gets in touch.

“Inference is moving from something teams experiment with to something their product depends on,” said Hunter Guo, founder of Flatkey. “At that point, you don’t want to be sharing a machine with strangers. You want your own cluster, you want to know where it is, and you want somebody to run it for you. That is what we are building.”

Availability

Flatkey Compute is available now by request at https://flatkey.ai/compute. Smaller teams that need only a few GPUs can also rent them on demand, billed by the hour, in the Flatkey console at https://console.flatkey.ai/gpu-cluster.

About Flatkey

Flatkey Inc. is a NeoCloud that builds and operates dedicated NVIDIA B300 infrastructure for AI inference. Each customer runs on its own hardware, sized to its workload. The company also gives developers access to more than 100 official AI models through one API key. Flatkey launched in July 2026 and is headquartered in San Jose, California. For more information, visit https://flatkey.ai.

Media Contact

Xingru Ren
Head of Marketing, Flatkey
+1 424-356-6176
xingru@flatkey.ai 

Cainiao Launches AI and Embodied Intelligence Industry Partnership, Touts World’s Largest Real-World Training Network

HONG KONG, Nov. 6, 2026 /PRNewswire/ — Cainiao, a global leader in e-commerce logistics and technology, today launched a new industry partnership initiative for AI and embodied intelligence, opening its global warehouse network to partners to build the world’s largest logistics real-scene training cluster for AI and embodied intelligence.

The move is aimed at supporting technology training, real-world validation and industrial deployment, as AI and robotics companies look for more practical pathways to scale.

Cainiao also unveiled a new “Global Tech in Three Days” service for AI computing and robotics companies, offering end-to-end supply chain support spanning prototype testing, scaled delivery and overseas operations.

“AI has become a new engine of productivity,” said William Xiong, CEO of Cainiao Global. “Over the past decade, Cainiao has built an open, efficient and sustainable smart logistics network. As AI and embodied intelligence move from the lab into real industry, we want to leverage our global network to help partners accelerate value creation.”

As AI continues to advance, intelligence is increasingly extending from the digital world into physical industries, making physical AI a key direction for the next wave of industrial transformation. According to the company, the next decade could see major advances in the sector, with efficiency improvements potentially reaching 10 to 50 times.

To support this transition, Cainiao is opening dozens of industry-specific proof-of-concept scenarios covering core operations such as warehouse picking, intelligent navigation and delivery, high-altitude inspection, security operations, aviation logistics and auto parts management, and providing partners with a platform for joint R&D, real-machine training and business validation.

With its global logistics network spanning multiple countries, industries and operating environments, Cainiao covers the full chain from domestic pickup and cross-border line-haul to overseas fulfillment. The network handles high volumes of multi-SKU shipments and can provide embodied intelligence companies with a larger, more realistic environment for training and validation.

Cainiao has already scaled pilot deployments across express delivery, e-commerce, FMCG and auto parts scenarios, covering three major task types: basic tasks such as parcel feeding and labeling, mid-level precision tasks such as small-item sorting, and advanced long-horizon tasks such as palletizing and complex depalletizing, helping robots expand from single-point operations to more sophisticated real-world applications.

The company also introduced its “Global Tech in Three Days” service to support the global expansion of consumer robot makers, AI computing companies and embodied intelligence hardware and component suppliers. Built on its global express, air freight and warehousing capabilities, the one-stop service provides hard-tech companies at different stages with integrated support, including customs support, forward and reverse logistics, high-value cargo insurance, forward warehousing and spare-parts management.

Global express is designed for on-demand needs such as R&D testing, customer demos, product fulfillment and small-batch replenishment. Global air freight is tailored for large, high-value shipments including AI infrastructure equipment, control systems and core modules, while the global warehouse network supports regional stocking, multi-country warehousing and local delivery.

“We want to extend the global logistics capabilities we have built for e-commerce into AI and embodied intelligence,” Xiong said. “Our goal is to make intelligent technologies go global as efficiently and simply as e-commerce parcels.”

Cainiao will continue expanding partnerships with technology companies and research institutions to advance AI validation and industrial applications, and help build a global AI innovation ecosystem.

The company has signed initial cooperation agreements with leading firms in AI computing and embodied intelligence, with nearly 100 representatives from across the industry chain attending the launch event in Hong Kong.

BLUETTI Apex 200 Arrives: A Versatile 2.5kWh Solar Generator for Home Backup, RVs, and More

Flagship Apex versatility in a compact 2.5kWh format—big enough for real backup, light enough to move, and built to scale.

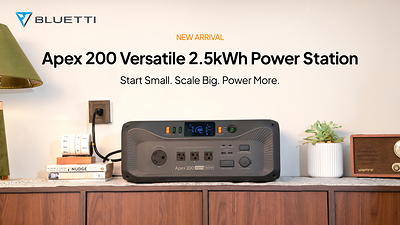
LAS VEGAS, Nov. 6, 2026 /PRNewswire/ — BLUETTI today launched the Apex 200—a streamlined, highly portable solar generator tailored for home emergency backup, power grid reliability, RV travel, and off-grid living. Early pricing is available across launch packages from November 4 through November 18, with the standalone Apex 200 portable power station starting at $1,099.

Amid rising power grid anxiety, the new Apex 200 portable power station is a compact entry point for home emergency backup and off-grid living.

“After the well-acclaimed Apex 300, the number one piece of feedback we heard was simple: users loved the modular versatility, but wanted it in a package they could easily manage day-to-day,” said James Ray, Marketing Director at BLUETTI. “The Apex 200 is our answer. It’s not just a smaller battery—it’s a flexible everyday powerhouse built to start smaller for emergency backup, with a clear, stress-free path to scale up as your life and power needs grow.” 

Start Small. Scale Big. Power More.

Bringing flagship Apex versatility into a compact 2.56kWh format, the Apex 200 offers a more accessible entry point designed to start small and scale as power needs evolve.

  • Base Unit Performance
    Combines 2,560Wh of LFP capacity with a robust 3.2kW~3.6kW AC output (3.6kW with expansion or active charging) in a sleek 26.9kg enclosure.
     
  • Single-Unit Expansion (Up to 33.28kWh)
    A single Apex 200 unit connects with up to six B500K expansion batteries to reach its individual max capacity of 33.28kWh. For typical power outages, adding one or two B300K batteries can extend essential home backup to 2–3 days.
     
  • Parallel System (Up to 6kW/~ 100kWh)
    Links up to three Apex 200 units via HUB A1 to deliver 6kW continuous AC output and ~100kWh total capacity for whole-home backup.

3kW Solar Input, 280V High-Voltage

For extended outage and off-grid independence, the Apex 200 delivers up to 3kW of high-voltage solar input across two independent channels—combining a 2kW high-voltage MC4 input (60V–280V MPPT range) and a 1kW low-voltage XT60 input. When paired with an array of high-efficiency SORA 500 portable solar panels to maximize its 3kW input capacity, the system tops up the battery from 0 to 80% in just 50 minutes and achieves a full 100% charge in 1.7 hours using solar energy alone. Combined with wall AC, gas generators, and vehicle charging, it serves as a flexible home battery backup system built for both severe weather and outdoor adventures.

RV-Ready: Native RV Ports in a Smaller Footprint

Built for tight camper vans and travel trailers, the Apex 200 packs heavy-duty capability into a compact 26.9kg, 36.2L enclosure. Powered by BLUETTI UltraCell™ technology, it achieves an industry-leading volumetric energy density of 70.7 Wh/L, tucking effortlessly under RV seating or in tight pass-through storage without sacrificing cabin space. Equipped with 10 versatile output ports, it simplifies the connection without extra adapters:

  • Native 30A TT-30R RV Port:
    Plugs directly into travel trailer shore power inlets for seamless 120V power.
     
  • Heavy-Duty 12V/30A Anderson Port:
    Directly powers heavy-draw 12V appliances—such as portable fridges and communication gear—with zero conversion loss.

When traveling between campsites, the system can also pair with the Charger 2, the alternator & solar dual charger for faster on-the-go charging.

Industry-First Smart AC Control

The Apex 200 introduces an industry-first feature to the portable power station market: four independently controllable smart AC outlets. Through the BLUETTI App, users can remotely switch individual outlets, set automated operation schedules, apply state-of-charge controls, and preserve stored energy for priority loads during extended blackouts.

The system also provides 15ms UPS switching for sensitive electronics and integrates seamlessly with Amazon Alexa, Google Home, and Home Assistant ecosystems. When AC output is enabled with the display off, idle consumption drops to just 10.5W, helping preserve stored energy during extended standby periods.

Availability and Pricing

The Apex 200 portable power station officially launches on November 4, offering its lowest standalone price of $1,099 for the first 14 days (regularly $1,399). Following this initial launch window, standalone pricing will step up through December 5 before returning to its regular price, while selected bundle prices will remain unchanged throughout the entire launch period. Customers can also use code BLUETTI5OFF at checkout for an extra 5% off all bundles.

Product or bundle

Launch price

Regular price

Apex 200 standalone

$1,099

first 14 days, until Nov. 18th 23:59 PDT  

$1,399

Apex 200 + 200W  Solar Panel

$1,499

$1,699

Apex 200 + SORA 500 Solar Panel

$1,849

$2,199

Apex 200 + Charger 2

$1,598

$1,799

Apex 200 + B300K

$2,199

$2,599

Apex 200 + B500K + TT-30 cable

$2,799

$3,299

About BLUETTI

Established in 2013, BLUETTI has evolved into a pioneer in the clean energy sector. Driven by robust in-house R&D and sustainable innovation, the brand empowers millions across 120+ countries to stay safe and prepared. Its portfolio of solar generators and home battery backup solutions provides reliable power for emergency preparedness, RV travel, and off-grid lifestyles.

Media Contact

Ellen Lee
PR Lead, US Market
ellenlee@bluetti.com 

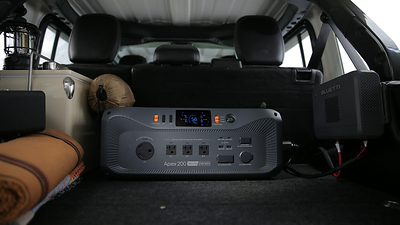
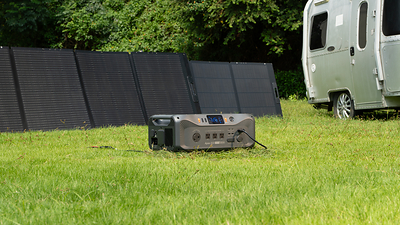
The compact Apex 200 is designed for easy transport between home, vehicle, and campsite, pairing with Charger 2 for fast recharging on the road.

Scaling from essential backup to whole-home resilience, a single Apex 200 unit expands to 33.28kWh—or up to 6kW AC output and 99.84kWh capacity across three units in parallel.

The Apex 200 is a high-voltage solar generator with a native TT-30R port for direct connection to compatible 30A travel trailers or home inlet boxes.

Multiliquid Treasury Launches 24/7 T-Bill Yield and Instant Settlement for Corporate Cash

Institutions can now earn continuous Treasury yields on idle operating balances with atomic, around-the-clock redemptions.

LOS ANGELES, Nov. 6, 2026 /PRNewswire/ — Multiliquid, the instant settlement layer for tokenized assets, today launched Multiliquid Treasury: an institutional cash management solution enabling corporate treasuries, fintechs, and asset managers to earn short-duration Treasury yields on idle capital, with instant redemption available 24/7.

Traditional corporate cash management forces a hard compromise between yield and velocity. Operating floats held for payroll, vendor obligations, and margin requirements routinely sit idle in non-interest-bearing operational accounts because money market funds can only be redeemed on business days, before strict daily cut-offs, and close completely over weekends and bank holidays.

Multiliquid Treasury eliminates this cash drag by using tokenized assets. Depositors access a formulaic interest rate tied directly to the 3-month U.S. Treasury Bill rate, while retaining the ability to sweep back into cash or stablecoins atomically in a single transaction, at 2:00 AM on a Sunday just as easily as midday Tuesday.

Solving the Weekend Float Problem

For an enterprise holding $25 million in liquid reserves, leaving cash idle costs hundreds of thousands of dollars annually in forgone interest. At an indicative annualized rate of up to 3.5%, that capital could generate up to approximately $875,000 a year in continuous yield without impairing same-day liquidity needs.

“For decades, corporate cash has had to choose between earning a return and being available, because the systems that move money close every evening and every weekend. On-chain settlement removes that constraint. Multiliquid Treasury is what cash management looks like in the new financial system: every idle dollar earns T-Bill yield, and every dollar is back in cash the moment you need it.” — Will Beeson, Founder and CEO, Multiliquid

How it works

  • Diversified Money Market Fund Backing: Depositors lend to an SPV whose reserves are programmatically allocated across regulated, blue-chip tokenized government funds—including the WisdomTree Government Money Market Digital Fund (WTGXX) and the Janus Henderson Anemoy Treasury Fund (JTRSY), mitigating single-issuer concentration risk.
  • Instant Exits via Dedicated Buffer. A programmatic 5–10% liquidity buffer, reinforced by institutional repo lines, supports atomic instant redemptions under normal market conditions, with no notice periods or redemption windows.
  • Unified Onboarding: Replaces fragmented fund-by-fund documentation with a single KYB/KYC verification covering the entire underlying portfolio. U.S. and international accredited institutions can typically onboard within 24 hours.
  • API-first. Accessible via institutional APIs and smart contracts for automated treasury sweeps, alongside a no-code dashboard for manual execution.
  • Verifiable. Reserves and fund allocations are verifiable on-chain in real time, with core settlement contracts audited by Cantina and Zellic.

Availability

Multiliquid Treasury is live today across Ethereum Mainnet and Solana for eligible accredited and institutional investors. Onboarding at https://www.multiliquid.xyz/tsy-onboarding

Key facts

Item

Detail

Product

Multiliquid Treasury

Target Function

Continuous T-Bill yield accrual with instant, 24/7 redemption

Yield Benchmark

Formulaic rate indexed to 3-month U.S. Treasury Bill yields (indicative APY up to 3.5%)

Underlying

WisdomTree WTGXX & Janus Henderson JTRSY (AAAf / S1+), buffered by 5–10% liquid cash reserves

Settlement Mechanics

Single-block atomic settlement (Ethereum Mainnet & Solana); 24/7/365

Legal Structure

Depositors are lenders to Uniform Treasury SPV, LLC, a Delaware bankruptcy-remote SPV.

Eligibility

U.S. and international accredited & institutional investors; zero deposit minimums

Onboarding

KYC/KYB and accredited investor verification; typically under 24 hours

Security Audits

Cantina, Zellic

Access Methods

Developer API, Multiliquid Web Application, SDK, Direct via Smart Contracts

About Multiliquid

Multiliquid is the instant settlement layer for tokenized assets: a neutral, institutional-grade liquidity layer that enables instant, 24/7 atomic settlement between tokenized assets, stablecoins and tokenized deposits. Treasurers, asset issuers and capital providers use Multiliquid to move between tokenized funds and cash without redemption windows or cut-off times. Learn more at multiliquid.xyz.

Media contact: team@multiliquid.xyz