Home Blog Page 82

Oi Wah Announces Interim Results

Net Profit Surges Nearly 40% with Interim Dividend of HK 1.4 cents per share


Financial Highlights

For the six months ended 31 Aug
HK$’000 2026 2025 Change
Profit before taxation 62,877 44,696 +40.7%
Profit for the period attributable to shareholders 53,463 38,381 +39.3%
Net profit margin 63.6% 46.8% +16.8 p.p
Basic earnings per share (HK cents) 2.8 2.0 +40.0%
Net interest margin 19.1% 16.4% +2.7 p.p

HONG KONG SAR – Media OutReach Newswire – 28 October 2026 – The board of directors of Oi Wah Pawnshop Credit Holdings Limited (HKEx stock code: 1319.HK, the “Group” or “Oi Wah”) announced its interim results and its financial position. For the six months ended 31 August 2026 (“FP2027”), the Group recorded revenue of approximately HK$84.1 million and profit attributable to shareholders of the Company of approximately HK$53.5 million, representing a year-on-year increase of approximately 39.3%.

During the period, earnings per share was HK 2.8 cents, representing a year-on-year increase of approximately 40.0%. The Board of Directors recommends an interim dividend of HK 1.4 cents.

Business Review

Mortgage loan business

In FP2027, the interest income of the mortgage loan business of the Group was approximately HK$31.6 million, which accounted for approximately 37.6% of the Group’s total revenue. As at 31 August 2026, the gross mortgage loan receivable was approximately HK$582.5 million and during the period, the total new mortgage loans granted amounted to approximately HK$132.9 million. During the period, net interest margin of the mortgage loan business is about 10.8%. There were 36 new cases of mortgage loan transactions.

The Group recorded the reversal of impairment losses of loan receivables of approximately HK$2.9 million during the period, as compared to a charge for impairment losses of approximately HK$10.9 million for the six months ended 31 August 2025 (“FP2026”). It is mainly attributable to a slight increase in residential property prices in general in the first half of 2026.

Pawn Loan Business

During the period, the interest income generated from the pawn loan business was approximately HK$43.7 million in FP2027, representing a period-on-period increase of approximately 10.9%. The Group also recorded gain from disposal on repossessed assets of approximately HK$8.8 million.

During the period, the Group continued to channel resources to advertising and promotion, in order to enhance the Group’s brand exposure. Such effort has generated demand of one-to-one pawn loan appointment services for pawn loans of loan size exceeding HK$0.1 million. The Group recorded average loan amount of approximately HK$13,000 per transaction during FP2027.

Prospects

Looking ahead, the global macroeconomic environment is anticipated to expand at a moderate pace, offset by persistent geopolitical tensions in the Middle East and structural inflationary pressures. Market volatility and interest rate trajectories have increasingly evolved into primary structural considerations for cross-border capital allocation. Amid these evolving economic conditions, international gold prices are expected to fluctuate within an elevated range near historical peaks, reinforcing the valuation stability of underlying collaterals and maintaining a prudent risk buffer for the Group’s pawn loan portfolio. In Hong Kong, the Board anticipates that the residential property market will remain in a phase of structural consolidation and price recovery. Supported by sustained capital inflows from the Mainland, government talent admission frameworks, and steady primary market inventory clearance, residential demand is expected to recover progressively. Conversely, the commercial and industrial property sectors are projected to remain subdued, reflecting prolonged supply-demand realignments. Weighing these macro factors, the Board maintains a cautiously optimistic outlook on the local property sector and broader economy.

Having strengthened our credit risk management framework and optimized portfolio quality in recent periods, the Group has achieved a solid foundation in asset quality. With market conditions gradually stabilizing, the Board considers it opportune to rebalance our strategic focus towards capturing high-quality growth opportunities. To drive profit growth and revenue diversification, the Group is deepening its strategic partnership with PACM Group to scale its presence in real estate private credit management. Concurrently, the Group will step up its marketing efforts and actively explore lending opportunities to strengthen loan origination across both pawn and mortgage financing segments.

Furthermore, the Group will selectively pursue targeted acquisition opportunities of established pawn operators to expand customer reach, drive operational synergies, and reinforce brand equity. Through these dual-track growth strategies, the Group remains uniquely positioned to solidify its market-leading position and deliver sustainable long-term value for shareholders.

Mr. Edward Chan, Chairman, CEO and Executive Director of the Company, said, “In navigating a complex macro landscape, our strong business resilience and refined risk management drove a near 40% surge in net profit, demonstrating the core strength of our business model. As Hong Kong’s residential property market gradually consolidates and recovers, we believe now is the right time to actively capture high-quality growth opportunities. Moving forward, we are executing a dual-engine strategy: expanding into real estate private credit management through strategic alliances, while pursuing targeted acquisitions of established pawn operators to broaden our reach. This multi-stream approach will reinforce our earnings base, solidify our market leadership, and deliver enduring value to our shareholders.”

Hashtag: #靄華押業 #OiWah #中期業績 #InterimResults

The issuer is solely responsible for the content of this announcement.

Oi Wah Pawnshop Credit Holdings Limited

Oi Wah is a financing service provider in Hong Kong, mainly providing short-term secured financing, including pawn loans and mortgage loans. The Group established its first pawnshop in 1975 and currently owns 10 pawnshops and one premium service center in various locations in Hong Kong. Oi Wah diversified into mortgage loan business in 2009. The Group is the first local pawn shop which successfully listed on the Main Board of The Stock Exchange of Hong Kong Limited on 12 March 2013.

Prudential convenes inaugural Partnership Summit to shape the next era of customer and business growth


HONG KONG SAR – Media OutReach Newswire – 28 October 2026 – Prudential plc (“Prudential”), a leading insurer and asset manager in Asia and Africa, brought together senior leaders from key banking and strategic partnerships for its inaugural Prudential Partnership Summit in Chengdu, China. Held under the theme “Catalyst for the Next Wave”, the two-day event gathered over 150 participants, including economists, banking and fintech leaders, and Prudential executives, to strengthen collaboration, expand capabilities and accelerate innovation.

Prudential Partnership Summit 2026

The Summit explored the trends reshaping customer expectations and the future of financial services. Discussions focused on rising wealth, increasing cross-border mobility, and the growing convergence of data, artificial intelligence and human expertise. Participants exchanged perspectives on how deeper partnerships can enhance customer outcomes and unlock new opportunities for the next phase of growth.

Chengdu’s history provided a fitting backdrop for the Summit. More than a thousand years ago, the city pioneered “jiaozi”, widely regarded as the world’s first paper money. Its success depended on trust in the promise behind it, a principle that remains equally important in successful partnerships today.

Dennis Tan, Regional CEO, Thailand, Vietnam, Cambodia, Myanmar; Group Partnership Distribution, Prudential plc, said: “Keeping promises sits at the heart of every partnership for Prudential. Founded on trust and strengthened through collaboration, these relationships help us meet customers’ increasingly interconnected health, protection and wealth needs.

“The Summit demonstrated the strength of Prudential’s partnership ecosystem and the opportunities ahead. By bringing together distribution expertise, digital capabilities and market insights, we are working to create better customer experiences and drive long-term, sustainable growth with our partners.”

The programme also featured guest speaker Pierluigi Collina, FIFA’s Chief Refereeing Officer and referee of the 2002 FIFA World Cup Final. Drawing on his experience at the highest level of international football, he shared perspectives on leadership, accountability and sound decision-making in complex and rapidly changing environments.

Partnership distribution at Prudential

Prudential harnesses the strength of its partnership ecosystem to translate shared priorities into action, helping more customers achieve greater financial security and confidence for the future.

Partnership distribution has long been central to Prudential’s growth strategy. Since establishing its first strategic bancassurance partnership in 1998, Prudential has built one of Asia’s largest bancassurance franchises, comprising more than 180 banking partnerships across markets. In the first half of 2026, the bancassurance channel delivered US$586 million in new business profit, up 13 per cent on a constant exchange rate basis from US$505 million in the same period last year.

Hashtag: #Prudentialplc

The issuer is solely responsible for the content of this announcement.

About Prudential plc

Prudential provides life and health insurance and asset management in Greater China, ASEAN, India and Africa. Prudential’s mission is to be the most trusted partner and protector for this generation and generations to come, by providing simple and accessible financial and health solutions. The business has dual primary listings on the Stock Exchange of Hong Kong (HKEX: 2378) and the London Stock Exchange (LSE: PRU). It also has a secondary listing on the Singapore Stock Exchange (SGX: K6S) and a listing on the New York Stock Exchange (NYSE: PUK) in the form of American Depositary Receipts. It is a constituent of the Hang Seng Composite Index and is also included for trading in the Shenzhen-Hong Kong Stock Connect programme and the Shanghai-Hong Kong Stock Connect programme.

Prudential is not affiliated in any manner with Prudential Financial, Inc. a company whose principal place of business is in the United States of America, nor with The Prudential Assurance Company Limited, a subsidiary of M&G plc, a company incorporated in the United Kingdom.


NineSmart Showcases AI-Powered Work Order Management Solution at HKTDC Hong Kong Electronics Fair (Autumn Edition)

Wins Merit Award at the 12th Hong Kong Value Creation for Technology Awards


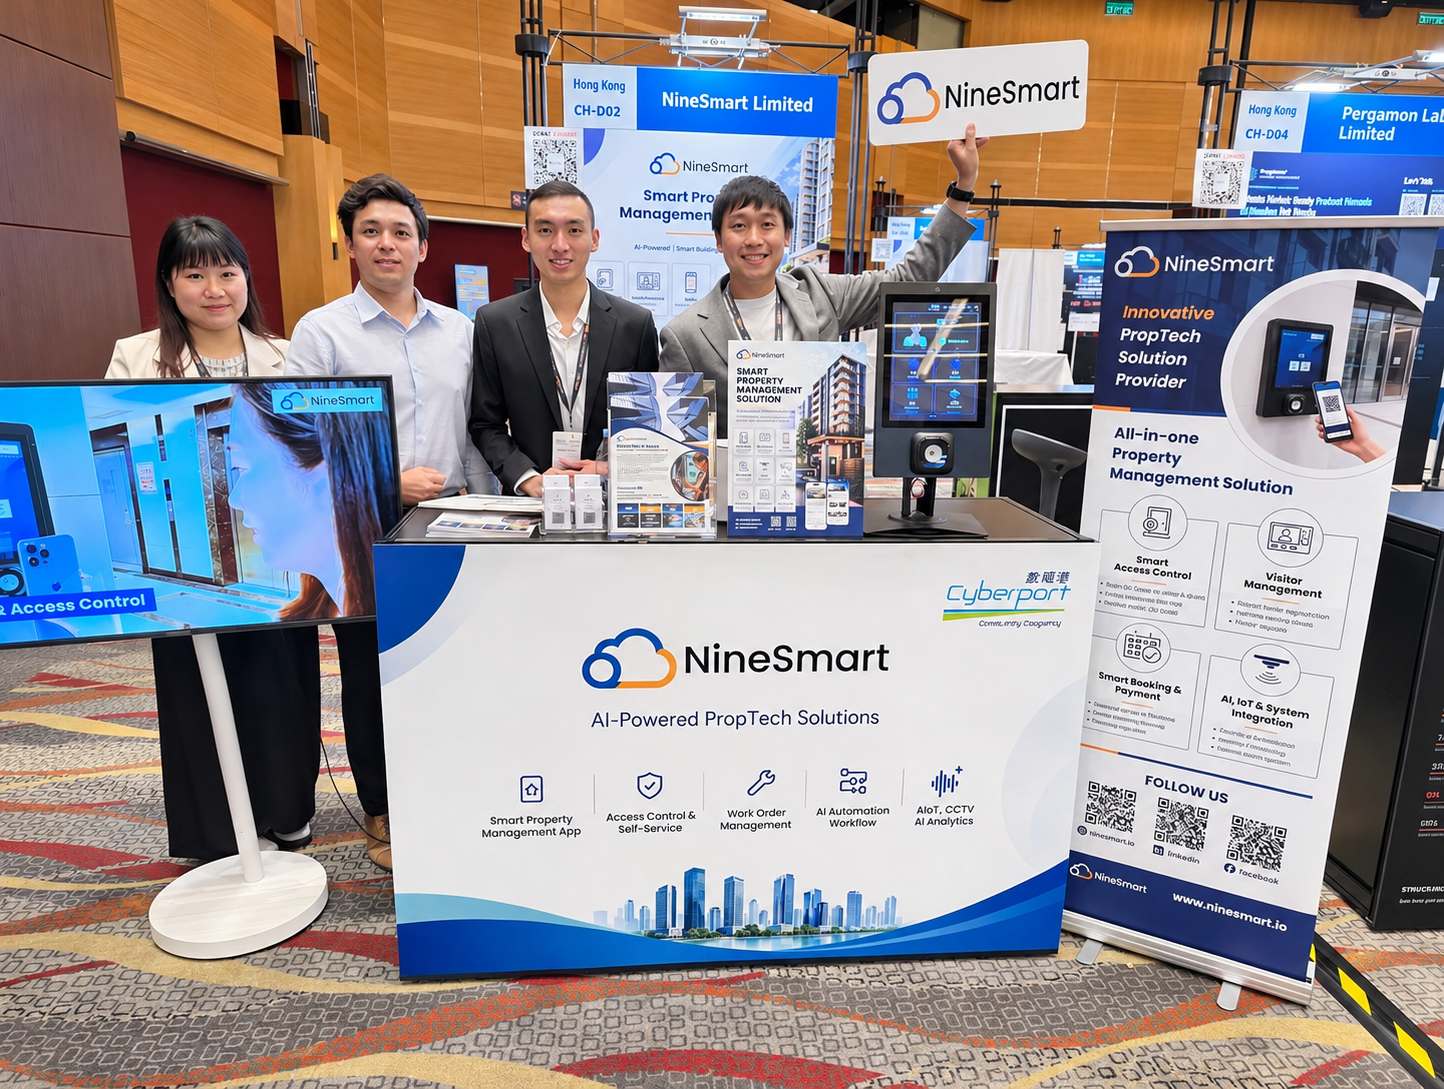
HONG KONG SAR – Media OutReach Newswire – 28 October 2026 – NineSmart, Hong Kong PropTech enterprise, presented its AI-Powered Work Order Management Solution at the HKTDC Hong Kong Electronics Fair (Autumn Edition) in October 2026. The company demonstrated how AI and IoT technologies can inject automation into property management operations.

NineSmart PropTech Expo Showcase.png

Recognized with Merit Award at Hong Kong Value Creation for Technology Awards

During the exhibition, NineSmart participated in the 12th Hong Kong Value Creation for Technology Awards held concurrently and was honored with the Merit Award. Jointly organized by the Angel Investment Foundation and the Hong Kong Trade Development Council (HKTDC), the competition aims to recognize startups that combine innovative technology with strong commercial viability and high investment potential.

Mr. Sing Wong, Business Director of NineSmart, presented the company’s “Smart Property” management solution to the judging panel, highlighting how it effectively addresses key industry pain points to earn this distinction.

Reshaping Property Management Workflows with AI

Traditional property management teams often rely heavily on manual reporting, task assignment, and cross-departmental coordination when handling complex daily operations, routine inspections, and facility maintenance, such as equipment breakdowns or water seepage, which significantly undermines overall response and operational efficiency.

NineSmart’s AI-Powered Work Order Management Solution integrates IoT, Intelligent video analytics, and an AI Voice Assistant to fully digitize and automate complex dispatching and record-keeping workflows. Accessible via a mobile app and cloud-based management platform, the solution seamlessly connects the entire lifecycle — from incident reporting, task allocation, and progress tracking to completion records. This significantly improves cross-departmental collaboration, drastically shortens response times, and enhances overall transparency in facility maintenance management.

End-to-End A Automation: From Incident Detection to Task Completion

Covering the full lifecycle of daily property operations and estate management, key features include:

  • Multi-Channel Smart Work Order Creation: In addition to manual creation by property management teams and frontline staff, the system integrates with CCTV cameras and IoT sensors to automatically trigger and generate work orders upon detecting anomalies.
  • AI Automatic Recognition & Precise Allocation: Once backend AI identifies an issue, it instantly generates a work order and pushes notifications to relevant technicians or staff via the mobile app for immediate action.
  • Hands-Free Reporting via AI Voice Assistant: Frontline security and engineering personnel can create work orders or update task statuses simply using voice commands. The system converts speech to text in real time and extracts critical information, eliminating tedious manual entry and boosting productivity.
  • Cloud-Based Tracking & Complete Visibility: Frontline workers update task progress and submit reports in real time via the mobile app, while management can easily monitor overall status across a centralized cloud platform to ensure every incident is properly handled.

Furthermore, the solution integrates an Emergency Alert System (EAS) with multi-tier notifications via app pushes, SMS and voice broadcasts. During critical incidents, it alerts maintenance personnel to carry out urgent repairs and simultaneously sends safety notices to stakeholders.
Hashtag: #NineSmart #PropertyTechnology #SmartProperty #AIWorkOrderManagement #HKElectronicFair #HKValueCreationforTechnologyAwards

The issuer is solely responsible for the content of this announcement.

About NineSmart

(www.ninesmart.io) develops PropTech solutions using AI, IoT and cloud technologies to automate building operations, support digital transformation and improve property management efficiency. As a Cyberport incubatee, NineSmart is dedicated to creating innovative, sustainable, and user-centric smart living experiences.

GTN and AmInvestment Bank expand market access for Malaysian investors

SINGAPORE, Oct. 28, 2026 /PRNewswire/ — GTN, the global fintech powering limitless investment, and AmInvestment Bank Berhad (“AmInvestment Bank”), part of AmBank Group Berhad, one of Malaysia’s largest leading banking groups, today announced a partnership to expand the global investment opportunities available to AmInvestment Bank clients.

Powered by GTN’s co-branded global trading platform, GTN Trade, AmInvestment Bank will enable its clients seamless access to 13 global markets, including the United States, the United Kingdom, Singapore, Hong Kong, Japan, and Australia.

Through a single integration, AmInvestment Bank can offer access to multiple markets without having to establish separate broker relationships or build the associated connectivity and post-trade infrastructure for each market. GTN Trade operates under AmInvestment Bank’s brand, while GTN provides the underlying execution, custody and settlement infrastructure, enabling AmInvestment Bank to bring its global investing offering to market more efficiently.

“At GTN, we believe access to global markets should be simpler and more accessible to investors,” said Julien Le Noble, CEO Asia at GTN. “Our infrastructure enables financial institutions to expand their investment offerings and connect clients to global markets without having to build the underlying capabilities themselves. By partnering with AmInvestment Bank, we are helping bring global investing opportunities to more Malaysian investors through a familiar banking relationship.”

“Our goal is to make global investing simpler and more accessible for our clients. Through this partnership with GTN, we are enhancing our investment offering by providing convenient access to 13 global markets, enabling clients to diversify their portfolios and capture opportunities across different geographies and sectors. More importantly, this is a strategic step in strengthening our wealth and investment services, empowering Malaysian investors to look beyond domestic markets with greater choice and flexibility. By combining AmInvestment Bank’s market expertise and established presence in Malaysia with GTN’s global trading infrastructure, we are well positioned to deliver a more seamless and integrated investment experience that supports our clients’ evolving financial needs and long-term investment aspirations,” said Christopher Ng, Chief Executive Officer of AmInvestment Bank.

The partnership reflects the growing importance of international market access as investors look beyond their domestic markets to diversify their portfolios. By combining AmInvestment Bank’s established presence in Malaysia with GTN’s global brokerage infrastructure, the partnership will make it easier for AmInvestment Bank clients to access investment opportunities across major global markets and the wider Southeast Asian region.

About GTN

GTN is the global fintech infrastructure powering limitless investment through a unified API-first architecture. By combining cloud-native technology with deep institutional expertise, GTN provides brokers, banks, asset managers, and fintechs with brokerage infrastructure spanning 90+ markets and up to 8 asset classes across GTN’s six regulated entities, through a single API, enabling partners to create the next generation of investing and trading experiences. From fractional trading and micro-portfolios, including $1 fractional bonds, to full-service brokerage, GTN automates the investment lifecycle from digital onboarding to post-trade settlement. As a single counterparty, GTN reduces technical and regulatory burdens, enabling investment banks, brokerage firms, and wealth management firms to scale without having to build technology from scratch.

GTN has over 700 professionals across 14 countries and serves more than 500 clients worldwide, united by one mission: transforming the accessibility of investment and trading opportunities. GTN operates through six regulated entities, each authorised in its own jurisdiction: FCA in the UK, DFSA in the DIFC, MAS in Singapore, SEC and FINRA in the US, FSCA in South Africa, and SFC in Hong Kong. Strategic investors include IFC (World Bank Group) and SBI Ventures Singapore. To learn more, visit www.gtngroup.com or follow us on LinkedIn.

Kaizen Global Appoints Sivaramakrishnan Senthatty (Siva Sen) CEO of Kaizen Global India to Scale Global Delivery and Enterprise AI Capabilities

New leadership appointment strengthens Kaizen’s India GCC strategy, expanding global
delivery, talent, and AI-driven transformation capabilities worldwide

ATLANTA and CHENNAI, India, Oct. 28, 2026 /PRNewswire/ — Kaizen Global LLC, a leading global provider of enterprise AI, data analytics, and technology services, today announced the appointment of Sivaramakrishnan Senthatty (Siva Sen) as Chief Executive Officer of Kaizen Global India. In this role, Siva Sen will lead the expansion of Kaizen’s India operations, strengthening its Global Capability Center (GCC) strategy to scale delivery, talent, and enterprise AI capabilities for clients worldwide.

The appointment comes at a pivotal moment for Kaizen Global as it accelerates investments in its global delivery model. Kaizen Global India will serve as a core engine for enterprise transformation, leveraging Kaizen’s strengths in data engineering, advanced analytics, and enterprise AI, with continuous improvement and execution discipline.

Siva Sen brings extensive leadership experience in building and scaling global delivery organizations, with a strong track record of driving operational excellence, developing high-performing teams, and leading large-scale transformation initiatives. He joins Kaizen Global from LTM Ltd., an L&T Group Company, where he served as EVP and Country Head for Japan, leading international operations and market expansion. Prior to that, he held senior leadership positions at HCL Tech and TCS.

“As enterprises rethink how they build and scale capabilities in the AI era, the role of a high-quality global delivery hub becomes increasingly crucial,” said Krishna Arangode, Founder & CEO of Kaizen Global. “Siva Sen’s experience in building and operating large-scale delivery organizations will be critical as we shape Kaizen Global India into a differentiated engine for execution, innovation, and long-term client impact.”

Scaling a Next-Generation India GCC

Kaizen Global India is being designed as a high-impact global delivery hub, supporting enterprise clients across data, AI, ERP modernization, and innovation initiatives. The center will serve clients across key global markets, including India, Japan, the United States, Europe, and the Middle East.

Building on the recent acquisition of Nihon Technology, Kaizen Global India will leverage strong expertise in ERP implementations, cybersecurity, and application development and modernization, while expanding rapidly into advanced analytics and AI-led transformation capabilities.

Over the next few years, Kaizen Global plans to expand its India workforce across data engineering, AI/ML, ERP, and cybersecurity practice areas. This includes the building of specialized practice teams and investment in talent development, governance, and scalable delivery frameworks to support long-term growth.

Building a Global Delivery Engine for the AI Era

“What excited me about Kaizen Global is the opportunity to build a truly differentiated global delivery engine for the AI era,” said Siva Sen. “We’re bringing together strong data and AI capabilities with disciplined execution and a scalable delivery model. The focus in India will be on building high-quality teams and creating the operational backbone needed to deliver complex transformation programs with consistency and speed.”

“The industry is on the cusp of an AI-driven transformation that will redefine enterprise operating models,” said Anand Srinivasan, Chief Operating Officer and Managing Partner at Kaizen Global. “Organizations will need partners who can translate AI potential into real, scalable business outcomes. With Siva Sen leading our India operations, we’re building the capabilities needed to support that shift at scale.”

As Kaizen Global continues to expand its global footprint, the India center will play a key role in enabling closer alignment between strategy, technology, and execution. By building capabilities at scale and investing in talent and governance, Kaizen Global is positioning itself to support clients in navigating increasingly complex, AI-driven transformation journeys.

About Kaizen Global

Kaizen Global is a leading global provider of AI, data analytics, and technology services for enterprise transformation and business value generation. Combining business acumen with technical know-how, Kaizen Global delivers measurable, sustainable business outcomes through AI-enabled services, development of intelligent systems, and deployment of advanced analytics – all via a continuous improvement delivery model with a human-in-the-loop. Recognized for speed and flexibility by Gartner, NPR, Forbes, Entrepreneur, and by Inc. 5000 as one of America’s fastest-growing private companies, Kaizen is a certified minority-owned business headquartered in Atlanta with offices in New York, Dallas, Tokyo, Osaka, Chennai, and Hyderabad. Follow Kaizen Global on LinkedIn, Facebook, and Twitter @KaizenGlobal.com.
For more information, visit www.kaizenglobal.com.

Media Contacts:
Paulette Brown
Carabiner Communications
pbrown@carabinercomms.com 
770.577.3881

Prem Sivakumaran 
Growth Mechanics 
Prem@growthmechanics.in 

Australian Winter Bulk Cooking Trend Springs Into Spring as Australians Balance Costs and Health Goals

Consumer insights from Samsung Australia reveals approximately 72% of Australians surveyed are turning to bulk cooking to ease grocery bills and stress.

More than a third say their fridge simply isn’t big enough to keep up.

SYDNEY, Oct. 28, 2026 /PRNewswire/ — Samsung Australia has today released a fresh batch of consumer insights that reveals bulk cooking, a habit long associated with cooler months, is extending into spring as Australians look to manage grocery costs and kick-start New Year health goals as the weather warms up.

The Samsung insights reveal that almost two in three Australian respondents (62%) say they have bulk cooked specifically to save money[1], while over two thirds (69%) believe that bulk cooking helps to reduce their weekly shopping bill[2]. Beyond the hip pocket, the insights also suggest Australians are turning to bulk cooking as weekly meal prep to support overall health and wellbeing. Sixty-two per cent of Australian respondents say they intend to start the New Year by eating healthier[3], with over half (59%) claiming that bulk cooking helps meet health and nutrition goals[4].

Furthermore, the insights reveal that bulk cooked meal prep is also emerging as a genuine stress reliever. Almost three quarters of Australian respondents (72%) agree it reduces their weekly stress[5]; a figure that climbs to 87% among 25 to 29 year olds[6]. Further, almost half of Australians respondents (46%) claim to bulk cook breakfast, lunch and dinners to save time and reduce the daily mental load.[7]

Conversely however, Australians are running into storage challenges, with the insights revealing a third (34%) of Australians want to bulk cook more often, but claim their fridge isn’t big enough[8]. Further, around a quarter of Australians (24%) admit to stacking containers dangerously to make bulk-cooked meals fit[9], spiking to 45% among 18- to 24-year-olds and 43% among 25- to 29-year-olds[10].

According to Phil Gaut, Director – Consumer Electronics, Samsung Australia, the national shift towards meal prep to support Australian lifestyles has been occurring subtly over the past few years, and is now firmly reflected in consumer retail trends. “In 2026, larger capacities and energy efficient performance rank as the two most sought-after features among Australians shopping for a new fridge[11]. This shows that bulk cooking and meal prep isn’t just a winter ritual anymore, it’s a genuine strategy for Australians to save money, eat better and feel less stressed as we head towards the end of the year,” said Mr. Gaut.

As Australians move further into spring, the insights show that 56% have plans to use their weekends to bulk cook, while one in three (37%) say they’ll continue to put healthy food at the front of their fridge to remind themselves to eat healthier.[12] With end of year sales coming up, Mr Gaut suggests that now is a good time for Australians to start researching larger capacity models and notes that many shoppers re-entering the market for the first time in years may be surprised by the technological leaps refrigeration technology has taken in that time.

“AI paired with new design approaches have been the biggest drivers of change in the premium refrigeration category, with smart features working to address some of Australians’ biggest pain points every day,” said Mr Gaut. “French-door refrigerators are incredibly popular amongst Australians who rely on bulk cooking to stay on top of bills and schedules because they benefit from large internal capacities, flexible shelving, and in-built beverage centres that give easy access to ice and water – all while fitting into most standard refrigerator kitchen cavities.

“Large capacity screen-enabled refrigerators like Samsung’s Family Hub go further by using AI to directly address common Australian concerns like reducing food wastage and saving time and energy every day. The Family Hub does this by automatically tracking what goes into the fridge to create shopping lists and bulk-cooking menus based on nutrition goals, while tracking and managing energy use via SmartThings.[13] Refrigerators like this are made for Australian lifestyles and are designed to offer long-term value by evolving with families and personalising to their unique routines over time,” said Mr Gaut.

Available in various styles and capabilities in plumbed and non-plumbed models, Samsung has a refrigerator solution to meet the needs of Australian homes. Australians can also shop with confidence knowing that in 2026, Australian consumers voted Samsung’s Refrigerator line-up ‘Top Value’, ‘Most Reliable’, ‘Top Performance’ and ‘Most Recommended’ in Finder’s 2026 Customer Satisfaction Awards.

To find out more about Samsung’s range of refrigerators, visit https://www.samsung.com/au/refrigerators/all-refrigerators/  

About Samsung Electronics Co., Ltd.

Samsung inspires the world and shapes the future with transformative ideas and technologies. The company is redefining the worlds of TVs, digital signage, smartphones, wearables, tablets, home appliances and network systems, as well as memory, system LSI and foundry. Samsung is also advancing medical imaging technologies, HVAC solutions and robotics, while creating innovative automotive and audio products through Harman. With its SmartThings ecosystem, open collaboration with partners, and integration of AI across its portfolio, Samsung delivers a seamless and intelligent connected experience. For the latest news, please visit the Samsung Newsroom at news.samsung.com.

[1]Samsung commissioned research conducted by PureProfile, February 2026. Nationally representative sample of 1,008 Australians aged 18-95 years.

[2]Samsung commissioned research conducted by PureProfile, February 2026. Nationally representative sample of 1,008 Australians aged 18-95 years.

[3]Samsung commissioned research conducted by PureProfile, February 2026. Nationally representative sample of 1,008 Australians aged 18-95 years.

[4]Samsung commissioned research conducted by PureProfile, February 2026. Nationally representative sample of 1,008 Australians aged 18-95 years.

[5]Furthermore, the insights reveal Samsung commissioned research conducted by PureProfile, February 2026. Nationally representative sample of 1,008 Australians aged 18-95 years.

[6]Samsung commissioned research conducted by PureProfile, February 2026. Nationally representative sample of 1,008 Australians aged 18-95 years.

[7] Samsung commissioned research conducted by PureProfile, February 2026. Nationally representative sample of 1,008 Australians aged 18-95 years.

[8]Samsung commissioned research conducted by PureProfile, February 2026. Nationally representative sample of 1,008 Australians aged 18-95 years.

[9]Samsung commissioned research conducted by PureProfile, February 2026. Nationally representative sample of 1,008 Australians aged 18-95 years.

[10]Samsung commissioned research conducted by PureProfile, February 2026. Nationally representative sample of 1,008 Australians aged 18-95 years.

[11]WorldPanel ComTech, February 2026. Larger capacity and energy efficiency are the top two features desired by Australian consumers considering a Samsung refrigerator in 2026.

[12] Samsung commissioned research conducted by PureProfile, February 2026. Nationally representative sample of 1,008 Australians aged 18-95 years.

[13] Using the SmartThings App, which is available on Android and iOS devices. A Wi-Fi connection and a Samsung account are required


Ascendion Expands AI Advisory Community with Four Global Business and Technology Leaders

Former Global CTO of Banco Santander, former Group CIO of Currys, former CEO of IBPAP, and former Microsoft CVP and CTO of AI join the advisory community

Advisors will provide guidance on AAVA platform innovation, AI strategy, C-suite alignment, and enterprise adoption across Asia-Pacific, Europe, North America, and the UK

The growing community of advisors will bring practitioner perspective closer to Ascendion as enterprises move AI from experimentation to governed, production-scale outcomes

BASKING RIDGE, N.J., Oct. 28, 2026 /PRNewswire/ — Ascendion, an AI-native software engineering company, today announced the appointment of four global business and technology leaders to its AI Advisory Community: Andy Gamble, Jack Madrid, Julieta Ross, Ph.D., and Joseph Sirosh, Ph.D. 

Ascendion Expands AI Advisory Community with Four Global Business and Technology Leaders

The advisors bring perspectives rarely found in one group: executives who answered to Boards, regulators, and C-suites for what technology actually delivered; a builder of AI and data platforms at global scale; and a leader who shaped one of the world’s largest technology-services and talent ecosystems. Their experience spans banking, high-tech, media, and retail. Each will work directly with Ascendion’s regional and engineering leaders, so their counsel reaches the decisions it is meant to shape. 

“We are changing how software gets built. Enterprise leaders have moved past experiments. They want AI that delivers outcomes boards can measure and risk they can manage. Andy, Jack, Julieta, and Joseph have the experience and know where transformation succeeds. They will challenge our thinking, raise our ambition, and help us navigate a period of intense — and exciting — change,” said Karthik Krishnamurthy, CEO, Ascendion. 

Each advisor will map to a different part of the business, strengthening Ascendion’s alignment with leadership communities across the globe. 

  • Julieta Ross, Ph.D., former Global CTO of Banco Santander, brings two decades of leading technology inside global banks, along with public-company board experience. She will work with Ascendion’s leadership on executive relationships, go-to-market strategy, and growth, and will help the company meet the governance, regulatory, and risk expectations that banking and financial services leaders place on AI. 
  • Andy Gamble, former Group CIO of Currys plc, has spent nearly three decades as a technology buyer and transformation leader across consumer electronics, industrial, and retail businesses. He will advise Ascendion’s work across Europe and the UK, with a focus on consumer goods, manufacturing, and retail, and will share what executive teams and Boards expect from a technology partner. 
  • Joseph Sirosh, Ph.D., former Microsoft CVP and CTO of AI, has spent his career building and scaling machine learning platforms in the high-tech industry. He will advise Ascendion’s engineering leadership on the evolution of AAVA and its broader platform strategy as AAVA becomes an orchestration and harness layer for enterprise AI. 
  • Jack Madrid, former President and CEO of IBPAP, spent five years leading the industry association behind one of the world’s largest technology and business-services ecosystems, centered in the Philippines. He brings robust experience working across industries, including banking, high-tech, and media, and will advise Ascendion on Asia-Pacific markets and on how AI is reshaping global delivery, skills, and workforce models. 

Together, the advisors give Ascendion an outside perspective on the full spectrum of enterprise AI, from agentic platform strategy and product engineering to industry alignment and delivery. They will add capacity to Ascendion’s ongoing work on AI governance, helping ensure trusted impact from AI-native software engineering, and their practice-based insight will inform how Ascendion applies its Engineering to the Power of AI™ approach to commercial models, platform design, service execution, and workforce development. 

About Ascendion

Ascendion is a global AI-native software engineering company delivering trusted business outcomes – capital unlock, innovation velocity, lower risk – to 250+ enterprise clients. The company delivers business outcomes at scale by combining expert engineers, AI agents, and AAVA, Ascendion’s agentic AI platform. Together, they design, engineer, and operate production-ready software that improves everyday work and life. Learn more at www.ascendion.com.

Engineering to the Power of AI™, Engineering to Elevate Life™, and AAVA™ are trademarks or service marks of Ascendion. AAVA™ is pending registration. Unauthorized use is strictly prohibited.

Lufax Reports Third Quarter 2026 Financial Results

SHANGHAI, Oct. 28, 2026 /PRNewswire/ — Lufax Holding Ltd (“Lufax” or the “Company”) (NYSE: LU and HKEX: 6623), a leading financial services enabler for small business owners in China, today announced its unaudited financial results for the third quarter ended September 30, 2026.

Third Quarter 2026 Financial Highlights

  • Total income was RMB6,180 million (US$922 million) in the third quarter of 2026, compared to RMB6,479 million in the same period of 2025.
  • Net loss was RMB1,494 million (US$223 million) in the third quarter of 2026, compared to net loss of RMB380 million in the same period of 2025.

(In millions except percentages, unaudited)

Three Months Ended September 30,

2025

2026

YoY

RMB

RMB

USD

Total income

6,479

6,180

922

(4.6 %)

Total expenses

(6,785)

(6,901)

(1,029)

1.7 %

Total expenses excluding credit
impairment losses, finance costs and
other gains or losses

(2,613)

(2,262)

(337)

(13.4 %)

Credit impairment losses, finance costs
and other gains or losses

(4,172)

(4,639)

(692)

11.2 %

Net loss

(380)

(1,494)

(223)

293.2 %

Third Quarter 2026 Operational Highlights

  • Total outstanding balance of loans we enabled was RMB167.1 billion as of September 30, 2026, compared to RMB189.6 billion as of September 30, 2025, representing a decrease of 11.9%, among which the outstanding balance of consumer finance loans was RMB70.5 billion as of September 30, 2026, compared to RMB58.9 billion as of September 30, 2025, representing an increase of 19.8%.
  • Total new loans enabled were RMB58.3 billion in the third quarter of 2026, representing an increase of 2.5% compared to RMB56.9 billion in the same period of 2025, among which new consumer finance loans were RMB39.7 billion in the third quarter of 2026, compared to RMB31.7 billion in the same period of 2025, representing an increase of 25.2%.
  • Cumulative number of borrowers increased by 23.8% to approximately 35.3 million as of September 30, 2026 from approximately 28.5 million as of September 30, 2025.
  • As of September 30, 2026, including the consumer finance subsidiary, the Company bore risk on 95.8% of its outstanding balance of loans enabled, up from 87.3% as of September 30, 2025.
  • As of September 30, 2026, excluding the consumer finance subsidiary, the Company bore risk on 97.2% of its outstanding balance of loans enabled, up from 88.6% as of September 30, 2025.
  • For the third quarter of 2026, the Company’s retail credit enablement business take rate[1] based on loan balance was 14.0%, as compared to 13.0% for the third quarter of 2025.
  • C-M3 flow rate[2] for the total loans the Company had enabled, excluding the consumer finance subsidiary, was 1.2% in the third quarter of 2026, compared to 1.0% in the second quarter of 2026. Flow rates for the general unsecured loans and secured loans the Company had enabled were 1.2% and 1.1% respectively in the third quarter of 2026, as compared to 1.0% and 0.9% respectively in the second quarter of 2026.
  • Days past due (“DPD”) 30+ delinquency rate[3] for the total loans the Company had enabled, excluding the consumer finance subsidiary, was 5.5% as of September 30, 2026, as compared to 5.8% as of June 30, 2026. DPD 30+ delinquency rate for general unsecured loans was 5.6% as of September 30, 2026, as compared to 6.1% as of June 30, 2026. DPD 30+ delinquency rate for secured loans remained flat at 5.0% as of September 30, 2026, as compared to 5.0% as of June 30, 2026.
  • DPD 90+ delinquency rate[4] for total loans enabled, excluding the consumer finance subsidiary, was 3.2% as of September 30, 2026, as compared to 3.7% as of June 30, 2026. DPD 90+ delinquency rate for general unsecured loans was 3.3% as of September 30, 2026, as compared to 3.9% as of June 30, 2026. DPD 90+ delinquency rate for secured loans was 2.9% as of September 30, 2026, as compared to 3.1% as of June 30, 2026.
  • As of September 30, 2026, the non-performing loan (NPL) ratio[5] for consumer finance loans was 1.3% as compared to 1.3% as of June 30, 2026.

[1] The take rate of retail credit enablement business is calculated by dividing the aggregated amount of loan enablement service fees, post-origination service fees, net interest income (excluding revenue from Ping An Digital Bank and LU-AN credit subsidiaries), guarantee income and the penalty fees and account management fees by the average outstanding balance of loans enabled for each period.

[2] C-M3 flow rate estimates the percentage of current loans that will become non-performing at the end of three months, and is defined as the product of (i) the loan balance that is overdue from 1 to 29 days as a percentage of the total current loan balance of the previous month, (ii) the loan balance that is overdue from 30 to 59 days as a percentage of the loan balance that was overdue from 1 to 29 days in the previous month, and (iii) the loan balance that is overdue from 60 to 89 days as a percentage of the loan balance that was overdue from 30 days to 59 days in the previous month. Loans from legacy products and consumer finance subsidiary are excluded from the flow rate calculation.

[3] DPD 30+ delinquency rate refers to the outstanding balance of loans for which any payment is 30 to 179 calendar days past due divided by the outstanding balance of loans. Loans from legacy products, consumer finance subsidiary, Ping An Digital Bank and LU-AN credit subsidiaries and referral product are excluded from the calculation.

[4] DPD 90+ delinquency rate refers to the outstanding balance of loans for which any payment is 90 to 179 calendar days past due divided by the outstanding balance of loans. Loans from legacy products, consumer finance subsidiary, Ping An Digital Bank and LU-AN credit subsidiaries and referral product are excluded from the calculation.

[5] Non-performing loan ratio for consumer finance loans is calculated by using the outstanding balance of consumer finance loans for which any payment is 91 or more calendar days past due and not written off, and certain restructured loans, divided by the outstanding balance of consumer finance loans.

“Trading in our ordinary shares on the Hong Kong Stock Exchange resumed on September 24, 2026, and we thank our shareholders and the broader investor community for their patience and support,” said Mr. Xiang Ji, Chief Executive Officer of Lufax. “In response to the challenging environment, we continued to apply our selective customer strategy, exited certain high-risk customer segments, and adjusted our post-loan collection approach. Our DPD 30+ and DPD 90+ delinquency rates declined sequentially, while our C-M3 flow rate rose to 1.2%.”

“Consumer finance remained our main growth driver, with new consumer finance loan sales up by 25.2% year over year, supporting overall new loan sales growth of 2.5% year over year to RMB58.3 billion. Going forward, we will remain prudent in our operations, focused on quality growth, and committed to delivering long-term value to our shareholders.”

“Our net loss for the third quarter was RMB1,494 million, compared to RMB380 million in the same period of 2025,” said Ms. Jia Liu, Chief Financial Officer of Lufax. “The increase reflected higher credit impairment losses and additional income tax expenses, primarily due to a reduction of deferred tax assets and recognition of additional withholding taxes in connection with the satisfaction of the funding needs of our Company and its overseas subsidiaries through dividend distribution from domestic subsidiaries. This was partially offset by continued cost discipline, with expenses excluding credit impairment losses, finance costs and other gains or losses down by 13.4% year over year. We remain focused on disciplined execution, strengthening our governance and controls, and building a sustainable, higher-quality growth path for Lufax.”

Third Quarter 2026 Financial Results

TOTAL INCOME

Total income was RMB6,180 million (US$922 million) in the third quarter of 2026, compared to RMB6,479 million in the same period of 2025, representing a decrease of 4.6%.

Three Months Ended September 30,

(In millions except percentages,
unaudited)

2025

2026

YoY

RMB

% of income

RMB

% of income

Technology platform-based income

1,390

21.5 %

1,055

17.1 %

(24.1 %)

Net interest income

3,334

51.5 %

3,677

59.5 %

10.3 %

Guarantee income

1,353

20.9 %

1,020

16.5 %

(24.6 %)

Other income

268

4.1 %

167

2.7 %

(37.7 %)

Investment income

134

2.1 %

261

4.2 %

94.8 %

Total income

6,479

100.0 %

6,180

100.0 %

(4.6 %)

  • Technology platform-based income was RMB1,055 million (US$157 million) in the third quarter of 2026, compared to RMB1,390 million in the same period of 2025, representing a decrease of 24.1%. This decrease was primarily due to the decrease of retail credit and enablement service fees as a result of the decrease in the new loan sales and outstanding balance of off-balance sheet loans.
  • Net interest income was RMB3,677 million (US$548 million) in the third quarter of 2026, compared to RMB3,334 million in the same period of 2025, representing an increase of 10.3%, mainly due to the expansion of our consumer finance and microloan lending business.
  • Guarantee income was RMB1,020 million (US$152 million) in the third quarter of 2026, compared to RMB1,353 million in the same period of 2025, representing a decrease of 24.6%, primarily attributable to a decrease in the average balance of off-balance sheet loans and average fee rates.
  • Other income was RMB167 million (US$25 million) in the third quarter of 2026, compared to other income of RMB268 million in the same period of 2025. This decrease was primarily due to a decrease in account management fees caused by decreased collections in the third quarter of 2026.
  • Investment income was RMB261 million (US$39 million) in the third quarter of 2026, compared to RMB134 million in the same period of 2025. This increase was primarily attributable to the impact of changes in the valuations of certain assets.

TOTAL EXPENSES

Total expenses increased by 1.7% to RMB6,901 million (US$1,029 million) in the third quarter of 2026 from RMB6,785 million in the same period of 2025. This increase was mainly due to the increase in credit impairment losses by 10.3% to RMB4,511 million (US$673 million) in the third quarter of 2026 from RMB4,089 million in the same period of 2025, partially offset by the decrease in sales and marketing expenses by 13.7% to RMB842 million (US$126 million) in the third quarter of 2026 from RMB976 million in the same period of 2025 and the decrease in operation and servicing expenses by 16.1% to RMB774 million (US$115 million) in the third quarter of 2026 from RMB922 million in the same period of 2025. Total expenses excluding credit impairment losses, finance costs and other gains or losses – net decreased by 13.4% to RMB2,262 million (US$337 million) in the third quarter of 2026 from RMB2,613 million in the same period of 2025.

Three Months Ended September 30,

(In millions except percentages, unaudited)

2025

2026

YoY

RMB

% of income

RMB

% of income

Sales and marketing expenses

976

15.1 %

842

13.6 %

(13.7 %)

General and administrative expenses

478

7.4 %

420

6.8 %

(12.1 %)

Operation and servicing expenses

922

14.2 %

774

12.5 %

(16.1 %)

Technology and analytics expenses

236

3.6 %

226

3.7 %

(4.2 %)

Credit impairment losses

4,089

63.1 %

4,511

73.0 %

10.3 %

Finance costs

73

1.1 %

122

2.0 %

67.1 %

Other gains or losses – net

10

0.2 %

5

0.1 %

(50.0 %)

Total expenses

6,785

104.7 %

6,901

111.7 %

1.7 %

  • Sales and marketing expenses decreased by 13.7% to RMB842 million (US$126 million) in the third quarter of 2026 from RMB976 million in the same period of 2025. The decrease was primarily due to the decreased outstanding balance of off-balance sheet loans.
  • General and administrative expenses decreased by 12.1% to RMB420 million (US$63 million) in the third quarter of 2026 from RMB478 million in the same period of 2025. This decrease was primarily due to our continuous expense optimization and control measures.
  • Operation and servicing expenses decreased by 16.1% to RMB774 million (US$115 million) in the third quarter of 2026 from RMB922 million in the same period of 2025, primarily due to our expense control measures and the decrease in the loan balance.
  • Technology and analytics expenses decreased by 4.2% to RMB226 million (US$34 million) in the third quarter of 2026 from RMB236 million in the same period of 2025, primarily due to expense control measures we adopted.
  • Credit impairment losses increased by 10.3% to RMB4,511 million (US$673 million) in the third quarter of 2026 from RMB4,089 million in the same period of 2025, primarily due to the increase in the actual losses and provision of loans and receivables.
  • Finance costs increased by 67.1% to RMB122 million (US$18 million) in the third quarter of 2026 from RMB73 million in the same period of 2025, mainly due to the decrease in deposit interest income, partially offset by the decrease in loan interest expenses.
  • Other losses were RMB5 million (US$1 million) in the third quarter of 2026, compared to other losses of RMB10 million in the same period of 2025. The change was primarily due to the combined effects of the increase in foreign exchange gains in 2026 and a decrease in government subsidies.

INCOME TAX EXPENSE

Income tax expenses increased by 946.5% from RMB74 million in the third quarter of 2025  to RMB773 million (US$115 million) in the third quarter of 2026. The increase was primarily due to the recognized additional tax expenses resulting from the reduction of deferred tax assets, based on the Company’s current assessment of the overall business operation and financial performance of the certain subsidiary of the Company, and additional withholding tax recognized in the third quarter of 2026.

NET LOSS

Net loss was RMB1,494 million (US$223 million) in the third quarter of 2026, compared to a net loss of RMB380 million in the same period of 2025, as a result of the aforementioned factors.

LOSS PER ADS

Basic and diluted loss per American Depositary Share (“ADS”) were both RMB1.78 (US$0.27) in the third quarter of 2026. Each ADS represents two ordinary shares.

BALANCE SHEET

The Company had RMB21,247 million (US$3,169 million) in cash at bank as of September 30, 2026, as compared to RMB22,086 million as of December 31, 2025. Net assets of the Company amounted to RMB79,982 million (US$11,930 million) as of September 30, 2026, as compared to RMB82,041 million as of December 31, 2025.

Changes to Internal Control Improvement Committee Composition

The board of directors of the Company has approved changes to the composition of the Internal Control Improvement Committee, which is the Special Committee established by the board of directors announced in April 2025 to assume responsibility for implementing the improvement of the Company’s internal control system, effective October 28, 2026. Mr. Dicky Peter Yip has stepped down as chairperson and a member of the Internal Control Improvement Committee and will continue to serve as the chairman of Board and a director of the Company. Mr. Siu Hong Cheng, a current member of the Internal Control Improvement Committee, has been appointed as chairperson of the Internal Control Improvement Committee, and Mr. Xiang Ji, a director and the chief executive officer of the Company, has been appointed as a member of the Internal Control Improvement Committee.

Conference Call Information

The Company’s management will hold an earnings conference call at 9:00 P.M. U.S. Eastern Time on Tuesday, October 27, 2026 (9:00 A.M. Beijing Time on Wednesday, October 28, 2026) to discuss the financial results. For participants who wish to join the call, please complete online registration using the link provided below in advance of the conference call. Upon registering, each participant will receive a set of participant dial-in numbers, the event passcode, and a unique access PIN, which can be used to join the conference call.

Registration Link: https://dpregister.com/sreg/10212714/1051ae54b60

A live and archived webcast of the conference call will also be available at the Company’s investor relations website at https://ir.lufaxholding.com.

The replay will be accessible through November 3, 2026, by dialing the following numbers:

United States:  

1-855-669-9658

International:  

1-412-317-0088

Conference ID: 

5224502

About Lufax

Lufax is a leading financial services enabler for small business owners in China. The Company offers financing products designed principally to address the needs of small business owners and others. In doing so, the Company has established relationships with over 85 financial institutions in China as funding partners, many of which have worked with the Company for over three years.

Exchange Rate Information

This announcement contains translations of certain RMB amounts into U.S. dollars at a specified rate solely for the convenience of the reader. Unless otherwise noted, all translations from RMB to U.S. dollars are made at a rate of RMB6.7045 to US$1.00, the rate in effect as of September 30, 2026, as certified for customs purposes by the Federal Reserve Bank of New York.

Safe Harbor Statement

This announcement contains forward-looking statements. These statements are made under the “safe harbor” provisions of the United States Private Securities Litigation Reform Act of 1995. These forward-looking statements can be identified by terminology such as “will,” “expects,” “anticipates,” “future,” “intends,” “plans,” “believes,” “estimates” and similar statements. Statements that are not historical facts, including statements about Lufax’s beliefs and expectations, are forward-looking statements. Lufax has based these forward-looking statements largely on its current expectations and projections about future events and financial trends, which involve known or unknown risks, uncertainties and other factors, all of which are difficult to predict and many of which are beyond the Company’s control. These forward-looking statements include, but are not limited to, statements about Lufax’s goals and strategies; Lufax’s future business development, financial condition and results of operations; expected changes in Lufax’s income, expenses or expenditures; expected growth of the retail credit enablement; Lufax’s expectations regarding demand for, and market acceptance of, its services; Lufax’s expectations regarding its relationship with borrowers, platform investors, funding sources, product providers and other business partners; general economic and business conditions; and government policies and regulations relating to the industry Lufax operates in. Forward-looking statements involve inherent risks and uncertainties. Further information regarding these and other risks is included in Lufax’s filings with the U.S. Securities and Exchange Commission. All information provided in this press release is as of the date of this press release, and Lufax does not undertake any obligation to update any forward-looking statement, except as required under applicable law.

Investor Relations Contact
Lufax Holding Ltd
Email: Investor_Relations@lu.com

ICR, LLC
Robin Yang
Tel: +1 (646) 308-0546
Email: lufax.ir@icrinc.com 


LUFAX HOLDING LTD

UNAUDITED INTERIM CONDENSED CONSOLIDATED INCOME STATEMENTS

 (All amounts in thousands, except share data, or otherwise noted)

Three Months Ended September 30,

Nine Months Ended September 30,

2025

2026

2025

2026

RMB

RMB

USD

RMB

RMB

USD

Technology platform-based
income

1,390,314

1,054,875

157,338

4,276,862

3,193,881

476,379

Net interest income

3,333,645

3,676,532

548,368

9,738,322

10,615,303

1,583,310

Guarantee income

1,353,383

1,020,245

152,173

4,169,353

3,361,471

501,375

Other income

267,677

166,653

24,857

975,859

712,301

106,242

Investment income

133,951

261,351

38,981

1,402,823

785,857

117,213

Total income

6,478,970

6,179,656

921,718

20,563,219

18,668,813

2,784,520

Sales and marketing expenses

(976,296)

(842,238)

(125,623)

(3,045,254)

(2,544,336)

(379,497)

General and administrative
expenses

(478,189)

(420,187)

(62,672)

(1,474,887)

(953,355)

(142,196)

Operation and servicing expenses

(922,462)

(773,989)

(115,443)

(2,971,279)

(2,541,328)

(379,048)

Technology and analytics
expenses

(235,913)

(225,839)

(33,685)

(710,252)

(653,334)

(97,447)

Credit impairment losses

(4,089,048)

(4,511,494)

(672,905)

(11,947,259)

(13,165,732)

(1,963,716)

Finance costs

(72,886)

(121,705)

(18,153)

(155,566)

(351,386)

(52,410)

Other gains/(losses) – net

(9,821)

(5,362)

(800)

(73,407)

134,038

19,992

Total expenses

(6,784,615)

(6,900,814)

(1,029,281)

(20,377,904)

(20,075,433)

(2,994,322)

Profit before income tax
expenses

(305,645)

(721,158)

(107,563)

185,315

(1,406,620)

(209,802)

Income tax expenses

(73,859)

(772,928)

(115,285)

(1,083,794)

(781,735)

(116,599)

Net profit/(loss) for the period

(379,504)

(1,494,086)

(222,848)

(898,479)

(2,188,355)

(326,401)

Net profit/(loss) attributable to:

Owners of the Group

(425,445)

(1,535,438)

(229,016)

(1,192,680)

(2,431,327)

(362,641)

Non-controlling interests

45,941

41,352

6,168

294,201

242,972

36,240

Net profit/(loss) for the period

(379,504)

(1,494,086)

(222,848)

(898,479)

(2,188,355)

(326,401)

Earnings/(losses) per share

-Basic earnings/(losses) per share

(0.25)

(0.89)

(0.13)

(0.69)

(1.40)

(0.21)

-Diluted earnings/(losses) per
share

(0.25)

(0.89)

(0.13)

(0.69)

(1.40)

(0.21)

-Basic earnings/(losses) per ADS

(0.50)

(1.78)

(0.27)

(1.38)

(2.80)

(0.42)

-Diluted earnings/(losses) per
ADS

(0.50)

(1.78)

(0.27)

(1.38)

(2.80)

(0.42)


LUFAX HOLDING LTD

UNAUDITED INTERIM CONDENSED CONSOLIDATED STATEMENTS OF FINANCIAL POSITION

 (All amounts in thousands, except share data, or otherwise noted)

As of December 31,

As of September 30,

2025

2026

RMB

RMB

USD

Assets

Cash at bank

22,086,187

21,247,389

3,169,124

Restricted cash

19,035,154

15,863,007

2,366,024

Financial assets at fair value through profit or loss

34,666,573

34,187,377

5,099,169

Financial assets at fair value through other comprehensive income

6,182,229

5,594,278

834,406

Financial assets at amortized cost

–

2,100,817

313,344

Financial assets held under resale agreements

1,577,029

–

–

Accounts and other receivables and contract assets

4,240,132

3,206,757

478,299

Loans to customers

102,290,974

106,679,269

15,911,592

Deferred tax assets

6,978,651

7,604,925

1,134,302

Property and equipment

54,137

49,667

7,408

Intangible assets

911,603

903,738

134,796

Right-of-use assets

265,523

205,391

30,635

Goodwill

9,169,031

9,156,255

1,365,688

Other assets

657,424

768,248

114,587

Total assets

208,114,647

207,567,118

30,959,373

Liabilities

Payable to platform investors

667,794

508,046

75,777

Borrowings

63,535,913

72,590,390

10,827,115

Customer deposits

9,456,934

11,585,970

1,728,089

Current income tax liabilities

396,643

482,171

71,918

Accounts and other payables and contract liabilities

7,557,062

6,749,477

1,006,708

Payable to investors of consolidated structured entities

28,921,222

20,053,410

2,991,037

Financing guarantee liabilities

5,647,343

4,976,520

742,266

Deferred tax liabilities

297,931

453,185

67,594

Lease liabilities

259,764

199,878

29,813

Convertible promissory notes payable

6,503,803

6,580,590

981,518

Financial assets sold under repurchase agreements

1,662,008

2,278,794

339,890

Other liabilities

1,167,155

1,126,958

168,090

Total liabilities

126,073,572

127,585,389

19,029,814

Equity

Share capital

117

117

17

Share premium

27,027,931

27,027,931

4,031,312

Treasury shares

(5,642,768)

(5,642,768)

(841,639)

Other reserves

1,746,502

1,875,678

279,764

Retained earnings

56,698,381

54,267,053

8,094,124

Total equity attributable to owners of the Company

79,830,163

77,528,011

11,563,578

Non-controlling interests

2,210,912

2,453,718

365,981

Total equity

82,041,075

79,981,729

11,929,559

Total liabilities and equity

208,114,647

207,567,118

30,959,373


LUFAX HOLDING LTD

UNAUDITED INTERIM CONDENSED CONSOLIDATED STATEMENTS OF CASH FLOWS

 (All amounts in thousands, except share data, or otherwise noted)

Three Months Ended September 30,

Nine Months Ended September 30,

2025

2026

2025

2026

RMB

RMB

USD

RMB

RMB

USD

Net cash generated from/(used in)
operating activities

3,086,920

(224,805)

(33,530)

8,496,049

(800,698)

(119,427)

Net cash (used in)/generated from
investing activities

(8,682,544)

672,023

100,235

(11,492,622)

2,176,993

324,706

Net cash generated from financing
activities

4,923,413

2,273,224

339,059

3,764,245

314,181

46,861

Effects of exchange rate changes on
cash and cash equivalents

(4,423)

(21,472)

(3,203)

(22,118)

(66,676)

(9,945)

Net (decrease)/increase in cash and
cash equivalents

(676,634)

2,698,970

402,561

745,554

1,623,800

242,196

Cash and cash equivalents at the
beginning of the period

13,220,623

10,013,903

1,493,609

11,798,435

11,089,073

1,653,975

Cash and cash equivalents at the end
of the period

12,543,989

12,712,873

1,896,170

12,543,989

12,712,873

1,896,170