Home Blog Page 1143

First Phosphate Receives Conditional Approval for up to $16.7 Million Non-Repayable Contribution from the Government of Canada

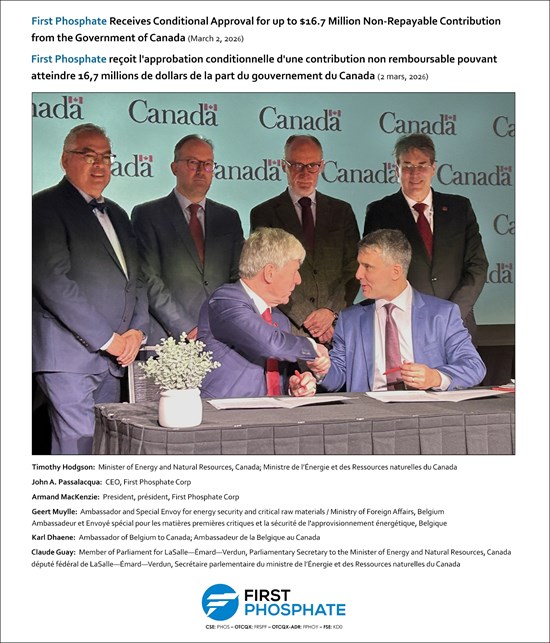
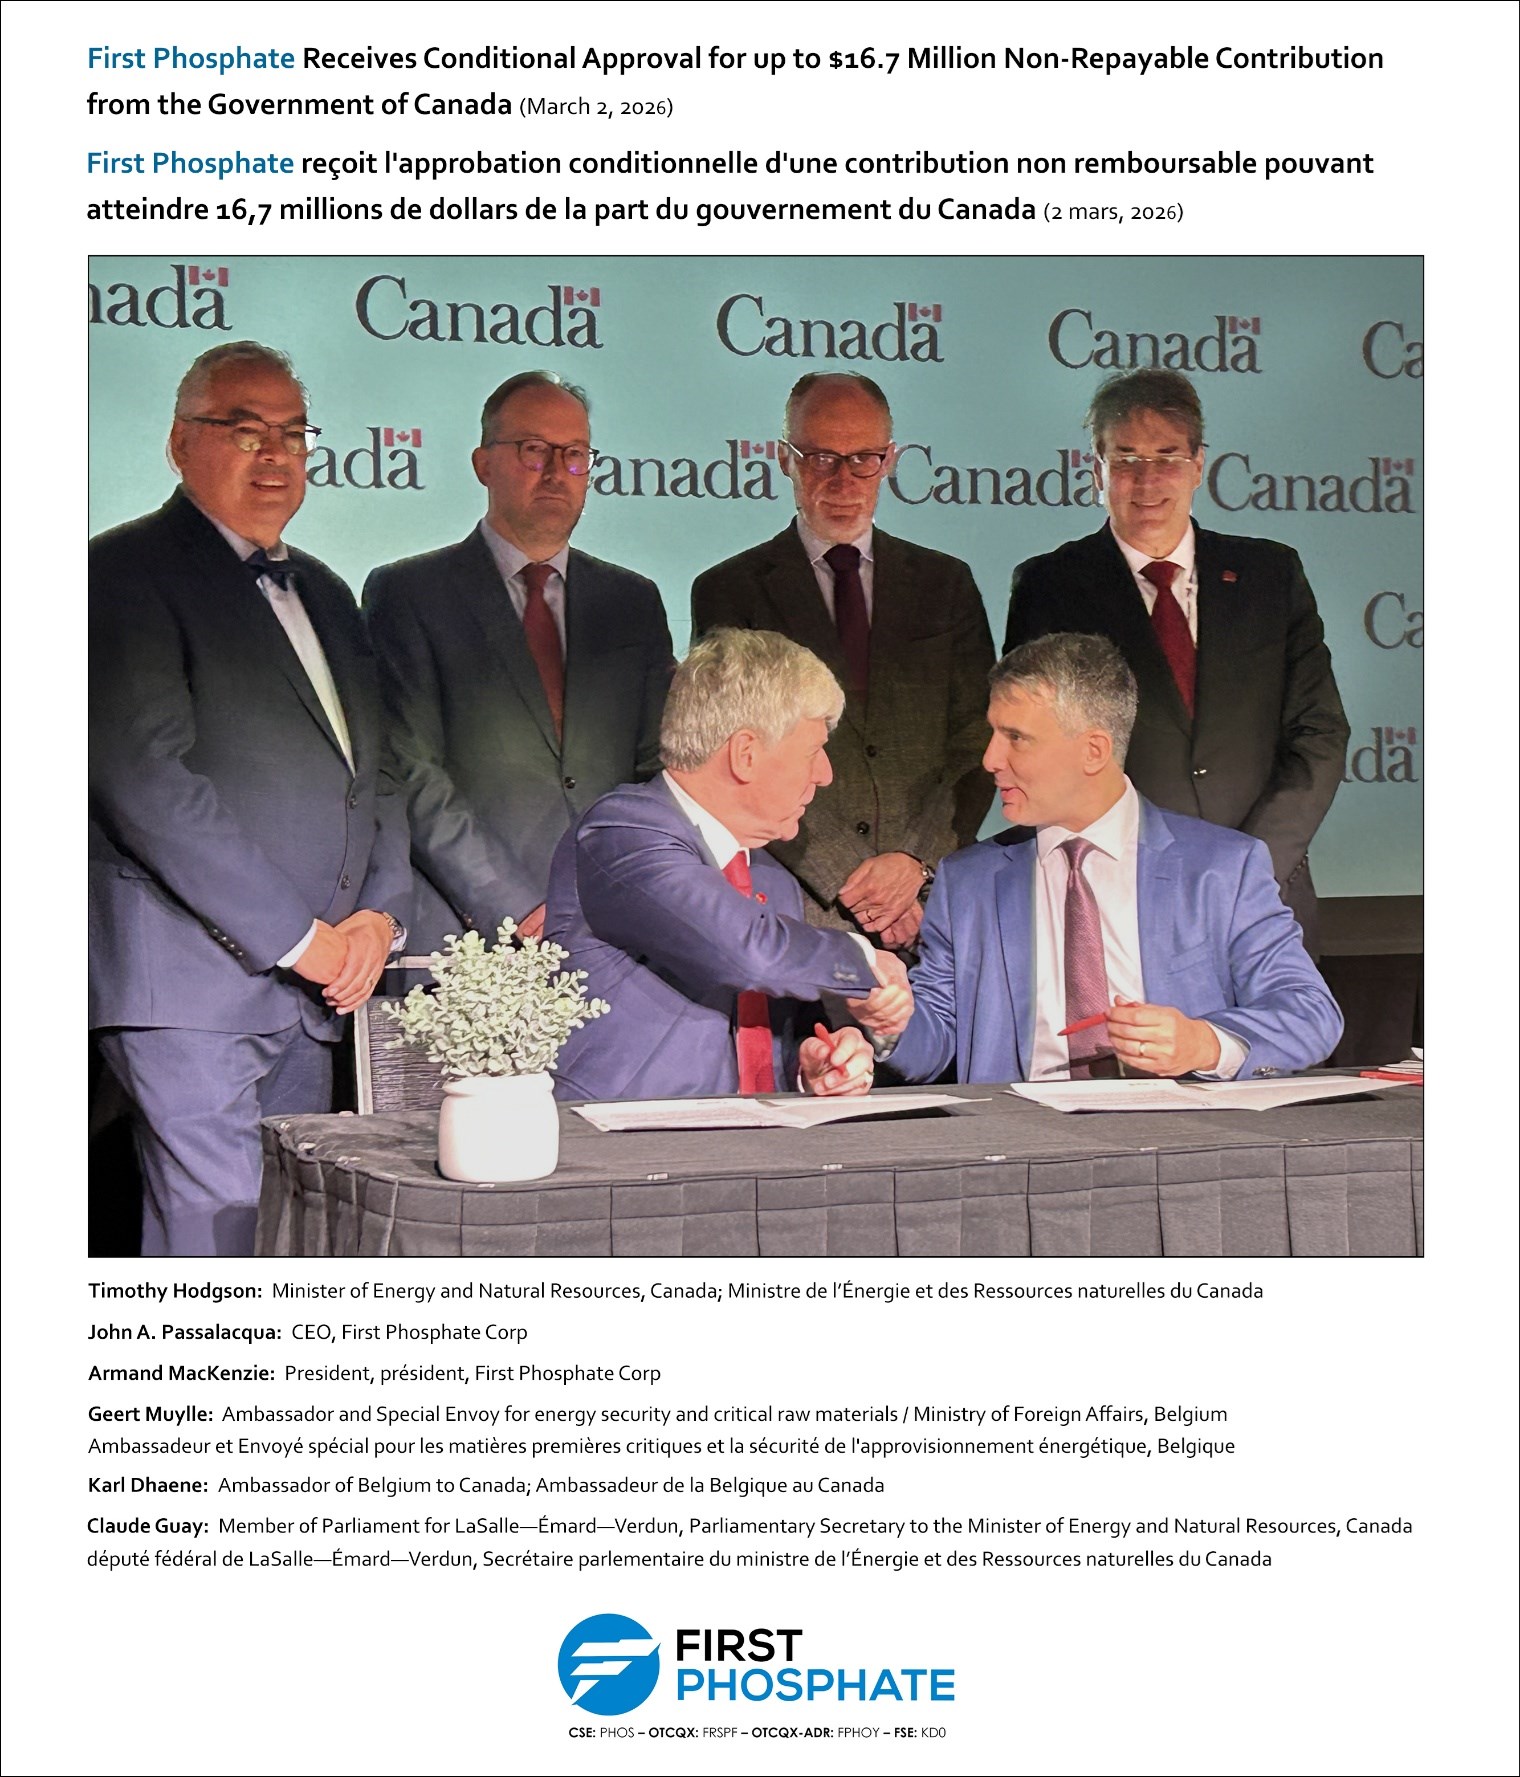
Saguenay, Québec – Newsfile Corp. – March 2, 2026 – First Phosphate Corp. (CSE: PHOS) (OTCQX: FRSPF) (OTCQX ADR: FPHOY) (FSE: KD0) (“First Phosphate” or the “Company“) has been conditionally approved for a non-repayable contribution agreement for up to C$16.7 million with the Government of Canada through Natural Resources Canada (“NRCan”) under the Global Partnerships Initiative (“GPI”).

This contribution funded by the Government of Canada will be deployed to assess the technical and engineering parameters – including processing circuits and equipment – needed to validate the ability to produce a phosphate concentrate that meets the quality requirements of the lithium iron phosphate (“LFP”) battery market. The work will be conducted based on the parameters established under the contract between First Phosphate and its definitive offtaker.

“Canada and our partners are putting real capital behind the secure and resilient critical mineral supply chains that our economies and defence industries rely on,” said The Honourable Tim Hodgson, Minister of Energy and Natural Resources. “By supporting companies like First Phosphate, we are helping deliver the minerals the world needs and the prosperity and security Canadians deserve.”

“This financial support of the Government of Canada represents an important lever for the continuation of our development work,” stated Armand MacKenzie, President of First Phosphate. “This contribution enables us to carry out detailed work aimed at validating LFP application requirements and the expectations of our offtakers and international partners.”

The development work will help strengthen Canada’s strategic positioning within the LFP battery value chain through the development of domestic capacity to process apatite (phosphate concentrate) into high-purity phosphoric acid (“PPA”) for battery applications.

The project will develop a scalable Canadian process for the production of battery-grade phosphate concentrate, reducing dependence on foreign supply chains.

The activities will contribute to significant economic benefits, including the creation of skilled jobs and the potential establishment of a Canadian phosphoric acid facility supported by local commercial production of phosphate concentrate.

The financial contribution is granted for the completion of a study of the Company’s integrated phosphate concentrate project in Saguenay-Lac-Saint-Jean and covers eligible activities planned through 2028, in accordance with the terms of the agreement. It forms part of an initiative to support industrial collaboration and the integration of Canadian projects into international supply chains for battery materials.

To view an enhanced version of this graphic, please visit:
https://images.newsfilecorp.com/files/8917/285984_19c5995ee4b229ba_001full.jpg

Qualified Person

The scientific and technical disclosure for First Phosphate included in this news release has been reviewed and approved by Gilles Laverdière, P.Geo. Mr. Laverdière is Chief Geologist of First Phosphate and a Qualified Person under National Instrument 43-101 – Standards of Disclosure of Mineral Projects (“NI 43-101”).

About Natural Resources Canada

Natural Resources Canada (“NRCan”) is the federal department responsible for developing policies and programs to ensure the sustainable and responsible development of Canada’s natural resources. Through its initiatives and funding programs, including the International Partnerships Program, NRCan supports projects that contribute to strengthening supply chains, industrial innovation, and Canada’s competitiveness in the critical and strategic minerals sectors.

About First Phosphate Corp

First Phosphate (CSE: PHOS) (OTCQX: FRSPF) (OTCQX ADR: FPHOY) (FSE: KD0) is a mineral exploration and development and clean technology company dedicated to building and reshoring a vertically integrated mine-to-market supply chain for the production of LFP batteries in North America. Target markets include energy storage, data centers, robotics, mobility, and national security.

First Phosphate’s flagship Bégin-Lamarche property, located in Saguenay-Lac-Saint-Jean, Québec, Canada, represents a rare North American igneous phosphate resource producing high-purity phosphate characterized by very low levels of impurities.

For further information, please contact:

Armand MacKenzie
President
armand@firstphosphate.com
Tel: +1 (514) 618-5289

Investor Relations: investor@firstphosphate.com
Media Relations: media@firstphosphate.com
Website: www.FirstPhosphate.com

Follow First Phosphate:

X: https://x.com/FirstPhosphate
LinkedIn: https://www.linkedin.com/company/first-phosphate

Forward-Looking Information and Cautionary Statements

This release includes certain statements that may be deemed “forward-looking information”. Any statement that discusses predictions, expectations, beliefs, plans, projections, objectives, assumptions, future events or performance (often but not always using phrases such as “expects”, or “does not expect”, “is expected”, “anticipates” or “does not anticipate”, “plans”, “budget”, “scheduled”, “forecasts”, “estimates”, “believes” or “intends” or variations of such words and phrases or stating that certain actions, events or results “may” or “could”, “would”, “might” or “will” be taken to occur or be achieved) are not statements of historical fact and may be forward-looking information. In particular, this press release contains forward-looking information relating to, among other things: the execution and final terms of a written contribution agreement to be entered into among the parties and the Company’s compliance with the terms thereof; the funding amount, anticipated benefits, timing, and potential outcomes of the GPI funding award under the contribution agreement with NRCan and the project funded thereby including, but not limited to, the strengthening of Canada’s strategic positioning within the LFP battery value chain, the development of domestic capacity to process apatite into high-purity PPA for battery applications, the development of a scalable Canadian process for the production of battery-grade phosphate concentrate, the reduction of dependence on foreign supply chains, and the contribution to significant economic benefits, including the creation of skilled jobs and the potential establishment of a Canadian phosphoric acid facility; and the Company’s plans for building and onshoring a vertically integrated mine-to-market LFP battery supply chain for North America. Although the Company believes the expectations expressed in such forward-looking statements are based on reasonable assumptions, such statements are not guarantees of future performance and actual results or developments may differ materially from those forward-looking statements. Factors that could cause actual results to differ materially from those in forward-looking statements include development and exploration successes, continued availability of capital and financing, and general economic, market or business conditions. These statements are based on a number of assumptions including, among other things, assumptions regarding general business and economic conditions; there being no significant disruptions affecting the activities of the Company or inability to access required project inputs; permitting and development of the projects being consistent with the Company’s expectations; the accuracy of the current mineral resource estimates for the Company and results of metallurgical testing; certain price assumptions for P2O5 and Fe2O3; inflation and prices for Company project inputs being approximately consistent with anticipated levels; the Company’s relationship with First Nations and other Indigenous parties remaining consistent with the Company’s expectations; the Company’s relationship with other third party partners and suppliers remaining consistent with the Company’s expectations; and government relations and actions being consistent with Company expectations. Investors are cautioned that any such statements are not guarantees of future performance and actual results or developments may differ materially from those projected in the forward-looking statements. Accordingly, readers should not place undue reliance on the forward-looking information contained in this press release. The Company does not assume any obligation to update or revise its forward-looking statements, whether because of new information, future events or otherwise, except as required by applicable law. All forward-looking information contained in this release is qualified by these cautionary statements.

The issuer is solely responsible for the content of this announcement.

Doubleview Gold Corp. Announces Positive Preliminary Economic Assessment for the Hat Project; Robust Base-Case Economics with Strategic Scandium Upside

NPV:

  • After-tax NPV(5%) of C$6.73 billion and IRR of 23% at Consensus Metal Prices
  • After-tax NPV(5%) of C$13.53 billion and IRR of 39% at Spot Metal Prices.

NPV Including scandium and the associated processing circuit:

  • After-tax NPV(5%) of C$6.94 billion an IRR of 19% at Consensus Metal Prices
  • After-tax NPV(5%) of C$14.52 billion and IRR of 32% at Spot Metal Prices.

Vancouver, British Columbia–(Newsfile Corp. – March 2, 2026) – Doubleview Gold Corp (TSXV: DBG) (OTCQB: DBLVF) (FSE: 1D4) (“Doubleview” or the “Company”) is pleased to announce the results of its Preliminary Economic Assessment (PEA) of its 100%-owned polymetallic Hat porphyry project (“Hat” or “the Project”), in northwestern British Columbia. With major content of copper, gold, cobalt, silver, and scandium, Hat becomes an important source of critical minerals.

Three processing scenarios were evaluated-Scenario A1 (A1) a Cu-Au-Ag-Co flotation base case using current testwork recoveries[1], Scenario A2 (A2), the same base case using expected recoveries1, and Scenario B (B), a Cu-Au-Ag-Co flowsheet with an added hydrometallurgical circuit and scandium recovery circuit-with results indicating the Project is financially attractive even without the scandium component.

Highlights:

  • Robust Project Economics: The PEA demonstrates a high-margin operation with an After-Tax NPV(5%) of C$4.96 billion (A1), C$6.73 billion (A2), or C$6.94 billion (B), and an IRR of 19% (A1), 23% (A2), or 19% (B) at analyst consensus metal prices[2]. Using a spot-price scenario[3], the Project delivers a compelling after-tax NPV(5%) of C$11.05 billion (A1), 13.53 billion (A2), or C$14.52 billion (B) and an IRR of 34% (A1), 39% (A2), or 32% (B).
  • Sensitivity Highlight: Project economics show the greatest leverage to overall metal prices, with NPV (5%) ranging from C$3.2 billion to C$10.2 billion (IRR: 14%-32%) at ±20% on all metals; even under additional +20% CAPEX and +20% OPEX sensitivities, applied on top of a 25% contingency already embedded in the base case, all scenarios deliver IRRs of 16% or better, and Scenario B provides additional scandium oxide upside with NPV(5%) of C$6.2 billion-C$7.7 billion (IRR: 18%-20%) at ±40% metal price.
  • Tier 1 Scale and Longevity: The mine plan supports a multi-decade life of 25 years at a 120,000 tonnes-per-day processing rate, underpinned by a resource base of 609 Mt at 0.43% CuEq[4] in the Measured and Indicated categories and 503 Mt at 0.41% CuEq4 in the Inferred category.
  • High-Output Production Profile B: Envisioned as a conventional large-scale open-pit operation, the Project is expected to produce an average of over 74 kt of copper, 254 koz of gold, 376 koz of silver and 2.7 kt of cobalt annually during the first 10 years, with life-of-mine (LOM) average production of 67.6 kt Cu, 217 koz Au, 348 koz Ag, 2.5 kt Co, and 128 tonnes of scandium oxide per year. (NOTE: projected cobalt to be about 68% of North America’s cobalt production based on 2024 production)
  • Strategic Importance for Critical Minerals: The Project is positioned as a primary North American source of copper, scandium, and cobalt. With approximately 2.42 billion pounds of copper, 80 million pounds of cobalt and 2,415 tonnes of scandium oxide contained[5] in the Measured and Indicated categories, the Project represents an important discovery of critical minerals.
  • Stable, Supportive Jurisdiction: Located in a premier mining district in British Columbia, the Project benefits from a stable regulatory environment. The Company is committed to engaging with local First Nations in a respectful manner and to working toward positive and constructive relationships as the Project advances.
  • Catalyst for Development: The PEA serves as the technical foundation for an immediate transition into a Pre-Feasibility Study (PFS), providing a clear roadmap for early works and permitting activities in 2026 and 2027.

Farshad Shirvani, President and CEO of Doubleview Gold Corp., commented, “The results of this PEA confirm the scale, strength and long-term potential of the Hat Project. Delivering a post-tax NPV(5%) of up to C$6.94 billion and IRR of up to 23% at consensus prices, and even stronger metrics at spot prices, validates years of disciplined exploration and technical work by our team. Hat is demonstrating Tier 1 characteristics with a 25-year mine life, strong annual production profile and meaningful free cash flow generation. Importantly, the Project stands on its own without reliance on scandium, while still preserving significant upside from critical minerals as markets mature. We are excited to advance Hat to Pre-Feasibility and continue building a major Canadian critical metals project.”

Doubleview acknowledges that the Project is located on the traditional territories of the Tahltan Nation and the Taku River Tlingit First Nation, and recognizes their enduring relationship to and stewardship of the land and waters. Doubleview is committed to respectful, transparent, and ongoing engagement with First Nations and local communities whose territories overlap the Project area and access routes, with a focus on protecting water and the environment and advancing responsible development.

PEA OVERVIEW

The PEA contemplates a conventional open-pit mine and processing operation with a 25-year mine life at a 120,000 t/d (42 Mt/a) plant throughput. Two processing pathways were evaluated, A1 and its alternative, A2, and B: the first alternative, A, is a Cu-Au-Ag-Co flotation concentrator with two recovery cases based on current metallurgical testwork, and A2, reflecting expected performance (Figure 1); and B, a full circuit that retains the base flowsheet and adds a downstream hydrometallurgical scandium recovery circuit (Figure 2).

The tailings storage facility is a centreline-raised facility built with compacted cycloned sand from tailings underflow, and engineered drainage for stability, with site-contact waters (including seepage and pit dewatering) recycled to the process plant and final closure involving pond drainage and reclamation. The Project is expected to rely on grid power via an extended transmission line.

Tables 1 to 3 summarize the key results of the PEA, including production, operating costs, capital expenditures, and the principal financial metrics; the sections that follow provide additional detail on the underlying assumptions, project design, and study outcomes.

Table 1: PEA Study Summary-Production

Metric Unit Scenario A1 Scenario A2 Scenario B
Mining Summary
Strip ratio t:t 1.60
Production Summary LOM
Average Annual Throughput Mt 42
CuEq Head Grade[6], [7] % 0.42
Cu Head Grade % 0.19
Au Head Grade g/t 0.19
Ag Head Grade g/t 0.51
Co Head Grade g/t 0.78
Sc Head Grade6 g/t 28.35
Cu Recovery % 80 89 85[8]
Au Recovery % 66 75 898
Ag Recovery % 53 53 688
Co Recovery % 30 30 788
Sc Recovery % N/A 728
Overall Mass of Tailings to Process[9] % N/A 12.5
Year of Production Start of Sc2O38 year N/A 4
Average Annual Cu Production kt 63.6 70.8 67.6
Total Cu Production kt 1,590.5 1,769.4 1,689.9
Average Annual Payable Cu kt 61.7 68.7 65.7
Total Payable Cu kt 1,542.8 1,716.3 1,642.2
Average Annual Au Production koz 161.1 183.1 217.3
Total Au Production koz 4,028.2 4,577.5 5,432.0
Average Annual Payable Au koz 153.1 173.9 207.5
Total Payable Au koz 3,826.8 4,348.7 5,188.6
Average Annual Ag Production koz 271.3 271.3 348.0
Total Ag Production koz 6781.6 6,781.6 8,700.9
Average Annual Payable Ag koz 244.1 244.1 318.6
Total Payable Ag koz 6,103.4 6,103.4 7,965.3
Average Annual Co Production kt 1.0 1.0 2.5
Total Co Production kt 23.9 23.9 62.2
Average Annual Payable Co kt 0.8 0.8 2.3
Total Payable Co kt 19.1 19.1 56.3
Average Annual Sc2O3 Production t N/A 128.4
Total Sc2O3 Production t N/A 3,209.5
Total Sc2O3 Payable t N/A 3,049.0

Table 2: PEA Study Summary-Operating Cost

Metric Unit Scenario A1 Scenario A2 Scenario B
Operating Cost
Average Mine Operating Costs C$/t-moved 2.32
Average Mine Operating Costs C$/t-milled 6.03
Processing Operating Cost[10] C$/t-milled 7.93 7.93 10.84
Sc2O3 Processing Cost[11] C$/kg Sc2O3 N/A 939.55
General & Administrative C$/t-milled 2.56 2.56 2.56
Total Operating Costs C$/t-milled 16.22 16.22 22.96

Table 3: PEA Study Summary-Capital Expenditure and Financial Metrics

Metric Unit Scenario A1 Scenario A2 Scenario B
Capital Expenditure
Initial Capital Costs C$M 3,552 3,601 3,828
Sustaining Capital Costs C$M 2,755 2,755 4,006
Closure and Reclamation Cost C$M 503
Financial Metrics
Exchange Rate CAD/USD 1.37
Long Term Copper Price US$/lb 4.88
Long Term Gold Price US$/oz 3,272.60
Long Term Silver Price US$/oz 50.22
Long Term Cobalt Price US$/lb 19.57
Long Term Scandium Oxide Price US$/kg N/A 1,500
Average Annual EBITDA C$M 886 1,071 1,242
Total EBITDA C$M 22,162 26,770 31,041
Average Annual Free Cash Flow (Pre-tax) C$M 756 940 1,061
Free Cash Flow (Pre-tax)[12] C$M 18,904 23,511 26,532
Total Provincial Tax (inc. BC Mineral Tax) C$M (4,029) (5,090) (5,772)
Total Federal Tax C$M (1,274) (1,859) (2,170)
Total Taxes C$M (5,303) (6,949) (7,942)
Average Annual Free Cash Flow (Post-tax) C$M 544 662 744
Free Cash Flow (Post-tax)12 C$M 13,601 16,562 18,591
Total Free Cash Flow (Pre-tax)[13] C$M 15,352 19,910 22,704
Total Free Cash Flow (Post-tax)12 C$M 10,050 12,961 14,763
NPV 5% (Pre-tax) C$M 7,883 10,576 11,043
NPV 5% (Pre-tax) US$M 5,754 7,720 8,061
IRR (Pre-tax) % 24 29 23
Payback (Pre-tax) years Year 5 Year 4 Year 6
NPV 5% (Post-tax) C$M 4,963 6,727 6,937
NPV 5% (Post-tax) US$M 3,623 4,911 5,064
IRR (Post-tax) % 19 23 19
Payback (Post-tax) Years Year 6 Year 5 Year 7

Table 4 shows the Sensitivity analysis using after-tax NPV(5%) and after-tax IRR.

Table 4: Sensitivity Analysis

Variable Case
(%)
Metal Price Scenario A1 Scenario A2 Scenario B
NPV (5%)
C$M
IRR
(%)
NPV (5%)
C$M
IRR
(%)
NPV (5%)
C$M
IRR
(%)
Base Case Consensus forecast 4,963 19 6,727 23 6,937 19
Copper Price -20 US$3.90/lb Cu 3,218 15 4,807 19 5,094 15
Copper Price +20 US$5.86/lb Cu 6,688 23 8,632 28 8,764 22
Gold Price -20 US$2,618.08/oz 3,625 16 5,223 19 5,201 16
Gold Price +20 US$3,927.12/oz 6,289 22 8,222 27 8,661 22
Metal Prices -20 All metal prices 1,708 10 3,165 14 2,650 11
Metal Prices +20 All metal prices 8,118 27 10,233 32 11,110 26
Initial CAPEX +20 Variable per Scenario 4,448 16 6,222 19 6,394 16
OPEX +20 Variable per Scenario 3,660 16 5,438 20 5,185 16
Scandium Oxide Price -40 US$900/kg Sc2O3 6,159 18
Scandium Oxide Price +40 US$2,100/kg Sc2O3 7,714 20

MINERAL RESOURCE ESTIMATE

Doubleview Gold Corp announced an update of the Mineral Resource estimate (MRE). This estimate followed the Micon International Ltd. (Micon) Mineral Resource estimate with an effective date of July 17, 2024. This MRE incorporates significant new data from the 2024 and 2025 exploration campaigns, with an effective date of February 4, 2026, and superseded the 2024 Micon estimate.

Table 5: Hat MRE at a 0.2% CuEq Cut-Off Effective February 4, 2026

Mineral
Resource
Classification
Tonnage
(Mt)
Average Grade Metal Content
CuEq
(%)
Cu
(%)
Au
(g/t)
Co
(g/t)
Ag
(g/t)
CuEq
(Blb)
Cu
(Blb)
Au
(Moz)
Co
(Mlb)
Ag
(Moz)
Measured 272 0.44 0.22 0.18 76.26 0.37 2.61 1.11 1.41 35.6 2.17
Indicated 337 0.43 0.21 0.19 76.81 0.39 3.21 1.31 1.81 44.5 2.88
Total M+I 609 0.43 0.21 0.18 76.57 0.38 5.82 2.42 3.22 80.1 5.05
Inferred 503 0.41 0.18 0.19 76.62 0.38 4.57 1.72 2.77 66.2 4.19

Table 6: Hat MRE at a 0.2% CuEq Cut-Off as of February 4, 2026, Scandium Oxide Resources

Mineral Resource
Classification
Tonnage
(Mt)
Sc Tonnage1
(Mt)
Average Grade
Sc (g/t)
Metal Content
Sc2O3 2 (t)
Measured 272 34 28.79 1,081
Indicated 337 42 28.76 1,334
Total M+I 609 76 28.77 2,415
Inferred 503 63 28.69 1,996

Notes:
1 Scandium tonnages represent 12.5% of the mineralized material by category, reflecting the proportion of tailings expected to be processed through a dedicated scandium leach circuit under current metallurgical design constraints.
2 Scandium oxide metal content have been calculated using the metallurgical recovery of 72% and conversion factor from Sc to Sc2O3 of 1.534.

  • Mineit’s Qualified Person, Tomasz Wawruch, FAusIMM, completed the MRE, and has reviewed and approved the technical disclosure related to the MRE contained in this news release. Mr. Wawruch is a senior geology and mineral resource consultant independent of Doubleview. Mr. Gilles Arseneau, PhD., P.Geo., of ARSENEAU Consulting Services Inc., provided an independent review of this MRE.
  • Mineral Resources that are not Mineral Reserves do not have demonstrated economic viability.
  • The estimate of Mineral Resources may be materially affected by environmental, permitting, legal, title, taxation, socio-political, marketing, or other relevant issues.
  • Inferred Mineral Resources are considered too speculative geologically to have economic considerations applied to them that would enable them to be categorized as Mineral Reserves.
  • The Mineral Resource Estimate was prepared in accordance with the Canadian Institute of Mining, Metallurgy and Petroleum (CIM) Definition Standards for Mineral Resources and Mineral Reserves (2014), and CIM MRMR Best Practice Guidelines (2019).
  • The effective date of the MRE is February 4, 2026.
  • Metal contents have been calculated using the following metallurgical recovery factors: Cu = 85%, Au = 89%, Co = 78%, and Ag = 68%.
  • Economic assumptions used include US4.80/lb Cu, US20.00/lb Co, US3,200/oz Au, US46/oz Ag, and a 2% NSR royalty.
  • Mineral Resources are reported within optimized open pit constraints and 0.2% CuEq cut-off grade, based on a C7.93/t milled processing cost and C2.90/t milled general and administrative cost, with a mining cost of C3.01/t plus incremental mining cost increasing by C0.015/t for every bench below the reference level of 1,125 mRL.
  • CuEq calculations do not include scandium. The formula used to calculate CuEq is: CuEq = [(((Ag × 46.0 × 0.68)/31.1035) + ((Au × 3200 × 0.89)/31.1035) + 0.0001 × (Co × 20.0 × 0.78 × 22.0462) + 0.0001 × (Cu × 4.8 × 22.0462 × 0.85))/(4.8 × 22.0462 × 0.85)], where all input variables are expressed in (ppm) and CuEq is expressed in percent (%).
  • Rounding may result in minor variations between individual values and totals; such differences are not considered material to the MRE.
  • Mineral Resource classification reflects the level of geological confidence and satisfies the uncertainty criteria appropriate for exploration and resource development. Additional drilling will be required to reduce uncertainty to the level expected for production planning.
  • The MRE reflects the geological interpretation, drill-hole spacing, and estimation parameters available at the time of modelling. Any additional drilling is expected to influence the current outcome by improving confidence in the estimates and refining the geometry of the mineralized domains.
  • The Mineral Resource results are presented in situ within the optimized pit. Mineralized material outside the pit has not been considered as a part of the current MRE tabulation. Calculations used metric units (metres, tonnes, g/t).
  • A total of 97 diamond drill holes, comprising 49,548 m of core, were incorporated into the Mineral Resource Estimate. All drilling data used in the MRE were subject to standard QA/QC validation prior to inclusion.

PROCESSING SCENARIOS
The PEA evaluates two processing scenarios: (A) a conventional Cu-Au-Ag-Co flotation concentrator at 120,000 t/d (42 Mt/a) with two recovery cases-A1 based on metallurgical testwork completed by Sepro Laboratories (Langley, BC) and A2 reflecting target/expected performance-and (B) a full circuit that retains the base flowsheet and adds a downstream hydrometallurgical scandium recovery circuit.

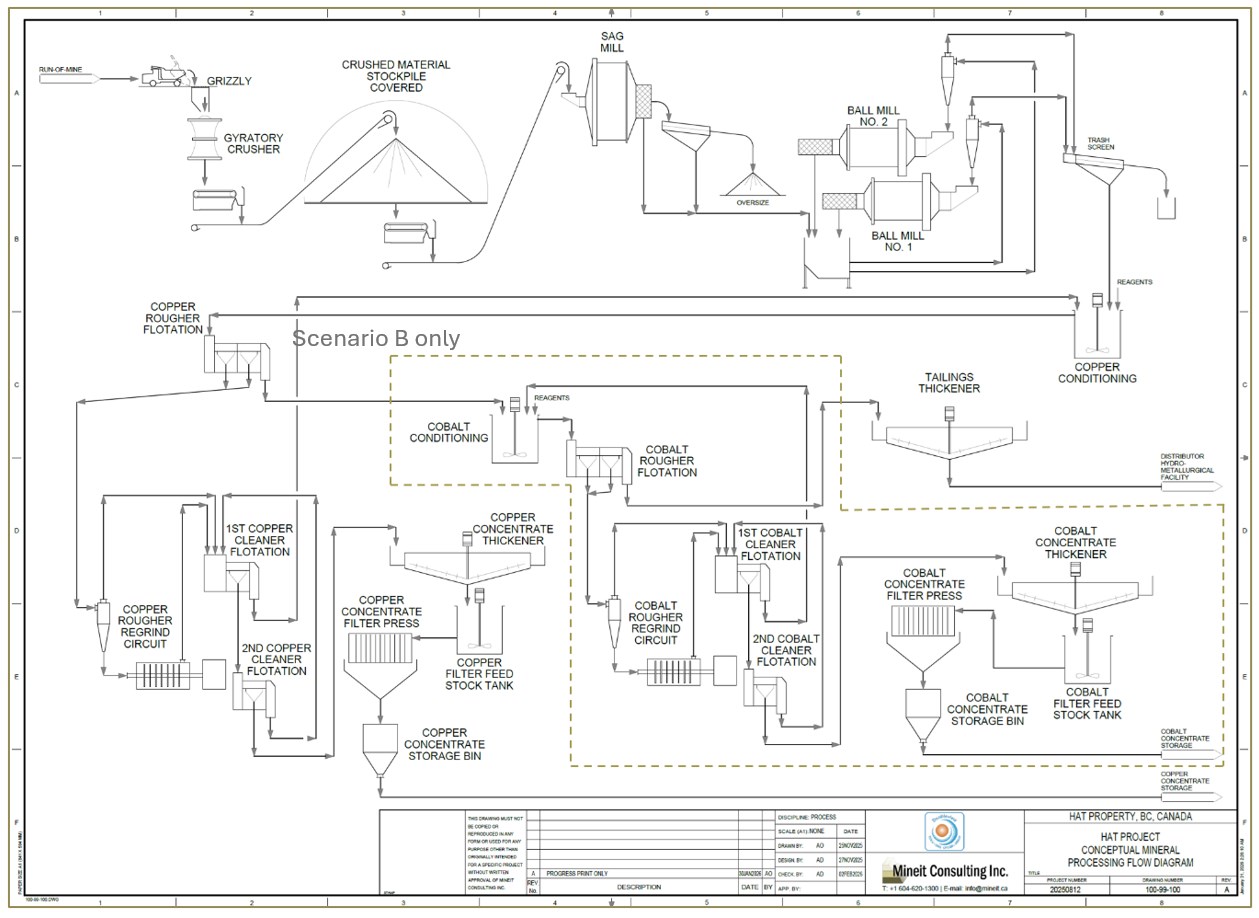
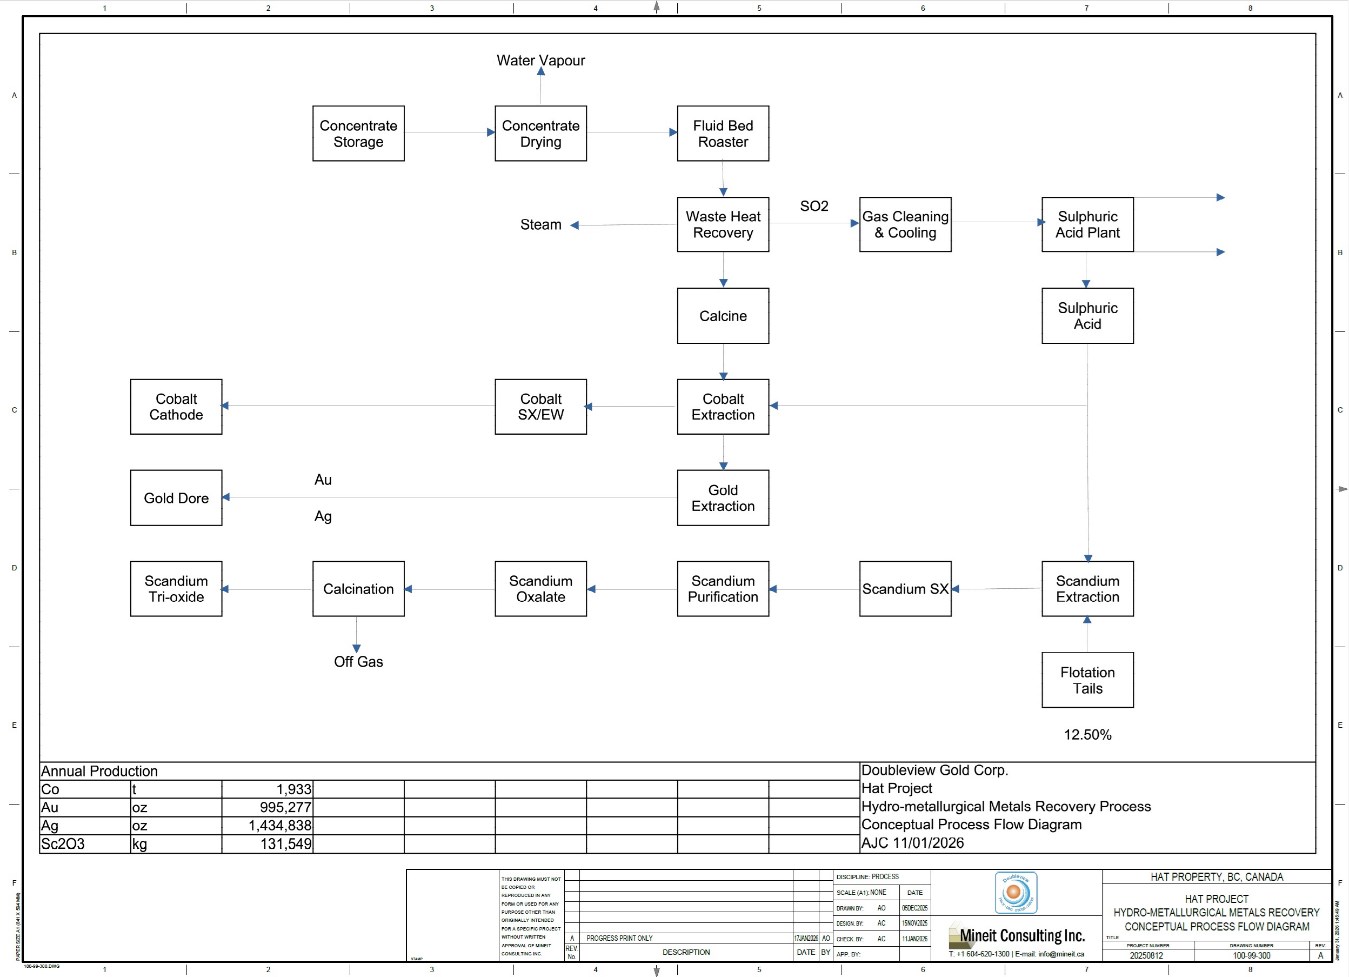
The concentrator consists of crushing, grinding, flotation, concentrate handling, and tailings management, producing both a saleable approximately 25% Cu concentrate with co-product gold and by-product silver-cobalt credits and a pyrite concentrate enriched in cobalt; in the full-circuit case, the pyrite concentrate is roasted to generate sulphuric acid and a calcine that is then processed to recover cobalt, gold, silver, and copper; after stripping it will be precipitated as a sulphide to be admixed to the copper concentrate to improve grade, with the acid used to leach flotation tailings for scandium recovery, noting that the scandium circuit is a newer chemical process compared with the otherwise industry-standard flowsheet.

Under A1 or A2 (Figure 1), the flowsheet produces a single saleable product-a copper concentrate with payable gold credits; the pyrite concentrate is not treated or marketed in this case and is only processed in B where the hydrometallurgical circuit enables recovery of cobalt (and additional Au-Ag) and supports the scandium circuit (Figure 2), which is planned to be constructed in a phased approach commencing in Year 3 of operations.


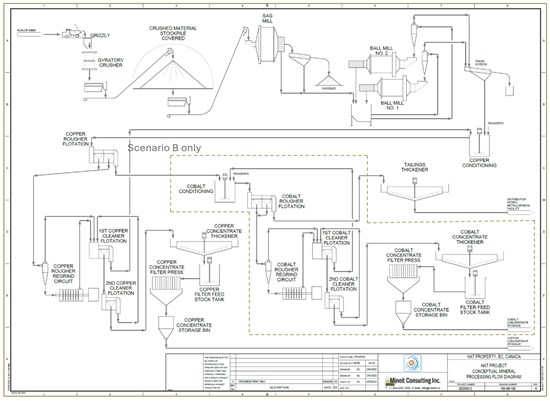
Figure 1: Grinding and Flotation Flowsheet; Scenarios A1/A2 Report Copper Concentrate Only, while the Cobalt-Pyrite Flotation Stream Shown Is Included Only in Scenario B

To view an enhanced version of this graphic, please visit:
https://images.newsfilecorp.com/files/8003/285945_7d43165cf4f1bb4d_001full.jpg


Figure 2: Scenario B Hydrometallurgical Plant Block Flow Diagram, Showing Downstream Treatment of the Cobalt-Pyrite Stream and Flotation of Tailings to Recover Cobalt (and Au-Ag) and Scandium, Including Sulphuric Acid Generation to Support the Scandium Circuit

To view an enhanced version of this graphic, please visit:
https://images.newsfilecorp.com/files/8003/285945_7d8c82e63416eab6_003full.jpg

Table 7 summarizes the head grades, concentrate grades, and overall metallurgical recoveries from early testwork for the full circuit; A1 assumes only the reported recoveries to the Cu-Au concentrate, while the cobalt-pyrite concentrate and downstream recoveries are considered only in B.

Table 7: Attainable Recovery from Testwork

Product Grade Recovery
Copper
(%)
Cobalt
(ppm)
Gold
(g/t)
Silver
(g/t)
Copper
(%)
Cobalt
(%)
Gold
(%)
Silver
(%)
Head Grade 0.21 132 0.34 2.9 – – – –
Copper-Gold Concentrate 25 1160 12 68 80 30 66 53
Cobalt-Pyrite Concentrate 0.30 1605 2 8 5 48 23 15
Combined Concentrates – – – – 85 78 89 68
Tailings 0.05 40 0.05 1.0 15 22 11 32

Early metallurgical testwork comprised metallurgical characterization studies under standard laboratory conditions to demonstrate metals recoverability for inclusion in the estimate of CuEq. No attempt was made to optimize flotation conditions, and more advanced flotation testwork was not undertaken. Consequently, the reported metallurgical recoveries are considered conservative, and it is reasonable to expect improvement with further testwork.

A2, assumes improved copper and gold recoveries of 89% and 75%, respectively, reflecting expected performance from comparable Cu-Au porphyry flotation circuits following further optimization and testwork.

Table 8 summarizes the recoveries assumption on each scenario.

Table 8: Net Recovery for Each Scenario

Net Recovery Scenario A1 Scenario A2 Scenario B
Cu Recovery 80% 89% 85%
Au Recovery 66% 75% 89%
Ag Recovery 53% 53% 68%
Co Recovery 30% 30% 78%

CAPITAL COST SUMMARY

Table 9 presents the estimated capital cost breakdown for the three evaluated scenarios, separating initial CAPEX from sustaining CAPEX and reporting costs in C$M by major cost area (processing plant, mining, pre-stripping, infrastructure, tailings and water management, Indirects/EPCM, and contingency).

Total initial CAPEX is estimated at C$3,552 million (A1), C$3,601 million (A2), and C$3,828 million (B), reflecting the higher processing plant scope and associated indirects/contingency in Scenario B.

Total sustaining CAPEX is estimated at C$2,755 million (A1/A2) and C$4,006 million (B), with the increase in B driven primarily by the inclusion of the hydrometallurgical plant and scandium recovery circuit within sustaining capital, while mining, infrastructure, and tailings sustaining components remain broadly consistent across scenarios

Table 9: Capital Cost Summary

Capital Cost Summary Unit Scenario A1 Scenario A2 Scenario B
Initial Capex
Processing Plant (Excl. Hydrometallurgical Plant) C$M 1,609 1,645 1,810
Mining CAPEX C$M 394 394 394
Mining Pre-Stripping C$M 97 97 97
Infrastructure (Power/Water/Roads/Camp)[14] C$M 326 326 326
Tailings And Water Management C$M 157 157 157
Indirects + EPCM C$M 258 262 278
Contingency (25%) C$M 710 720 766
Total initial CAPEX C$M 3,552 3,601 3,828
Sustaining CAPEX
Processing Plant (Inc. Hydrometallurgical Plant) C$M 285 285 1,194
Mining CAPEX C$M 811 811 811
Infrastructure (Power/Water/Roads/Camp) C$M 63 63 63
Tailings and Water Management C$M 1,065 1,065 1,065
Indirects + EPCM C$M 142 142 233
Contingency (25%) C$M 390 390 640
Total Sustaining CAPEX C$M 2,755 2,755 4,006
Closure and Reclamation C$M 503 503 503

OPERATING COST SUMMARY

Table 10 summarizes the key operating cost and selling terms used in the PEA, reporting unit costs in C$/t moved, C$/t milled, and (where applicable) C$/kg of scandium oxide, together with concentrate transport and selling costs, TC/RC, and payability assumptions.

Average site operating costs are estimated at C$16.22/t milled for Scenario A (concentrate-only) and C$22.96/t milled for B, with the increase in B driven by the addition of hydrometallurgical processing and acid generation (C$3.09/t milled) and scandium oxide processing costs (C$939.55/kg Sc₂O₃).

On a payable metal basis, the study reports C1 cash costs of C$2.4/lb CuEq (A1), C$2.39/lb CuEq (A2), and C$2.89/lb CuEq (B) and AISC of C$2.79/lb CuEq (A1), C$2.78/lb CuEq (A2), and C$3.39/lb CuEq (B), reflecting the combined effects of recoveries, co-product/by-product credits, and the additional operating requirements of the full circuit.

Table 10: Operating Cost Summary[15]

Operating Cost Summary Units Value
Average Mining Cost C$/t-moved 2.32
Processing Cost – Up to Concentrate production (Scenario A) C$/t-milled 7.93
Hydrometallurgical + Acid Generation (Scenario B) C$/t-milled 3.08
Scandium Oxide processing (Scenario B) C$/Kg Sc2O3 939.55
G&A C$/t-milled 2.56
Total Operating Cost C$/t-milled 22.96
Cu-Au concentrate product
Transport and selling C$/DMT 95.90
TC Cu-Au Concentrate C$/DMT 77.00
Refining Cost- Cu C$/lb 0.11
Refining Cost- Au C$/oz 6.85
Refining Cost- Ag C$/oz 0.48
Refining Cost- Co C$/lb 0.16
Payable – Cu % 97
Payable – Au % 95
Payable – Ag % 90
Payable – Co % 80
Metal Production on-site (Scenario B)
Payable – Au % 97
Payable – Ag % 97
Payable – Co % 97
C1 / cash cost (Scenario A1/A2/B) US$/lb CuEq payable 1.75 / 1.74 / 2.11
AISC (Scenario A1/A2/B) US$/lb CuEq payable 2.04 / 2.03 / 2.47

ECONOMIC RESULTS

Table 11 summarizes the key economic assumptions and resulting financial metrics for Scenarios A1, A2, B, including the long-term price deck, cash flow generation, taxation, and discounted valuation at a 5% discount rate. Using an exchange rate of 1.37 CAD: 1.00 USD and long-term prices of US$4.88/lb Cu, US$3,272.60/oz Au, US$50.22/oz Ag, and US$19.57/lb Co (and US$1,500/kg Sc₂O₃ for B), the Project generates average annual EBITDA of C$886 million (A1), C$1,071 million (A2), and C$1,242 million (B). On a post-tax basis, NPV(5%) is estimated at C$4,963 million (A1), C$6,727 million (A2), and C$6,937 million (B) with corresponding post-tax IRRs of 19%, 23%, and 19%, and post-tax payback in Year 6 (A1), Year 5 (A2), and Year 7 (B). Total post-tax free cash flow is estimated at C$10,050 million (A1), C$12,961 million (A2), and C$14,763 million (B), reflecting the higher cash generation under the improved recovery case (A2) and the additional revenue streams in Scenario B, partially offset by the added capital and operating requirements of the hydrometallurgical and scandium circuits.

Table 11: Financial Metrics Consensus Metal Prices

Metric Unit Scenario A1 Scenario A2 Scenario B
Financial Metrics
Exchange Rate CAD/USD 1.37
Long Term Copper Price US$/lb 4.88
Long Term Gold Price US$/oz 3,272.60
Long Term Silver Price US$/oz 50.22
Long Term Cobalt Price US$/lb 19.57
Long Term Scandium Oxide Price US$/kg N/A 1,500
Average Annual EBITDA C$M 886 1,071 1,242
Total EBITDA C$M 22,162 26,770 31,041
Average Annual Free Cash Flow (Pre-tax) C$M 756 940 1,061
Free Cash Flow (Pre-tax)[16] C$M 18,904 23,511 26,532
Total Provincial Tax (Including BC Mineral Tax) C$M (4,029) (5,090) (5,772)
Total Federal Tax C$M (1,274) (1,859) (2,170)
Total Taxes C$M (5,303) (6,949) (7,942)
Average Annual Free Cash Flow (Post-tax) C$M 544 662 744
Free Cash Flow (Post-tax)15 C$M 13,601 16,562 18,591
Total Free Cash Flow (Pre-tax)[17] C$M 15,352 19,910 22,704
Total Free Cash Flow (Post-tax)17 C$M 10,050 12,961 14,763
NPV 5% (Pre-Tax) C$M 7,883 10,576 11,043
NPV 5% (Pre-Tax) US$M 5,754 7,720 8,061
IRR (Pre-Tax) % 24 29 23
Payback (Pre-Tax) years Year 5 Year 4 Year 6
NPV 5% (Post-Tax) C$M 4,963 6,727 6,937
NPV 5% (Post-Tax) US$M 3,623 4,911 5,064
IRR (Post-Tax) % 19 23 19
Payback (Post-Tax) years Year 6 Year 5 Year 7

Table 12 summarizes the key economic assumptions and resulting financial metrics for A1, A2, B, using spot metal prices.

Table 12: Financial Metrics, Spot Metal Prices

Metric Unit Scenario A1 Scenario A2 Scenario B
Financial Metrics
Exchange Rate CAD/USD 1.37
Long Term Copper Price US$/lb 6.00
Long Term Gold Price US$/oz 5,200.00
Long Term Silver Price US$/oz 90.00
Long Term Cobalt Price US$/lb 25.54
Long Term Scandium Oxide Price US$/kg N/A 1,500
Average Annual EBITDA C$M 1,514 1,775 2,053
Total EBITDA C$M 37,843 44,376 51,331
Average Annual Free Cash Flow (Pre-Tax) C$M 1,383 1,645 1,873
Free Cash Flow (Pre-Tax)16 C$M 34,585 41,118 46,822
Total Provincial Tax (Includes BC Mineral Tax) C$M (7,657) (9,163) (10,484)
Total Federal Tax C$M (3,328) (4,166) (4,825)
Total Taxes C$M (10,985) (13,329) (15,309)
Average Annual Free Cash Flow (Post-Tax) C$M 944 1,112 1,261
Free Cash Flow (Post-Tax)16 C$M 23,600 27,789 31,513
Total Free Cash Flow (Pre-Tax)17 C$M 31,033 37,517 42,994
Total Free Cash Flow (Post-Tax)17 C$M 20,048 24,188 27,685
NPV 5% (Pre-Tax) C$M 17,230 21,073 22,734
NPV 5% (Pre-Tax) US$M 12,577 15,382 16,594
IRR (Pre-Tax) % 43 50 40
Payback (Pre-Tax) years Year 3 Year 3 Year 3
NPV 5% (Post-Tax) C$M 11,047 13,526 14,515
NPV 5% (Post-Tax) US$M 8,064 9,873 10,595
IRR (Post-Tax) % 34 39 32
Payback (Post-Tax) years Year 3 Year 3 Year 4

SENSITIVITY ANALYSIS

Sensitivity cases were evaluated for the key value drivers using after-tax NPV (5%) and after-tax IRR, including ±20% copper and gold prices, +20% initial capital, +20% operating costs and, for B, a ±40% scandium price sensitivity.

Table 13: Sensitivity Summary (After-Tax NPV(5%) and IRR)

Variable Case
(%)
Metal Price Scenario A1 Scenario A2 Scenario B
NPV (5%)
(C$M)
IRR
(%)
NPV (5%)
(C$M)
IRR
(%)
NPV (5%)
(C$M)
IRR
(%)
Base Case Consensus forecast 4,963 19 6,727 23 6,937 19
Copper Price -20 US$3.90/lb Cu 3,218 15 4,807 19 5,094 15
Copper Price +20 US$5.86/lb Cu 6,688 23 8,632 28 8,764 22
Gold Price -20 US$2,618.08/oz 3,625 16 5,223 19 5,201 16
Gold Price +20 US$3,927.12/oz 6,289 22 8,222 27 8,661 22
Metal Prices -20 All metal prices 1,708 10 3,165 14 2,650 11
Metal Prices +20 All metal prices 8,118 27 10,233 32 11,110 26
Initial CAPEX +20 Variable per Scenario 4,448 16 6,222 19 6,394 16
OPEX +20 Variable per Scenario 3,660 16 5,438 20 5,185 16
Scandium Oxide Price -40 US$900/kg Sc2O3 6,159 18
Scandium Oxide Price +40 US$2,100/kg Sc2O3 7,714 20

Overall, the sensitivity analysis demonstrates that the Project’s after-tax economics remain positive across the tested ranges, with the greatest variability in after-tax NPV(5%) and IRR driven by simultaneous changes in the overall metal price deck. Changes to copper and gold prices individually have a meaningful but smaller effect, while +20% initial CAPEX and +20% OPEX reduce value but do not eliminate Project attractiveness in any of the evaluated scenarios. Scenario B shows additional exposure to scandium oxide price, with after-tax NPV(5%) varying within a narrower range relative to the broader multi-metal price cases, indicating that scandium provides incremental upside while the base-case Cu-Au Project remains financially robust on its own.

PERMITTING, RISKS, AND NEXT STEPS

Permitting and Environmental

Permitting Status

The permitting process will be supported by the continuation of environmental baseline studies, progression of engineering designs, and the initiation of socio-economic and cultural baseline studies.

Due to the anticipated rate of resource extraction, it is expected that the Hat Project will be subject to both federal and provincial impact assessment pathways, so submission to both the Impact Assessment Agency of Canada (IAAC) and British Columbia Environmental Assessment Office (B.C. EAO) for their review is currently anticipated. Agency determination will decide the appropriate level of agency collaboration under the existing cooperation agreement for the Hat Project to acquire a provincial Environmental Assessment Certificate (EAC) and/or federal Decision Statement.

The company will also submit a Joint Mines Act and Environmental Management Act Application through the B.C. Major Mines Office. Additional federal authorizations, including Fisheries Act approvals and compliance with Metal and Diamond Mines Effluent Regulations (MDMER), and applicable provincial permits will be obtained concurrently with other assessment and permitting steps. This will not only support protection of the immediate environment through the life of the Project but also respect the rights of First Nations and promote social and economic wellbeing for local communities.

Tailings and Water Management

The Tailings Storage Facility (TSF) includes a perimeter dyke primarily constructed from compacted cycloned sand. This material will be sourced from the coarse underflow of tailings processed through an on-site cyclone plant. Using the centreline raise method, the dam is designed to be free-draining, lowering the phreatic surface to facilitate geotechnical stability. During operations, seepage from the TSF will be directed to the process plant as reclaim water. Upon closure, the supernatant pond will be drained, and the tailings and dam surfaces will be reclaimed with a granular trafficability layer, followed by a growth medium and native revegetation.

The water management strategy prioritizes the reuse of site-impacted water, directing TSF water, contact water from the waste rock storage facilities, and open-pit dewatering to the process plant for use as make-up water.

Key Risks and Opportunities

Project-wide

  • Tailings Storage Facility:
    • The location and geometry of the TSF are subject to refinement following geotechnical investigations of the potential site areas. Similarly, the anticipated availability of cycloned sand and the storage requirements for the facility may be adjusted once laboratory testing of the tailings is conducted.
    • The integration of this future site-specific data presents a significant opportunity to optimize the TSF design.
  • Mineral Processing:
    • Limited metallurgical and comminution data introduce uncertainty in equipment sizing and operating cost inputs; however, early results indicate the ore should be amenable to conventional Cu-Au flotation, with potential upside from improved recoveries and reduced reagent consumption through optimization.
    • The scandium circuit is less mature and is sensitive to acid economics and hydrometallurgical performance, but offers meaningful value upside if recoveries, product quality, and operating stability are confirmed at larger scale.
  • Mine Design:
    • Pit slope design criteria and mine scheduling are subject to elevated uncertainty due to the limited geotechnical database, including incomplete definition of structural controls, rock mass variability, and groundwater conditions. This creates downside risk to slope angles, strip ratio, and operating conditions if adverse structures or hydrogeology are encountered; however, it also provides a clear opportunity to materially improve design confidence and potentially optimize slope geometry, mine sequencing, and dewatering requirements through focused data acquisition and updated analyses.
  • Capital Cost estimates:
    • As a PEA-level estimate, capital costs remain subject to the inherent uncertainty of a preliminary design basis and limited engineering definition; however, significant effort was undertaken to develop the estimate using a defined scope, preliminary equipment sizing, and factored/benchmark-based costing with appropriate indirects and contingency. This work provides a credible foundation for decision-making at this stage while also highlighting clear opportunities to optimize capital intensity through further engineering definition, value engineering, and targeted trade-off studies (e.g., comminution configuration, tailings strategy, infrastructure/power, and construction execution approach).
  • Scandium specific:
    • Scandium provides strategic upside given its small, concentrated global supply base and the growing premium placed on secure, qualified supply, but it carries higher execution and commercial risk due to limited scale-up testwork (variability, impurity control, reagent intensity), added residue-management and permitting complexity, and uncertainty around product specifications, pricing, and customer qualification.

Next Steps

  • Resource:
    • The Company is advancing the Project toward Pre-Feasibility by upgrading confidence in the current Mineral Resource estimate and improving definition of mineralization within the proposed mine plan area. The program will prioritize infill drilling to support conversion of Inferred Resources to Indicated (and, where appropriate, Measured), together with step-out drilling to test extensions of known mineralization and provide improved geological continuity for next-stage mine design, scheduling, and economic evaluation.
  • Waste facilities:
    • Field investigations will be conducted at potential TSF and waste rock storage sites to characterize subsurface conditions and identify suitable borrow materials for construction. These efforts will be supported by site-specific geotechnical and geochemical characterization of the tailings and waste rock. These data sets will inform a TSF design update to a Pre-Feasibility Study (PFS) level of engineering, encompassing an optimized siting and technology trade-off study.
  • Metallurgy:
    • Complete a comprehensive metallurgical testwork program on representative samples including comminution testwork (Bond Work Index, abrasion index, and related grindability tests) and metallurgical variability + locked-cycle flotation testing to define an optimal process flowsheet, mass balance, and optimized reagent scheme, and to produce samples for concentrate dewatering and preliminary smelter marketing.
    • Progress the scandium work through targeted hydrometallurgical optimization including pulp density, free acidity/acid consumption, SX staging and extractant concentration, followed by an integrated pilot trial on bulk samples to validate scandium recovery, product quality, and circuit operability.
  • Mine Design:
    • A phased geotechnical program is recommended that includes re-analysis of existing boreholes (re-logging and detailed structural mapping, including oriented-core interpretation where available), establishment of geotechnical domains, targeted drilling and field mapping to confirm discontinuity sets and persistence, and hydrogeological data collection to constrain pore pressures and inflows. These data will support updated kinematic assessments and slope design analyses, refinement of inter-ramp and overall slope angles, and improved inputs to mine planning, risk management measures, and capital/operating cost estimates.
  • Capital Costs Estimation:
    • As the Project advances to PFS, the estimate will be progressively refined by advancing engineering to a higher level of definition, updating quantities and vendor inputs for major equipment and packages, tightening indirects and construction productivity assumptions, and executing focused optimization and constructability reviews to reduce contingency and improve overall cost confidence.

NI 43-101 DISCLOSURE, QUALIFIED PERSONS, AND CAUTIONARY STATEMENTS

Qualified Persons

The scientific and technical information in this news release has been reviewed and approved by the following Qualified Persons (as defined under NI 43-101):

  • Tomasz Wawruch, FAusIMM, Senior Geology and Mineral Resource Consultant of Mineit Consulting Inc. (responsible for the Mineral Resource estimate).
  • Andrew Carter, EUR ING, B.Sc., CEng., MIMMM (QMR), MSAIMM, SME, of Magister Metallurgy (responsible for metallurgical studies and recovery processes).
  • Shervin Teymouri, P.Eng., Mining Engineer of Mineit Consulting Inc. (responsible for project management, mining engineering, capital and operating cost estimates, and financial analysis).
  • Andre de Ruijter, P.Eng., Mineit Consulting Inc, Process Engineer (process design, process capital and operating cost lead).
  • Franky Li, P.Eng., EMM Consulting Pty Ltd (responsible for tailings management and TSF design, tailings capital and operating cost)
  • Jayesh Rami, P.Eng., Infrastructure Engineer of Sacre-Davey Engineering Inc. (responsible for project infrastructure)

Preliminary Economic Assessment Cautionary Statement

The Preliminary Economic Assessment (PEA) for the Hat Project is preliminary in nature and includes Inferred Mineral Resources that are considered too speculative geologically to have economic considerations applied to them that would enable them to be categorized as Mineral Reserves. Mineral Resources that are not Mineral Reserves do not have demonstrated economic viability. The PEA provides a conceptual mine plan and is based on low-level technical and economic assessments that are insufficient to support an evaluation of the economic viability of the Project or to establish Mineral Reserves. There is no certainty that the results of the PEA will be realized. Further exploration and site-specific engineering studies are required before a higher level of confidence can be established for the Project’s economics.

The economic analysis in the PEA is based on several assumptions including, but not limited to, long-term metal prices, foreign exchange rates, metallurgical recoveries, and capital and operating cost estimates. These assumptions are subject to significant risks and uncertainties, and actual results may differ materially from those projected. Readers are cautioned not to place undue reliance on the PEA or the forward-looking information contained in this release.

Forward-Looking Information

Certain of the statements made and information contained herein may constitute “forward-looking information” within the meaning of applicable Canadian securities laws. Often, these forward-looking statements can be identified using words such as “anticipates,” “believes,” “continue,” “estimates,” “expects,” “forecasts,” “intends,” “plans,” “projected,” or the negatives thereof or variations of such words and phrases. Forward-looking statements in this news release include, but are not limited to, statements with respect to: the results of the Preliminary Economic Assessment for the Hat Project; the estimation of mineral resources; anticipated annual production of copper, gold, cobalt, and scandium; the after-tax NPV and IRR of the Project; forecasted AISC and Total Cash Costs; estimated initial and sustaining capital costs; the timing of a Pre-Feasibility Study; the timeline for permitting milestones and construction decisions; planned early works and infrastructure upgrades; and the Company’s ability to maintain strong community and First Nations partnerships.

Forward-looking statements are based on a number of assumptions that management considers reasonable at the time they are made, including assumptions regarding: the future prices of copper, gold, cobalt, and scandium; foreign exchange rates; metallurgical recoveries; the cost of essential consumables; and the geopolitical and regulatory climate in British Columbia. However, such statements involve known and unknown risks and uncertainties which may cause actual results to differ materially. These risks include but are not limited to inaccurate estimation of mineral resources; volatility in metal prices; the results of future exploration and development activities; liquidity and financing risks; failure to obtain necessary permits; geotechnical conditions; and changes in applicable mining laws. The PEA is preliminary in nature and includes Inferred mineral resources that are considered too speculative geologically to have economic considerations applied to them that would enable them to be categorized as mineral reserves. Except as required by law, the Company undertakes no obligation to update or revise forward-looking information as conditions change.

Non-GAAP Financial Measures

The Company has included certain performance measures in this news release that are not specified, defined, or determined under Generally Accepted Accounting Principles (GAAP). These non-GAAP measures are common in the mining industry but do not have standardized definitions and may not be comparable to similar measures presented by other issuers. Readers should not consider these measures in isolation or as a substitute for performance measures prepared in accordance with GAAP.

  • Total Cash Costs: The Company calculates total cash costs as the sum of mining, processing, refining and transport, G&A, and royalty costs. Cash costs per unit are calculated by dividing the total cash costs by the payable Copper Equivalent (CuEq) units.
  • All-In Sustaining Cost: AISC is a non-GAAP financial measure comprising of total cash costs, sustaining capital expenditures to support ongoing operations, and closure costs. AISC per unit is calculated by dividing the total all-in sustaining costs by the payable CuEq units.
  • Sustaining Capital: This is a supplementary financial measure reflecting cash-basis expenditures expected to maintain operations and sustain production levels over the life of the mine.

About Doubleview Gold Corp.

Doubleview Gold Corp., a mineral resource exploration and development company based in Vancouver, British Columbia, Canada, is publicly traded on the TSX Venture Exchange [TSX-V: DBG], the OTCQB [DBLVF], the Berlin Stock Exchange [GER: A1W038], and the Frankfurt Stock Exchange [1D4]. Doubleview identifies, acquires, and finances precious and basemetal exploration projects in North America, particularly in British Columbia. The Company increases shareholder value through the acquisition and exploration of quality gold, copper, cobalt, scandium, and silver properties-collectively critical minerals-and through the application of advanced, state-of-the-art exploration methods. Doubleview’s portfolio of strategic properties provides diversification and mitigates investment risk.

About Mineit Consulting Inc.

Mineit Consulting Inc. (Mineit) is an independent mining engineering consulting company providing specialized expertise in project management, geological modelling, Mineral Resource estimation, mining engineering, metallurgical, and process engineering. Mineit lead and prepared the Hat Project MRE and PEA, with assistance from other engineering firms, for the Hat Project in accordance with the Canadian Institute of Mining, Metallurgy and Petroleum (CIM) Definition Standards on Mineral Resources and Reserves.

For further information please contact:
Doubleview Gold Corp
Vancouver, BC

Farshad Shirvani
President & CEO
Institutional Line: (604) 607-5470
T: (604) 678-9587
E: corporate@doubleview.ca

NEITHER TSX VENTURE EXCHANGE NOR ITS REGULATION SERVICES PROVIDER (AS THAT TERM IS DEFINED IN THE POLICIES OF THE TSX VENTURE EXCHANGE) ACCEPTS RESPONSIBILITY FOR THE ADEQUACY OR ACCURACY OF THIS RELEASE.

Certain of the statements made and information contained herein may constitute “forward-looking information.” In particular references to the Mineral Resource Estimate and future work programs or expectations on the quality or results of such work programs are subject to risks associated with operations on the property, exploration activity generally, equipment limitations and availability, as well as other risks that we may not be currently aware of. Accordingly, readers are advised not to place undue reliance on forward-looking information. Except as required under applicable securities legislation, the Company undertakes no obligation to publicly update or revise forward-looking information, whether as a result of new information, future events or otherwise.


[1] Early metallurgical testwork comprised metallurgical characterization studies under standard laboratory condition to demonstrate metals recoverability for inclusion in the estimate of Cu(eq). No attempt was made to optimize flotation conditions and more advanced flotation testwork was not undertaken. Consequently, the reported metallurgical recoveries are considered conservative and it’s reasonable to expect improvement with further testwork.
[2] Analyst consensus prices as of February 20, 2026: Au US$3.272/oz; Cu US$4.88/lb; Ag US$50.22/oz; Co US$19.57/lb; Sc2O3 US$1,500/kg.
[3] Spot prices as of February 25, 2026: Au US$5,200/oz; Cu US$6.00/lb; Ag US$90.00/oz; Co US$25.50/lb; Sc2O3 US$1,500/kg.
[4] CuEq calculations do not include scandium.
[5] Scandium tonnages represent 12.5% of the mineralized material by category, reflecting the proportion of tailings expected to be processed through a dedicated scandium leach circuit under current metallurgical design constraints. Scandium oxide metal content has been calculated using the metallurgical recovery of 72% and conversion factor from Sc to Sc2O3 of 1.534. The full scandium content has not been taken into economic evaluation at this time, as current market pricing for scandium lacks sufficient transparency and firmness to support a reliable valuation. Additional scandium in future assessments is considerable upon receipt of binding purchase commitments that establish a defined price. Until such time, scandium reporting to tailings may be preserved for potential recovery when market conditions in North America or Europe provide clearer price visibility.
[6] Scandium not used for CuEq calculation.
[7] CuEq grade calculation assumes metal process of Copper US$4.80/lb, Gold US$3200/troy oz, Silver US$46/troy oz, Cobalt US$20/lb. The CuEq formula is: CuEq = [(((Ag × 46.0 × 0.68)/31.1035) + ((Au × 3200 × 0.89)/31.1035) + 0.0001 × (Co × 20.0 × 0.78 × 22.0462) + 0.0001 × (Cu × 4.8 × 22.0462 × 0.85))/(4.8 × 22.0462 × 0.85)].
[8] Hydrometallurgical and Scandium circuit to be constructed after production of copper concentrate starts. Recovery reported consider the complete processing circuit is operational.
[9] Scandium tonnages represent 12.5% of the mineralized material by category, reflecting the proportion of tailings expected to be processed through a dedicated scandium leach circuit under current metallurgical design constraints
[10] Processing cost of C$7.93/t-milled for up to concentrate production, and additional C$3.08/t-milled for hydrometallurgical and acid generation plant for Scandium processing. Energy price C$0.07/kWh assuming grid power.
[11] Treatment cost to produce Scandium Oxide from the tailings, without considering acid cost (produced on site).
[12] Free Cash Flow during production periods only.
[13] Total life of mine Free Cash Flow, including initial capital costs and closure.
[14] Capital cost estimate Infrastructure includes the required power infrastructure include the extension of the transmission line (~150 km), switching stations and mine main substations (~C$140 million).
[15] Energy price C$0.07/kWh assuming grid power.
[16] Free Cash Flow during production periods only.
[17] Total life of mine Free Cash Flow, including initial capital costs and closure.

The issuer is solely responsible for the content of this announcement.

Smart Communications Achieves CSA STAR Level 2 Certification, Deepening Its Commitment to Digital Trust and Secure Cloud Innovation in Singapore

With AWS Singapore infrastructure, Smart Communications enables secure, cloud-first digital customer interactions and enterprise-grade resilience

SINGAPORE, March 3, 2026 /PRNewswire/ — Smart Communications™, a leading technology company focused on helping highly regulated organisations engage in more meaningful customer conversations, today announced that it has achieved Cloud Security Alliance (CSA) STAR Level 2 certification for its SmartCOMM™ and SmartIQ™ solutions hosted on AWS in Singapore.

The certification underscores Smart Communications’ commitment to strengthening digital trust for organisations across Singapore and the broader ASEAN region. As businesses accelerate digital transformation, secure and compliant cloud infrastructure is foundational to delivering resilient, customer-centric digital experiences at scale.

Trust and data security remain foundational to business and customer relationships in Singapore. Recent Benchmark research from Smart Communications reveals that 90% of Singapore consumers consider robust data security measures essential to trusting the companies they engage with, reinforcing the imperative for organisations to pair innovation with rigorous governance and security.

CSA STAR (Security, Trust, Assurance and Risk) is a globally recognised cloud security assurance program developed by the Cloud Security Alliance. STAR Level 2 represents a rigorous independent third-party audit that validates an organisation’s security controls, governance, and cloud security maturity. The certification confirms that Smart Communications’ security practices are not only documented but independently assessed and verified against a high standard of transparency and risk management.

“Trust is the foundation of every meaningful customer conversation, particularly in markets like Singapore where expectations around security, compliance, and digital experiences are exceptionally high,” said Heidi Johnson, Chief Product and Technology Officer at Smart Communications. “This achievement reflects our commitment to helping organisations innovate with confidence and deliver cloud-first, data-driven customer interactions grounded in security and trust.”

The milestone follows the launch of Smart Communications’ Singapore data centre, further strengthening the company’s ability to support local data residency requirements and the needs of regulated industries such as government, financial services, and insurance. Together, the in-region data centre and CSA STAR Level 2 certification reinforce Smart Communications’ long-term investment in Singapore and its readiness to support organisations advancing digital transformation initiatives.

By aligning its local infrastructure with globally recognised security standards, including ISO 27001 and SOC 2 frameworks, Smart Communications enables organisations to reduce risk, strengthen digital trust, and accelerate the move toward more personalised, compliant, and seamlessly connected customer communications.

About Smart Communications

Smart Communications is the trusted choice for regulated enterprises looking to modernize complex processes and connect with customers in the moments that matter most. Its Conversation Cloud™ platform powers frictionless, compliant, digital-first experiences through omnichannel communications, intelligent orchestration, secure data capture, and digital archival. More than 700 enterprises worldwide—including Zurich Insurance, Priority Health, The Pacific Financial Group, and The Bancorp—rely on Smart Communications to reduce compliance risk, boost operational efficiency, lower costs, and accelerate digital transformation. Today, with over 30 pre-built connectors, Smart Communications integrates seamlessly with trusted enterprise systems including Salesforce, AWS, Guidewire, DuckCreek, OneSpan, and Pega, and powers more than 60 billion mission-critical customer conversations each year.

Efor strengthens its presence in Asia with the acquisition of No deviation

LYON, France, March 3, 2026 /PRNewswire/ — Efor, a global leader specializing in quality and compliance for the Life Sciences industry, announces the acquisition of Singapore-based No deviation, a company recognized for its expertise in Commissioning, Qualification & Validation (CQV), Computer System Validation (CSV), Quality Compliance and Digital Enablement.

Founded in 2013, Efor has built a leading international platform dedicated to quality and compliance for Life Sciences industries. With more than 3,000 professionals operating across 18 countries, the group supports global pharmaceutical, biotechnology and medical device leaders.

This operation represents a significant milestone in Efor’s continued expansion across Asia. With more than 300 professionals now operating in the region, Efor reaches a new level of scale and strengthens its position within the Asian market.

Founded in 2007, No deviation operates today in Singapore, China and Ireland, with Singapore serving as its primary hub.

With an established presence across key Asian Life Sciences markets, No deviation has developed strong local execution capabilities, particularly in fast-growing biopharmaceutical environments.

The alliance builds on a shared vision of delivering high-value quality and compliance solutions across complex industrial projects.

By bringing No deviation into the group, Efor significantly strengthens its regional capabilities in Commissioning, Qualification & Validation (CQV) and high-standard complianceservices.

This acquisition further reinforces Efor’s global expansion strategy, combining sustained organic growth with targeted acquisitions.

“Asia is a strategic pillar of our global vision. With No deviation, we are strengthening our presence and positioning Efor as a leading quality and compliance playeracross key Asian markets,” said Mathieu Roger, Founder and President of Efor.

“Joining Efor opens a new chapter for No Deviation. This partnership expands our reach while preserving the technical depth and entrepreneurial spirit that define our organization,” said Pierre Winnepenninckx, Founder of No deviation.

Contact : Floriane CARRET – floriane.carret@efor-group.com

From Payments to Wealth: PhotonPay Unlocks New Growth with Strategic Hong Kong Financial Licenses

HONG KONG, March 3, 2026 /PRNewswire/ — PhotonPay, a leading global digital financial infrastructure platform, today announced a significant milestone in its global regulatory strategy. The company has officially obtained the Trust or Company Service Provider (TCSP) license from the Hong Kong Companies Registry, along with approvals from the Securities and Futures Commission (SFC) for Type 1 (Dealing in Securities), Type 4 (Advising on Securities), and Type 9 (Asset Management) licenses.

This regulatory milestone accelerates PhotonPay’s mission to build a unified financial infrastructure for modern businesses. By integrating these new capabilities, PhotonPay is positioned to offer a more integrated financial solution, empowering global enterprises to manage treasury, hedge risk, and optimize capital alongside their global payment flows.

PhotonPay has officially obtained the Trust or Company Service Provider (TCSP) license from the Hong Kong Companies Registry, along with approvals from the Securities and Futures Commission (SFC) for Type 1 (Dealing in Securities), Type 4 (Advising on Securities), and Type 9 (Asset Management) licenses.

Strengthening the Compliance Foundation

In the complex landscape of cross-border finance, compliance is the bedrock of scalability. The acquisition of the TCSP license (License No. TC010478) reflects PhotonPay’s commitment to meeting the rigorous standards required to combat money laundering and terrorist financing in a premier financial hub.

For PhotonPay’s clients, this translates to institutional-grade security. The license reinforces the company’s risk management framework, ensuring strict protocols for corporate entity management and identity verification (KYC/KYB), effectively creating a secure moat for global capital operations.

Expanding Service Boundaries: “Payment + Asset Management”

While the TCSP license strengthens the defensive perimeter, the SFC Type 1, 4, and 9 licenses unlock new strategic capabilities.

This combination allows PhotonPay to transcend the boundaries of a traditional payments processor. By enabling securities trading, investment advisory, and asset management services, PhotonPay is building a “Payments + Asset Management” dual-engine ecosystem. This evolution means clients will soon be able to do more than just move funds—they will be equipped to put their idle capital to work through diverse wealth management and risk hedging tools.

“This is a milestone moment that transforms PhotonPay from a payments provider into a comprehensive financial partner,” said Lewison Chen, Founder and CEO of PhotonPay. “With these licenses, we are building a one-stop financial infrastructure to support capital deployment, risk hedging, and wealth management. We are not just moving money; we are empowering international enterprises to maximize capital efficiency and secure robust growth in a complex global market.”

About PhotonPay

Founded in 2015, PhotonPay is dedicated to building a digital financial infrastructure that connects the global economy. With compliance as a core pillar of its business, PhotonPay has established local teams in over ten major markets worldwide and has cultivated strategic partnerships with top-tier global financial institutions, including J.P. Morgan. PhotonPay continues to explore the integration of fintech with diverse business scenarios, empowering enterprises to achieve secure, compliant, and long-term growth in the international market.

*This material is for reference only and does not constitute any investment advice or offer. The relevant financial services will be provided by licensed entities in accordance with the requirements of the Hong Kong Securities and Futures Commission and the Companies Registry, and are subject to applicable conditions. Please verify the latest licensing status through the official enquiry links (https://www.tcsp.cr.gov.hk/tcspls/?lang=en for TCSP license and https://apps.sfc.hk/publicregWeb/corp/BWJ859/details for SFC Type 1, 4, and 9 licenses).

SM Investments FY 2025 Net Income Up 10% to PHP90.5 billion

PASAY CITY, Philippines, March 3, 2026 /PRNewswire/ — SM Investments Corporation (SM Investments), the holding company of the SM group, reported a 10% increase in its consolidated net income to PHP90.5 billion in 2025 from PHP82.6 billion last year. Consolidated revenues also grew 4% to PHP681.7 billion from PHP654.8 billion last year.

“Our strong fourth quarter performance reinforced our full year results,” said Frederic C. DyBuncio, President and Chief Executive Officer of SM Investments. “This reflected resilient consumer spending, improved operational efficiencies and prudent financial management across our core businesses.”

Banking contributed the largest share of consolidated net income at 49%, followed by property at 27%, retail at 18% and portfolio investments at 6%.

“Looking ahead, we remain optimistic about the Philippine growth outlook, supported by easing inflation, steady employment, stable interest rates and sustained remittance flows that underpin household incomes and provincial market expansion. The Group will maintain its expansion strategy and disciplined capital allocation, while continuing to strengthen its ecosystem to serve more customers across the country,” Mr. DyBuncio added.

Retail

SM Retail reported net income was slightly up 1% to PHP21.1 billion. Retail revenues grew 5% to PHP458.1 billion from PHP434.5 billion last year.

“Department store growth remained steady, driven by strong performance in the kids category in the fourth quarter. Food retail benefitted from sustained spending on essential items. Specialty retail spending saw growth across health and beauty, fashion, kids and home categories, while the stationery section performed well due to increased gadget purchases,” Mr. DyBuncio observed.

Department store revenues grew 3% while food retail revenues increased 7%. Specialty retail revenues rose 4%.

Banking

BDO Unibank, Inc. (BDO) delivered a record net income of PHP87.2 billion, an increase by 6% from PHP82.0 billion last year driven by the solid performance of its core businesses.

Net interest income grew by 9% as gross customer loans climbed by 13% to PHP3.7 trillion, supported by double-digit growth across all market segments. Total deposits expanded by 10%, with a Current Account/Savings Account (CASA) ratio of 68%.

Asset quality improved, with Non-Performing Loan (NPL) ratio declining to 1.68%. NPL coverage was at 133%.

China Banking Corporation reported net income grew 13% to a record PHP28 billion driven by the bank’s core businesses. The bank’s core lending business served as the main driver with interest income climbing 12% to PHP105.2 billion.

Gross loans, which hit the PHP1 trillion mark for the first time, increased 13% to PHP1.1 trillion on strong demand from both the corporate and consumer segments. Deposits grew 9% to PHP1.4 trillion, supported by a current account and savings account ratio of 48%.

Non-performing loan (NPL) ratio was steady at 1.6% with NPL coverage ratio at 109%, well above the industry average.

Property

SM Prime Holdings, Inc. reported its net income expanded to PHP48.8 billion in 2025, up 7% from PHP45.6 billion the previous year. Growth was driven by stronger commercial property revenues and disciplined cost management.

Consolidated revenues reached PHP141.1 billion, slightly higher than the PHP140.4 billion in the previous year. The mall segment contributed PHP85.1 billion, accounting for 60% of total revenues, followed by residential (30%) at PHP42.5 billion, hotels and convention centers (6%) at PHP8.5 billion, and offices and warehouses (4%) at PHP5.4 billion.

Portfolio Investments

The portfolio investments’ performance was driven by Philippine Geothermal Production Company and NEO buildings, which together contributed 56% of total portfolio income, followed by 2GO and Goldilocks, with a combined 20% contribution.  

Balance Sheet

The total assets of SM Investments increased 7% to PHP1.8 trillion. Gearing ratio remained conservative with 30% net debt to 70% equity.

About SM Investments Corporation

SM Investments Corporation is one of the leading Philippine companies that is invested in market-leading businesses in retail, banking, and property. It also invests in ventures that capture high growth opportunities in the emerging Philippine economy.

SM’s retail operations are the country’s largest and most diversified, consisting of grocery stores, department stores and specialty retail stores. SM’s property arm, SM Prime Holdings, Inc., is the largest integrated property developer in the Philippines with interests in malls, residences, offices, hotels, and convention centers as well as tourism-related property developments. SM’s interests in banking are in BDO Unibank, Inc., the country’s largest bank, and China Banking Corporation, the fourth largest private domestic bank.

For more information, please visit www.sminvestments.com

Bad Bunny Sets Global Viewership Record for Most-Watched Apple Music Super Bowl Halftime Show Performance of All-Time, Reaching 4.157 Billion Views

The Roc Nation executive-produced show has officially become one of the most dominant global entertainment moments in Super Bowl history — breaking records across streaming, social, and global charts.

“Bad Bunny Turns the World Into His Casita With a Triumphant Super Bowl LX Halftime Performance… The Global Superstar called for unity” – BILLBOARD

“The Grammy-winning Puerto Rican megastar delivered a powerful, detail-packed performance that paid tribute to his history and teased more greatness for his future… Benito reminded so many of us of the love, the community and the absolute joy that we create together every day…” - The Guardian

“The singer then reiterated his message from the beginning of the show and the night he won his awards, a message of hope, determination, and strength: “Always believe in yourself.” The light in the boy’s eyes shined brighter than any of those fireworks.” –  Entertainment Weekly

NEW YORK, March 3, 2026 /PRNewswire/ — Today, Apple Music, the NFL and Roc Nation announced Bad Bunny’s Apple Music Super Bowl LX Halftime Show performance shattered global viewership, drawing 4.157 billion views in 24 hours across global broadcast, YouTube, and social platforms.

From record-breaking social consumption to unprecedented global streaming and chart dominance, Bad Bunny’s Apple Music Super Bowl LX Halftime Show stands as a defining milestone — not just for the NFL and Apple Music, but for global music culture at large.

On Apple Music, the performance sparked one of the largest real-time cultural conversations in platform history. The cultural impact translated instantly to streaming dominance. Immediately following the Halftime Show, Bad Bunny’s listens on Apple Music surged 7x, with “DtMF,” “BAILE INoLVIDABLE,” and “Tití Me Preguntó” emerging as the most streamed tracks.

On X alone, the Halftime moment generated:

  • 2 billion impressions
  • 209 million video views
  • 6+ million Bad Bunny-related posts
  • A +409% year-over-year increase in posts during the Halftime Show

After his press conference on February 5 – which amassed a record breaking 68 million views- and across the Super Bowl weekend, Bad Bunny’s plays increased 4x compared to his average plays in January. Top songs by total plays on Apple Music include “DtMF,” “BAILE INoLVIDABLE,” and “NUEVAYoL.” In this time, “DtMF” saw a 7x surge in plays on Apple Music.

In the hours following his performance, the Apple Music Super Bowl LX Halftime Show Set List playlist became the most-played Set List on Apple Music.

Following his Halftime appearance, Bad Bunny occupied nearly a quarter of Apple Music’s Daily Top 100 Global chart, placing:

  • 24 songs in the Top 100
  • 9 songs in the Top 25
  • 6 songs in the Top 10

“DtMF” claimed the  #1 global position. Six songs re-entered the chart for the first time since at least February 2025, while his global smash with Cardi B, “I Like It,” returned to the chart for the first time since January 2020.

On February 9, DeBÍ TiRAR MáS FOToS  landed on album charts in 155 countries, reached the Top 10 in 128, and claimed the #1 spot in 46, including Mexico, Colombia, Chile, Brazil, Germany, France, and Spain.

Across NFL-owned platforms — including @NFL and NFL International — fans have spent more than 1,275 years watching Halftime content (performance and supporting materials combined). That includes:

  • 456 years of watch time across Facebook, Instagram, and TikTok
  • 822 years of watch time on YouTube

Tuya Reports Fourth Quarter and Fiscal 2025 Unaudited Financial Results and Declaration of Cash Dividend

SANTA CLARA, Calif., March 3, 2026 /PRNewswire/ — Tuya Inc. (“Tuya” or the “Company”) (NYSE: TUYA; HKEX: 2391), a global leading AI cloud platform service provider, today announced its unaudited financial results for the fourth quarter and fiscal year ended December 31, 2025 and the declaration of a cash dividend.

Fourth Quarter 2025 Financial Highlights

  • Total revenue was US$84.5 million, up approximately 3.0% year-over-year (4Q2024: US$82.1 million).
  • Platform-as-a-service (“PaaS”) revenue was US$60.1 million, up approximately 1.4% year-over-year (4Q2024: US$59.3 million).
  • Software-as-a-service (“SaaS”) and others revenue was US$12.4 million, up approximately 8.2% year-over-year (4Q2024: US$11.5 million).
  • Smart solution revenue was US$12.0 million, up approximately 6.0% year-over-year (4Q2024: US$11.3 million).
  • Overall gross margin was 47.6%, down 0.2 percentage points year-over-year (4Q2024: 47.8%). Gross margin of PaaS was 47.3% (4Q2024: 47.4%).
  • Operating margin was 9.5%, improved by 14.1 percentage points year-over-year (4Q2024: negative 4.6%). Non-GAAP operating margin was 11.1% (4Q2024: 10.3%).
  • Net margin was 22.9%, improved by 10.9 percentage points year-over-year (4Q2024: 11.9%). Non-GAAP net margin was 24.4% (4Q2024: 26.9%).
  • Net profits were US$19.3 million (4Q2024: US$9.8 million). Non-GAAP net profits were US$20.6 million (4Q2024: US$22.1 million).
  • Net cash generated from operating activities was US$23.5 million (4Q2024: US$30.2 million).
  • Total cash and cash equivalents, time deposits and treasury securities recorded as short-term and long-term investments were US$1,017.3 million as of December 31, 2025, compared to US$1,016.7 million as of December 31, 2024.

Full Year 2025 Financial Highlights

  • Total revenue was US$321.8 million, up approximately 7.8% year-over-year (for the year ended December 31, 2024: US$298.6 million).
  • Platform-as-a-service (“PaaS”) revenue was US$231.2 million, up approximately 6.5% year-over-year (for the year ended December 31, 2024: US$217.1 million).
  • Software-as-a-service (“SaaS”) and others revenue was US$44.9 million, up approximately 13.4% year-over-year (for the year ended December 31, 2024: US$39.6 million).
  • Smart solution revenue was US$45.7 million, up approximately 8.9% year-over-year (for the year ended December 31, 2024: US$42.0 million).
  • Overall gross margin increased to 48.2%, up 0.8 percentage points year-over-year (for the year ended December 31, 2024: 47.4%). Gross margin of PaaS increased to 48.3%, up 1.2 percentage points year-over-year (for the year ended December 31, 2024: 47.1%).
  • Operating margin was 3.6%, improved by 19.5 percentage points year-over-year (for the year ended December 31, 2024: negative 15.9%). Non-GAAP operating margin was 10.5%, improved by 2.9 percentage points year-over-year (for the year ended December 31, 2024: 7.6%).
  • Net margin was 18.0%, improved by 16.3 percentage points year-over-year (for the year ended December 31, 2024: 1.7%). Non-GAAP net margin was 24.9% (for the year ended December 31, 2024: 25.2%).
  • Net profits were US$57.9 million (for the year ended December 31, 2024: US$5.0 million). Non-GAAP net profits were US$80.1 million, up approximately 6.4% year-over-year (for the year ended December 31, 2024: US$75.3 million).
  • Net cash generated from operating activities was US$81.0 million, increased by 0.9% year-over-year (for the year ended December 31, 2024: US$80.4 million).

For further information on the non-GAAP financial measures presented above, see the section headed “Use of Non-GAAP Financial Measures.”

Fourth Quarter and Fiscal Year 2025 Operating Highlights

  • PaaS customers[1] for the fourth quarter of 2025 were approximately 2,100 (4Q2024: approximately 2,100). Total customers for the fourth quarter of 2025 were approximately 3,000 (4Q2024: 3,000).
  • Premium PaaS customers[2] for the trailing 12 months ended December 31, 2025 were 291 (4Q2024: 298). In the fourth quarter of 2025, the Company’s premium PaaS customers contributed approximately 88.3% of its PaaS revenue (4Q2024: approximately 87.3%).
  • Dollar-based net expansion rate (“DBNER”)[3] of PaaS for the trailing 12 months ended December 31, 2025 was 102% (4Q2024: 122%).
  • Registered AI developers were over 1,801,000 as of December 31, 2025, up 37% from approximately 1,316,000 developers as of December 31, 2024.
  1. The Company defines a PaaS customer for a given period as a customer who has directly placed orders for PaaS with the Company during that period.
  2. The Company defines a premium PaaS customer as a customer as of a given date that contributed more than US$100,000 of PaaS revenue during the immediately preceding 12-month period.
  3. The Company calculates DBNER of PaaS for a trailing 12-month period by first identifying all customers in the prior 12-month period (i.e., those have placed at least one order for PaaS during that period), and then calculating the quotient from dividing the PaaS revenue generated from such customers in the current trailing 12-month period by the PaaS revenue generated from the same group of customers in the prior 12-month period. The Company’s DBNER may change from period to period, due to a combination of various factors, including changes in the customers’ purchase cycles and amounts and the Company’s customer mix, among other things. DBNER indicates the Company’s ability to expand customer use of the Tuya platform over time and generate revenue growth from existing customers.

Mr. Xueji (Jerry) Wang, Founder and Chief Executive Officer of Tuya, commented, “We maintained steady progress amid a complex and evolving operating environment, delivering solid revenue growth for the full year while further enhancing profitability and operating efficiency. The steady improvement in gross margin reflects our value positioning and technical pricing power within the industry, as well as the resilience of our core platform business structure. Sustained and healthy net profitability and operating cash flow further validate the durability of our business model and our ability to translate disciplined operations into solid financial performance.

Strategically, we continued to advance our AI+IoT strategy of ‘platform empowerment + application expansion,’ accelerating the systematic integration of AI capabilities across our platform and device ecosystem. At CES, we introduced Hey Tuya, our AI-powered smart life assistant, and showcased the supporting Physical AI Engine (PAE) architecture. This extension of our AI capabilities from the platform layer to cross-device, scenario-based product experiences marks a significant milestone in our transition from technology enablement to scenario-based product deployment.

As of the end of 2025, the number of registered AI+IoT developers on our platform reached 1.8 million, representing a 37% year-over-year increase. Approximately 16,000 AI Agents have been cumulatively developed on the Tuya platform. AI penetration across end products continues to increase, with commercialization advancing steadily. AI is evolving from standalone functionality into replicable applications and recurring revenue streams, structurally enhancing our platform’s value.

Looking ahead, we will continue to strengthen our AI-native platform capabilities and developer ecosystem. Supported by a robust business model and solid financial foundation, we remain focused on driving long-term value creation.”

Mr. Yi (Alex) Yang, Director and Chief Financial Officer of Tuya, added, “In the fourth quarter, the Company’s profitability continued to improve, with GAAP operating margin turning positive year over year and net profit margin expanding significantly, primarily driven by expense mix optimization and increased operating leverage. Building on steady revenue growth, we achieved a meaningful improvement in profitability.

For the full year 2025, the Company restored GAAP profitability while maintaining revenue growth and solid operating cash flow, reflecting continued cost discipline and resource allocation optimization.

Meanwhile, leveraging the ongoing evolution of our AI capabilities, we accelerated the development of recurring revenue models, particularly cloud software and value-added services, across our existing customer and developer ecosystem. In 2025, SaaS and others revenue achieved double-digit year-over-year growth, outpacing overall revenue growth and indicating continued improvement in revenue mix.

As of year-end, the Company’s balance sheet remained strong, with cash and liquid investments exceeding US$1.0 billion and no interest-bearing debt. Our liquidity position provides flexibility to support long-term strategic investments and resilience against external volatility.”

Fourth Quarter 2025 Unaudited Financial Results

REVENUE

Total revenue in the fourth quarter of 2025 increased by 3.0% to US$84.5 million from US$82.1 million in the same period of 2024.

  • PaaS revenue in the fourth quarter of 2025 increased by 1.4% to US$60.1 million from US$59.3 million in the same period of 2024, primarily due to increasing demand compared with the same period of 2024 and the Company’s strategic focus on customer needs and product enhancements, despite the disruptions in the international business environment due to tariff-related headwinds since this April. As a result, the Company’s DBNER of PaaS for the trailing 12 months ended December 31, 2025 softened to 102%, primarily reflecting more cautious purchasing behavior and customers’ elongated budgeting cycles amid a complex macro environment. Despite this, our core customer base remained stable, and premium PaaS customers continued to contribute a high proportion of PaaS revenue.
  • SaaS and others revenue in the fourth quarter of 2025 increased by 8.2% to US$12.4 million from US$11.5 million in the same period of 2024, primarily due to an increase in revenue from cloud software products. During the quarter, the Company remained committed to offering value-added services and a diverse range of software products with compelling value propositions to its customers.
  • Smart solution revenue in the fourth quarter of 2025 increased by 6.0% to US$12.0 million from US$11.3 million in the same period of 2024.

COST OF REVENUE

Cost of revenue in the fourth quarter of 2025 increased by 3.3% to US$44.2 million from US$42.8 million in the same period of 2024, generally in line with the increase in the Company’s total revenue.

GROSS PROFIT AND GROSS MARGIN

Total gross profit in the fourth quarter of 2025 increased by 2.6% to US$40.2 million from US$39.2 million in the same period of 2024. The gross margin in the fourth quarter of 2025 was 47.6%, compared to 47.8% in the same period of 2024.

  • PaaS gross margin in the fourth quarter of 2025 was 47.3%, compared to 47.4% in the same period of 2024.
  • SaaS and others gross margin in the fourth quarter of 2025 was 73.0%, compared to 72.7% in the same period of 2024.
  • Smart solution gross margin in the fourth quarter of 2025 was 22.9%, compared to 24.9% in the same period of 2024.

Gross margin of each revenue stream increased or fluctuated primarily due to changes in products and solutions mix. As an AI developer platform with a rich ecosystem of smart devices and applications, the Company remains focused on software products with compelling value propositions while maintaining cost efficiency.

OPERATING EXPENSES

Operating expenses decreased by 25.2% to US$32.2 million in the fourth quarter of 2025 from US$43.0 million in the same period of 2024. Non-GAAP operating expenses increased by 0.5% to US$30.9 million in the fourth quarter of 2025 from US$30.8 million in the same period of 2024. For further information on the non-GAAP financial measures presented above, see the section headed “Use of Non-GAAP Financial Measures.”

  • Research and development expenses in the fourth quarter of 2025 were US$21.7 million, down 8.3% from US$23.7 million in the same period of 2024, primarily due to lower share-based compensation expenses as equity incentive awards granted at higher valuations in previous years have been gradually amortized. Non-GAAP adjusted research and development expenses in the fourth quarter of 2025 were US$20.9 million, compared to US$21.2 million in the same period of 2024.
  • Sales and marketing expenses in the fourth quarter of 2025 were US$8.9 million, down 1.1% from US$9.0 million in the same period of 2024, primarily because of (i) a decrease in employee-related costs due to regular team movements, (ii) lower share-based compensation expenses as equity incentive awards granted at higher valuations in previous years have been gradually amortized, partially offset by increases in operating expenses. Non-GAAP adjusted sales and marketing expenses in the fourth quarter of 2025 were US$8.7 million, compared to US$8.2 million in the same period of 2024.
  • General and administrative expenses in the fourth quarter of 2025 were US$4.1 million, down 69.7% from US$13.6 million in the same period of 2024, primarily because of (i) lower share-based compensation expenses as equity incentive awards granted at higher valuations in previous years have been gradually amortized, (ii) a decrease in professional service costs, among other things. Non-GAAP adjusted general and administrative expenses in the fourth quarter of 2025 were US$3.9 million, compared to US$4.7 million in the same period of 2024.
  • Other operating income, net in the fourth quarter of 2025 was US$2.6 million, primarily due to the receipt of software value-added tax refunds.

LOSS/PROFIT FROM OPERATIONS AND OPERATING MARGIN

Profit from operations in the fourth quarter of 2025 was US$8.0 million, compared to a loss of US$3.8 million in the same period of 2024. The Company had a non-GAAP profit from operations of US$9.4 million in the fourth quarter of 2025, compared to a non-GAAP profit from operations of US$8.5 million in the same period of 2024, demonstrating consistent operating profitability and leverage.

Operating margin in the fourth quarter of 2025 was 9.5%, improved by 14.1 percentage points from negative 4.6% in the same period of 2024. Non-GAAP operating margin in the fourth quarter of 2025 was 11.1%, improved by 0.8 percentage points from 10.3% in the same period of 2024.

NET PROFIT AND NET MARGIN

Net profit in the fourth quarter of 2025 was US$19.3 million, improved by 97.4 percentage points from US$9.8 million in the same period of 2024. Non-GAAP net profit in the fourth quarter of 2025 was US$20.6 million, compared to US$22.1 million in the same period of 2024, demonstrating consistent profitability and improved leverage, despite being partially impacted by interest rate cuts.

Net margin in the fourth quarter of 2025 was 22.9%, improved by 11.0 percentage points from 11.9% in the same period of 2024. Non-GAAP net margin in the fourth quarter of 2025 was 24.4%, compared to 26.9% in the same period of 2024.

BASIC AND DILUTED NET PROFIT PER ADS

Basic and diluted net profit per ADS was US$0.03 in the fourth quarter of 2025, compared to basic and diluted net profit of US$0.02 in the same period of 2024. Each ADS represents one Class A ordinary share.

Non-GAAP basic and diluted net profit per ADS was US$0.03 in the fourth quarter of 2025, compared to non-GAAP basic and diluted net profit of US$0.04 in the same period of 2024.

CASH AND CASH EQUIVALENTS, TIME DEPOSITS AND TREASURY SECURITIES RECORDED AS SHORT-TERM AND LONG-TERM INVESTMENTS

Cash and cash equivalents, time deposits and treasury securities recorded as short-term and long-term investments were US$1,017.3 million as of December 31, 2025, compared to US$1,016.7 million as of December 31, 2024. The Company believes its current cash position is sufficient to meet its current liquidity and working capital needs.

NET CASH GENERATED FROM OPERATING ACTIVITIES

Net cash generated from operating activities in the fourth quarter of 2025 was US$23.5 million, compared to US$30.2 million in the same period of 2024. The net cash generated from operating activities for the fourth quarter of 2025 mainly due to working capital changes in the ordinary course of business.

For further information on non-GAAP financial measures presented above, see the section headed “Use of Non-GAAP Financial Measures.”

Fiscal Year 2025 Unaudited Financial Results

REVENUE

Total revenue increased by 7.8% to US$321.8 million in 2025 from US$298.6 million in 2024, mainly due to the increase in PaaS revenue and SaaS revenue.

  • PaaS revenue increased by 6.5% to US$231.2 million in the year ended December 31, 2025 from US$217.1 million in the same period of 2024, primarily due to steady demand from core customers and the Company’s continued focus on product enhancements and customer needs.
  • SaaS and others revenue increased by 13.4% to US$44.9 million in the year ended December 31, 2025 from US$39.6 million in the same period of 2024, primarily due to an increase in revenue from cloud software products. During the year ended December 31, 2025, the Company remained committed to offering value-added services and a diverse range of software products with compelling value propositions to its customers.
  • Smart solution revenue increased by 8.9% to US$45.7 million in the year ended December 31, 2025 from US$42.0 million in the same period of 2024, primarily attributable to the increasing customer demand for smart devices with integrated intelligent software capabilities the Company developed beyond IoT.

COST OF REVENUE

Cost of revenue increased by 6.1% to US$166.8 million in the year ended December 31, 2025 from US$157.2 million in the same period of 2024, in line with the increase in total revenue.

GROSS PROFIT AND GROSS MARGIN

Total gross profit increased by 9.6% to US$155.0 million in the year ended December 31, 2025 from US$141.4 million in the same period of 2024. Gross margin increased to 48.2% in the year ended December 31, 2025 from 47.4% in the same period of 2024.

  • PaaS gross margin was 48.3% in the year ended December 31, 2025, compared to 47.1% in the same period of 2024.
  • SaaS and others gross margin was 72.5% in the year ended December 31, 2025, compared to 71.9% in the same period of 2024.
  • Smart solution gross margin was 23.7% in the year ended December 31, 2025, compared to 25.5% in the same period of 2024.

Gross margin of each revenue stream increased or fluctuated primarily due to changes in products and solutions mix. As a developer platform with rich ecosystem of smart devices and applications, the Company remains focused on software products with compelling value propositions while maintaining cost efficiency.

OPERATING EXPENSES

Operating expenses decreased by 24.1% to US$143.6 million in the year ended December 31, 2025 from US$189.1 million in the same period of 2024. Non-GAAP operating expenses increased by 2.2% to US$121.4 million in the year ended December 31, 2025 from US$118.7 million in the same period of 2024. For further information on the non-GAAP financial measures presented above, see the section headed “Use of Non-GAAP Financial Measures.”

  • Research and development expenses were US$89.7 million in the year ended December 31, 2025, down 5.6% from US$95.0 million in the same period of 2024, primarily because of lower share-based compensation expenses as equity incentive awards granted at higher valuations in previous years have been gradually amortized, partially offset by higher employee-related costs and other operating expenses associated with regular team movements and ongoing investments in research and development capabilities. Non-GAAP adjusted research and development expenses in the year ended December 31, 2025 were US$84.3 million, compared to US$80.7 million in the same period of 2024.
  • Sales and marketing expenses were US$33.1 million in the year ended December 31, 2025, down 10.7% from US$37.1 million in the same period of 2024, primarily because of (i) a decrease in employee-related costs due to regular team movements, and (ii) lower share-based compensation expenses as equity incentive awards granted at higher valuations in previous years have been largely amortized. Non-GAAP adjusted sales and marketing expenses in the year ended December 31, 2025 were US$31.1 million, compared to US$32.0 million in the same period of 2024.
  • General and administrative expenses were US$30.9 million in the year ended December 31, 2025, down 54.7% from US$68.3 million in the same period of 2024, primarily because of (i) lower share-based compensation expenses as equity incentive awards granted at higher valuations in previous years have been gradually amortized, and (ii) a decrease in professional service costs, among other things. Non-GAAP adjusted general and administrative expenses in the year ended December 31, 2025 were US$16.2 million, compared to US$17.4 million in the same period of 2024.
  • Other operating incomes, net were US$10.2 million in the year ended December 31, 2025, primarily due to receipts of software value-added tax refund.

LOSS/PROFIT FROM OPERATIONS AND OPERATING MARGIN

Profit from operations was US$11.5 million in the year ended December 31, 2025, compared to a loss from operations of US$47.6 million in the same period of 2024. Non-GAAP profit from operations was US$33.7 million in the year ended December 31, 2025, compared to US$22.7 million in the same period of 2024.

Operating margin was 3.6% in the year ended December 31, 2025, improved by 19.5 percentage points from negative 15.9% in the same period of 2024. Non-GAAP operating margin was 10.5% in the year ended December 31, 2025, improved by 2.9 percentage points from 7.6% in the same period of 2024.

NET PROFIT AND NET MARGIN

The Company had a net profit of US$57.9 million in the year ended December 31, 2025, compared to US$5.0 million in the year ended December 31, 2024.

The Company had a non-GAAP net profit of US$80.1 million in the year ended December 31, 2025, increased by 6.4% compared to US$75.3 million in the same period of 2024, demonstrating the Company’s ability to sustain strong profitability on a non-GAAP basis.

Net margin was 18.0% in the year ended December 31, 2025, improved by 16.3 percentage points from 1.7% in the same period of 2024, and non-GAAP net margin was 24.9% in the year ended December 31, 2025, compared to 25.2% in the same period of 2024.

BASIC AND DILUTED NET PROFIT PER ADS

Basic and diluted net profit per ADS were US$0.09 in the year ended December 31, 2025, compared to basic and diluted net profit of US$0.01 in the same period of 2024. Each ADS represents one Class A ordinary share of the Company.

Non-GAAP basic and diluted net profit per ADS in the year ended December 31, 2025 were US$0.13, compared to basic and diluted net profit per ADS of US$0.13 in the same period of 2024.

CASH AND CASH EQUIVALENTS, TIME DEPOSITS AND TREASURY SECURITIES RECORDED AS SHORT-TERM AND LONG-TERM INVESTMENTS

Cash and cash equivalents, time deposits and treasury securities recorded as short-term and long-term investments were US$1,017.3 million as of December 31, 2025, compared to US$1,016.7 million as of December 31, 2024, which the Company believes is sufficient to meet its current liquidity and working capital needs.

NET CASH GENERATED FROM OPERATING ACTIVITIES

Net cash generated from operating activities was US$81.0 million in the year ended December 31, 2025, up 0.9% compared to US$80.4 million in the same period of 2024. The net cash generated from operating activities in the year ended December 31, 2025 improved mainly due to the increase in the Company’s revenue and the decrease in working capital changes in the ordinary course of business.

For further information on non-GAAP financial measures presented above, see the section headed “Use of Non-GAAP Financial Measures.”

Business Outlook

The overall operating environment for connected devices and intelligent solutions remains complex, while continuing to show signs of stabilization. Participants across the value chain – including manufacturers, brands, and channel partners – are maintaining a cautious approach to planning; however, we have observed a normalization in project execution and clearer demand visibility in several of our core categories.

At the same time, enterprises and consumers worldwide are accelerating their adoption of AI technologies and smart hardware. In the fourth quarter, Tuya continued to advance its AI and platform strategy by enhancing its AI-powered PaaS and SaaS offerings, expanding industry-focused solutions such as space-intelligence, and further cultivating its global developer and partner ecosystem. These initiatives are designed to reinforce our position as a leading AI developer platform and drive diversified, higher-value revenue streams over the long term.

Building on recent quarters’ progress, including sustained profitability, improved margins and robust operating cash flow, the Company remains focused on disciplined execution while selectively investing in key product, technology, and market growth opportunities. Tuya believes that its platform capabilities, ecosystem strengths, and solid financial position provide a strong foundation to navigate near-term uncertainties and capture long-term structural opportunities in the global intelligent technology market.

In response to this evolving market environment, the Company will remain committed to iterating and improving its products and services and further enhancing software and hardware capabilities, specifically by leveraging its AI capabilities, expanding its key customer base, investing in innovations and new opportunities, diversifying revenue streams, and further optimizing operating efficiency. At the same time, the Company’s future trajectory may be affected by a range of factors, including shifting consumer spending patterns, regional economic disparities, inventory management, foreign exchange rate and interest rate volatility, new tariffs, adjustments in existing tariffs or trade barriers, and broader geopolitical uncertainties.

Declaration of Cash Dividend and Record Date

On March 2, 2026, the Board has approved the declaration and distribution of a cash dividend (the “Cash Dividend”) of US$0.0605 per ordinary share, or US$0.0605 per ADS, to such holders as at the close of business on March 18, 2026, Hong Kong Time and New York Time, respectively. The aggregate amount of the Cash Dividend will be approximately US$37 million, which is payable in U.S. dollars and in cash, and will be funded by surplus cash and to be paid out from the share premium account of the Company. The determination to make distributions and the amount of such distributions will be made at the discretion of its Board and will be based upon the Company’s operations and earnings, including, but not limited to, considerations of the Company’s GAAP and Non-GAAP net profits, cash flows, financial conditions and other relevant factors.

In order to qualify for the Cash Dividend, with respect to ordinary shares registered on the Company’s Hong Kong share register, all valid documents for the transfers of shares accompanied by the relevant share certificates must be lodged with the Company’s Hong Kong share registrar, Computershare Hong Kong Investor Services Limited, at Shops 1712-1716, 17th Floor, Hopewell Centre, 183 Queen’s Road East, Wan Chai, Hong Kong, no later than 4:30 p.m. on Wednesday, March 18, 2026, Hong Kong time; and with respect to the ordinary shares registered on the Company’s principal share register in the Cayman Islands, all valid documents for the transfers of shares accompanied by the relevant share certificates must be lodged with the Company’s principal share registrar, Maples Fund Services (Cayman) Limited, at PO Box 1093, Boundary Hall, Cricket Square, Grand Cayman, KY1-1102, Cayman Islands, no later than 3:30 p.m. on Tuesday, March 17, 2026, Cayman Islands time (due to the time difference between Cayman Islands and Hong Kong).

Cash Dividend to be paid to the holders of ADSs issued by the depositary of the ADSs will be subject to the terms of the deposit agreement. The payment date is expected to be on or around April 15, 2026 for holders of ordinary shares, and on or around April 21, 2026 for holders of ADSs.

Conference Call Information

The Company’s management will hold a conference call at 07:30 P.M. U.S. Eastern Time on Monday, March 2, 2026 (08:30 A.M. Hong Kong Time on Tuesday, March 3, 2026) to discuss the financial results. In advance of the conference call, all participants must use the following links to complete the online registration process. Upon registering, each participant will receive the dial-in information and a unique PIN (personal access code) to join the call as well as an email confirmation with the details.

Participants Online Webcast Registration:
https://edge.media-server.com/mmc/p/tjv6firr

Participants Call Registration: https://register-conf.media-server.com/register/BI078ae0991e654d959884fbb4236f74a0

A live and archived webcast of the conference call will also be available at the Company’s investor relations website at https://ir.tuya.com.

About Tuya Inc.

Tuya Inc. (NYSE: TUYA; HKEX: 2391) is a global leading AI cloud platform service provider with a mission to build an AI developer ecosystem and enable everything to be smart. Tuya has pioneered a purpose-built AI cloud platform with cloud and generative AI capabilities that delivers a full suite of offerings, including Platform-as-a-Service, or PaaS, Software-as-a-Service, or SaaS, and smart solutions for developers of smart device, commercial applications, and industries. Through its AI developer platform, Tuya has activated a vibrant global developer community of brands, OEMs, AI agents, system integrators and independent software vendors to collectively strive for smart solutions ecosystem embodying the principles of green and low-carbon, security, high efficiency, agility, and openness.

Use of Non-GAAP Financial Measures

In evaluating the business, the Company considers and uses non-GAAP financial measures, such as non-GAAP operating expenses, non-GAAP profit from operations (including non-GAAP operating margin), non-GAAP net profit (including non-GAAP net margin), and non-GAAP basic and diluted net profit per ADS, as supplemental measures to review and assess its operating performance. The presentation of non-GAAP financial measures is not intended to be considered in isolation or as a substitute for the financial information prepared and presented in accordance with generally accepted accounting principles in the United States of America (“U.S. GAAP”). The Company defines non-GAAP financial measures by excluding the impact of share-based compensation expenses, credit-related impairment/(reversal) of long-term investments and litigation costs from the respective GAAP financial measures. The Company presents the non-GAAP financial measures because they are used by the management to evaluate its operating performance and formulate business plans. The Company also believes that the use of the non-GAAP financial measures facilitates investors’ assessment of its operating performance.

Non-GAAP financial measures are not defined under U.S. GAAP and are not presented in accordance with U.S. GAAP. Non-GAAP financial measures have limitations as analytical tools. One of the key limitations of using the aforementioned non-GAAP financial measures is that they do not reflect all items of expenses that affect the Company’s operations. Share-based compensation expenses, credit-related impairment/(reversal) of long-term investments and litigation costs have been and may continue to be incurred in the business and are not reflected in the presentation of non-GAAP measures. Further, the non-GAAP financial measures may differ from the non-GAAP information used by other companies, including peer companies, and therefore their comparability may be limited. The Company compensates for these limitations by reconciling the non-GAAP measures to the most directly comparable U.S. GAAP measures, all of which should be considered when evaluating the Company’s performance. The Company encourages you to review its financial information in its entirety and not rely on a single financial measure.

Reconciliations of Tuya’s non-GAAP financial measures to the most comparable U.S. GAAP measures are included at the end of this press release.

Safe Harbor Statement

This press release contains forward-looking statements. These statements are made under the “safe harbor” provisions of the U.S. Private Securities Litigation Reform Act of 1995. Statements that are not historical facts, including statements about the Company’s beliefs, and expectations, are forward-looking statements. Forward-looking statements involve inherent risks and uncertainties, and a number of factors could cause actual results to differ materially from those contained in any forward-looking statements. In some cases, forward-looking statements can be identified by words or phrases such as “may”, “will”, “expect”, “anticipate”, “target”, “aim”, “estimate”, “intend”, “plan”, “believe”, “potential”, “continue”, “is/are likely to” or other similar expressions. Further information regarding these and other risks, uncertainties or factors is included in the Company’s filings with the SEC. The forward-looking statements included in this press release are only made as of the date hereof, and the Company disclaims any obligation to publicly update any forward-looking statements to reflect subsequent events or circumstances, except as required by law. All forward-looking statements should be evaluated with the understanding of their inherent uncertainty.

Investor Relations Contact

Tuya Inc.
Investor Relations
Email: ir@tuya.com

HL Strategy
Haiyan LI-LABBE
Email: hl@hl-strategy.com

Piacente Financial Communications
China Tel: +86-10-6508-0677
U.S. Tel: +1-212-481-2050
Email: tuya@thepiacentegroup.com


TUYA INC.

UNAUDITED CONDENSED CONSOLIDATED BALANCE SHEETS

AS OF DECEMBER 31, 2024 AND 2025

(All amounts in US$ thousands (“US$”),

except for share and per share data, unless otherwise noted)

As of

December 31,

As of

December 31,

2024

2025

ASSETS

Current assets:

 Cash and cash equivalents

653,334

890,708

 Restricted cash

50

–

 Short-term investments

194,536

61,770

 Accounts receivable, net

7,592

13,193

 Notes receivable, net

7,485

10,111

 Inventories, net

23,840

30,943

 Prepayments and other current assets, net

16,179

16,486

Total current assets

903,016

1,023,211

Non-current assets:

 Restricted cash

–

245

 Property, equipment and software, net

6,619

15,653

 Land use rights, net

8,825

8,843

 Operating lease right-of-use assets, net

4,550

5,649

 Long-term investments

180,092

77,213

 Other non-current assets, net

678

1,700

Total non-current assets

200,764

109,303

Total assets

1,103,780

1,132,514

LIABILITIES AND SHAREHOLDERS’ EQUITY

Current liabilities:

 Accounts payable

19,051

31,778

 Advances from customers

31,346

29,330

 Deferred revenue, current

7,525

9,732

 Accruals and other current liabilities

32,257

33,261

 Incomes tax payables

360

142

 Lease liabilities, current

3,798

1,985

Total current liabilities

94,337

106,228

Non-current liabilities:

 Lease liabilities, non-current

851

3,329

 Deferred revenue, non-current

377

352

 Other non-current liabilities

767

–

Total non-current liabilities

1,995

3,681

Total liabilities

96,332

109,909


TUYA INC.

UNAUDITED CONDENSED CONSOLIDATED BALANCE SHEETS (CONTINUED)

AS OF DECEMBER 31, 2024 AND 2025

(All amounts in US$ thousands (“US$”),

except for share and per share data, unless otherwise noted)

As of

December 31,

As of

December 31,

2024

2025

Shareholders’ equity:

 Ordinary shares

–

–

 Class A ordinary shares

25

27

 Class B ordinary shares

4

4

 Treasury stock

(15,726)

(12)

 Additional paid-in capital

1,612,712

1,549,389

 Accumulated other comprehensive loss

(19,716)

(14,842)

 Accumulated deficit

(569,851)

(511,961)

Total shareholders’ equity

1,007,448

1,022,605

Total liabilities and shareholders’ equity

1,103,780

1,132,514


TUYA INC.

UNAUDITED CONDENSED CONSOLIDATED STATEMENTS OF

COMPREHENSIVE INCOME

(All amounts in US$ thousands (“US$”),

except for share and per share data, unless otherwise noted)

For the Three Months Ended

For the Year Ended

December 31,

2024

December 31,

2025

December 31,

2024

December 31,

2025

Revenue

82,059

84,487

298,617

321,791

Cost of revenue

(42,821)

(44,245)

(157,187)

(166,750)

Gross profit

39,238

40,242

141,430

155,041

Operating expenses:

 Research and development expenses

(23,705)

(21,729)

(95,049)

(89,687)

 Sales and marketing expenses

(9,048)

(8,945)

(37,081)

(33,110)

 General and administrative expenses

(13,618)

(4,127)

(68,254)

(30,916)

 Other operating incomes, net

3,337

2,605

11,334

10,151

 Total operating expenses

(43,034)

(32,196)

(189,050)

(143,562)

(Loss)/profit from operations

(3,796)

8,046

(47,620)

11,479

Other income

 Other non-operating income, net

767

2,915

4,180

5,215

 Financial income, net

12,474

9,647

50,718

44,179

 Foreign exchange gain/(loss), net

864

(974)

(136)

(1,030)

Profit before income tax expense

10,309

19,634

7,142

59,843

 Income tax expense

(524)

(320)

(2,145)

(1,953)

Net profit

9,785

19,314

4,997

57,890

Net profit attributable to Tuya Inc.

9,785

19,314

4,997

57,890

Net profit attribute to ordinary

 shareholders

9,785

19,314

4,997

57,890

Net profit

9,785

19,314

4,997

57,890

Other comprehensive (loss)/income

 Changes in fair value of

  long-term investments

153

24

14

115

 Transfer out of fair value changes of

  long-term investments

–

–

(65)

–

 Foreign currency translation

(4,450)

2,657

(2,574)

4,759

Total comprehensive income

 attributable to Tuya Inc.

5,488

21,995

2,372

62,764


TUYA INC.

UNAUDITED CONDENSED CONSOLIDATED STATEMENTS OF

COMPREHENSIVE INCOME (CONTINUED)

(All amounts in US$ thousands (“US$”),

except for share and per share data, unless otherwise noted)

For the Three Months Ended

For the Year Ended

December 31,

December 31,

December 31,

December 31,

2024

2025

2024

2025

Net profit attributable to Tuya Inc.

9,785

19,314

4,997

57,890

Net profit attributable to ordinary

 shareholders

9,785

19,314

4,997

57,890

Weighted average number of ordinary shares

 used in computing net profit per share,

 basic and diluted

 – basic

587,987,654

613,741,082

573,782,783

611,714,837

 – diluted

589,689,036

615,736,271

591,006,801

613,807,254

Net profit per share attributable to ordinary

 shareholders, basic and diluted

 – Basic

0.02

0.03

0.01

0.09

 – Diluted

0.02

0.03

0.01

0.09

Share-based compensation expenses

 were included in:

 Research and development expenses

2,487

804

14,347

5,404

 Sales and marketing expenses

869

258

5,098

2,047

 General and administrative expenses

8,855

322

48,305

14,812


TUYA INC.

UNAUDITED CONDENSED CONSOLIDATED STATEMENTS OF CASH FLOWS

(All amounts in US$ thousands (“US$”),

except for share and per share data, unless otherwise noted)

For the Three Months Ended

For the Year Ended

December 31,

2024

December 31,

2025

December 31,

2024

December 31,

2025

Net cash generated from operating activities

30,182

23,526

80,352

81,040

Net cash generated from investing activities

45,556

54,587

107,428

225,979

Net cash used in financing activities

(33,022)

(32,958)

(33,200)

(69,870)

Effect of exchange rate changes on cash and

 cash equivalents, restricted cash

(387)

281

116

420

Net increase in cash and cash equivalents,

 restricted cash

42,329

45,436

154,696

237,569

Cash and cash equivalents, restricted cash

 at the beginning of period

611,055

845,517

498,688

653,384

Cash and cash equivalents, restricted cash

 at the end of period

653,384

890,953

653,384

890,953


TUYA INC.

UNAUDITED RECONCILIATION OF NON-GAAP MEASURES TO THE MOST DIRECTLY
COMPARABLE FINANCIAL MEASURES

(All amounts in US$ thousands (“US$”),

except for share and per share data, unless otherwise noted)

For the Three Months Ended

For the Year Ended

December 31,

December 31,

December 31,

December 31,

2024

2025

2024

2025

Reconciliation of operating expenses to

 non-GAAP operating expenses

Research and development expenses

(23,705)

(21,729)

(95,049)

(89,687)

Add: Share-based compensation expenses

2,487

804

14,347

5,404

Adjusted Research and

 development expenses

(21,218)

(20,925)

(80,702)

(84,283)

Sales and marketing expenses

(9,048)

(8,945)

(37,081)

(33,110)

Add: Share-based compensation expenses

869

258

5,098

2,047

Adjusted Sales and marketing expenses

(8,179)

(8,687)

(31,983)

(31,063)

General and administrative expenses

(13,618)

(4,127)

(68,254)

(30,916)

Add: Share-based compensation expenses

8,855

322

48,305

14,812

Add: Credit-related impairment/(reversal) of
 long-term investments

72

(80)

261

(53)

Add: Litigation costs

–

–

2,300

–

Adjusted General and

 administrative expenses

(4,691)

(3,885)

(17,388)

(16,157)

Reconciliation of (loss)/profit from

 operations to non-GAAP

 profit from operations

(Loss)/profit from operations

(3,796)

8,046

(47,620)

11,479

Operating margin

(4.6) %

9.5 %

(15.9) %

3.6 %

Add: Share-based compensation expenses

12,211

1,384

67,750

22,263

Add: Credit-related impairment/(reversal) of
 long-term investments

72

(80)

261

(53)

Add: Litigation costs

–

–

2,300

–

Non-GAAP profit from operations

8,487

9,350

22,691

33,689

Non-GAAP Operating margin

10.3 %

11.1 %

7.6 %

10.5 %


TUYA INC.

UNAUDITED RECONCILIATION OF NON-GAAP MEASURES TO THE MOST DIRECTLY
COMPARABLE FINANCIAL MEASURES (CONTINUED)

(All amounts in US$ thousands (“US$”),

except for share and per share data, unless otherwise noted)

For the Three Months Ended

For the Year Ended

December 31,

December 31,

December 31,

December 31,

2024

2025

2024

2025

Reconciliation of net profit to

 non-GAAP net profit

Net profit

9,875

19,314

4,997

57,890

Net margin

11.9 %

22.9 %

1.7 %

18.0 %

Add: Share-based compensation expenses

12,211

1,384

67,750

22,263

Add: Credit-related impairment/(reversal) of
 long-term investments

72

(80)

261

(53)

Add: Litigation costs

–

–

2,300

–

Non-GAAP Net profit

22,068

20,618

75,308

80,100

Non-GAAP Net margin

26.9 %

24.4 %

25.2 %

24.9 %

Weighted average number of ordinary shares

 used in computing non-GAAP

 net profit per share,

 – Basic

587,987,654

613,741,082

573,782,783

611,714,837

Non-GAAP net profit per share attributable to

 ordinary shareholders

 – Basic

0.04

0.03

0.13

0.13

 – Diluted

0.04

0.03

0.13

0.13