Home Blog Page 2813

Tuniu Announces Unaudited Second Quarter 2025 Financial Results

NANJING, China, Aug. 15, 2025 /PRNewswire/ — Tuniu Corporation (NASDAQ: TOUR) (“Tuniu” or the “Company”), a leading online leisure travel company in China, today announced its unaudited financial results for the second quarter ended June 30, 2025.

“We were pleased to see that the company maintained steady growth in the second quarter,” said Mr. Donald Dunde Yu, Tuniu’s founder, Chairman and Chief Executive Officer. “Net revenues increased by 15.3% year-over-year, with revenues from packaged tours rising by 26.3%, and the company returned to profitability for the period. During the quarter we continued to strengthen the integration of our supply chain, products, and sales channels. In response to an increasingly diversified channel landscape, we leveraged our industry value chain advantages to develop differentiated products tailored to various customer segments. We also expanded the application of digital technologies across more business scenarios to enhance operational efficiency and customer experience. We will continue to build on Tuniu’s core strengths to drive growth during the peak travel season.”

Second Quarter 2025 Results

Net revenues were RMB134.9 million (US$18.8 million[1]) in the second quarter of 2025, representing a year-over-year increase of 15.3% from the corresponding period in 2024.

  • Revenues from packaged tours were RMB113.4 million (US$15.8 million) in the second quarter of 2025, representing a year-over-year increase of 26.3% from the corresponding period in 2024. The increase was primarily due to the growth of organized tours and self-drive tours.
  • Other revenues were RMB21.5 million (US$3.0 million) in the second quarter of 2025, representing a year-over-year decrease of 21.0% from the corresponding period in 2024. The decrease was primarily due to the decrease in the fees for advertising services provided to tourism boards and bureaus.

[1] The conversion of Renminbi (“RMB”) into United States dollars (“US$”) is based on the exchange rate of US$1.00=RMB 7.1636 on June 30, 2025 as set forth in H.10 statistical release of the U.S. Federal Reserve Board and available at https://www.federalreserve.gov/releases/h10/default.htm. 

Cost of revenues was RMB48.9 million (US$6.8 million) in the second quarter of 2025, representing a year-over-year increase of 50.2% from the corresponding period in 2024. As a percentage of net revenues, cost of revenues was 36.2% in the second quarter of 2025, compared to 27.8% in the corresponding period in 2024.

Gross profit was RMB86.0 million (US$12.0 million) in the second quarter of 2025, representing a year-over-year increase of 1.9% from the corresponding period in 2024.

Operating expenses were RMB78.9 million (US$11.0 million) in the second quarter of 2025, representing a year-over-year increase of 58.0% from the corresponding period in 2024. The increase was primarily due to the net gain on disposals of subsidiaries of RMB24.6 million recorded in the corresponding period in 2024.

  • Research and product development expenses were RMB16.4 million (US$2.3 million) in the second quarter of 2025, representing a year-over-year increase of 29.2%. The increase was primarily due to the increase in research and product development personnel related expenses. Research and product development expenses as a percentage of net revenues were 12.2% in the second quarter of 2025.
  • Sales and marketing expenses were RMB45.0 million (US$6.3 million) in the second quarter of 2025, representing a year-over-year increase of 11.9%. The increase was primarily due to the increase in sales and marketing personnel related expenses and promotion expenses. Sales and marketing expenses as a percentage of net revenues were 33.4% in the second quarter of 2025.
  • General and administrative expenses were RMB17.8 million (US$2.5 million) in the second quarter of 2025, representing a year-over-year decrease of 18.3%. The decrease was primarily due to the reversal of current expected credit losses allowance. General and administrative expenses as a percentage of net revenues were 13.2% in the second quarter of 2025.

Income from operations was RMB7.1 million (US$1.0 million) in the second quarter of 2025, compared to an income from operations of RMB34.5 million in the second quarter of 2024. Non-GAAP[2] income from operations, which excluded share-based compensation expenses and amortization of acquired intangible assets, was RMB9.1 million (US$1.3 million) in the second quarter of 2025.

[2] The section below entitled “About Non-GAAP Financial Measures” provides information about the use of Non-GAAP financial measures in this press release, and the table captioned “Reconciliations of GAAP and Non-GAAP Results” set forth at the end of this press release reconciles Non-GAAP financial information with the Company’s financial results under GAAP.

Net income was RMB14.1 million (US$2.0 million) in the second quarter of 2025, compared to a net income of RMB43.0 million in the second quarter of 2024. Non-GAAP net income, which excluded share-based compensation expenses and amortization of acquired intangible assets, was RMB16.1 million (US$2.2 million) in the second quarter of 2025.

Net income attributable to ordinary shareholders of Tuniu Corporation was RMB14.5 million (US$2.0 million) in the second quarter of 2025, compared to a net income attributable to ordinary shareholders of Tuniu Corporation of RMB43.0 million in the second quarter of 2024. Non-GAAP net income attributable to ordinary shareholders of Tuniu Corporation, which excluded share-based compensation expenses and amortization of acquired intangible assets, was RMB16.5 million (US$2.3 million) in the second quarter of 2025.

As of June 30, 2025, the Company had cash and cash equivalents, restricted cash, short-term investments and long-term deposits of RMB1.2 billion (US$172.0 million). 

Business Outlook

For the third quarter of 2025, Tuniu expects to generate RMB199.0 million to RMB208.3 million of net revenues, which represents a 7% to 12% increase year-over-year compared with net revenues in the corresponding period in 2024. This forecast reflects Tuniu’s current and preliminary view on the industry and its operations, which is subject to change.

Share Repurchase Update

In March 2024, the Company’s Board of Directors authorized a share repurchase program (the “2024 Share Repurchase Program”) under which the Company may repurchase up to US$10 million worth of its ordinary shares or American depositary shares (“ADS”) representing ordinary shares. As of July 31, 2025, the Company had repurchased an aggregate of approximately 10.6 million ADSs for approximately US$9.9 million from the open market under the 2024 Share Repurchase Program.

In August 2025, the Company’s Board of Directors authorized a new share repurchase program under which the Company may repurchase up to US$10 million worth of its ordinary shares or ADSs representing ordinary shares, effective immediately upon the termination of the 2024 Share Repurchase Program.

The Company’s proposed repurchases may be made from time to time on the open market at prevailing market prices, in privately negotiated transactions, in block trades and/or through other legally permissible means, depending on market conditions and in accordance with applicable rules and regulations. Tuniu plans to fund the repurchases from its available cash balance.

Conference Call Information

Tuniu’s management will hold an earnings conference call at 8:00 am U.S. Eastern Time, on August 15, 2025, (8:00 pm, Beijing/Hong Kong Time, on August 15, 2025) to discuss the second quarter 2025 financial results.

To participate in the conference call, please dial the following numbers:

United States

1-888-346-8982

Hong Kong

852-301-84992

Mainland China

4001-201203

International

1-412-902-4272

Conference ID: Tuniu 2Q 2025 Earnings Conference Call

A telephone replay will be available one hour after the end of the conference call through August 22, 2025. The dial-in details are as follows:

United States

1-877-344-7529

International

1-412-317-0088

Replay Access Code: 8828112

Additionally, a live and archived webcast of the conference call will also be available on the Company’s investor relations website at http://ir.tuniu.com.

About Tuniu

Tuniu (Nasdaq: TOUR) is a leading online leisure travel company in China that offers integrated travel service with a large selection of packaged tours, including organized and self-guided tours, as well as travel-related services for leisure travelers through its website tuniu.com and mobile platform. Tuniu provides one-stop leisure travel solutions and a compelling customer experience through its online platform and offline service network, including a dedicated team of professional customer service representatives, 24/7 call centers, extensive networks of offline retail stores and self-operated local tour operators. For more information, please visit http://ir.tuniu.com. 

Safe Harbor Statement

This press release contains forward-looking statements made under the “safe harbor” provisions of Section 21E of the Securities Exchange Act of 1934, as amended, and the U.S. Private Securities Litigation Reform Act of 1995. These forward-looking statements can be identified by terminology such as “will,” “expects,” “anticipates,” “future,” “intends,” “plans,” “believes,” “estimates,” “confident” and similar statements. Tuniu may also make written or oral forward-looking statements in its reports filed with or furnished to the U.S. Securities and Exchange Commission, in its annual report to shareholders, in press releases and other written materials and in oral statements made by its officers, directors or employees to third parties. Any statements that are not historical facts, including statements about Tuniu’s beliefs and expectations, are forward-looking statements that involve factors, risks and uncertainties that could cause actual results to differ materially from those in the forward-looking statements. Such factors and risks include, but are not limited to the following: Tuniu’s goals and strategies; the growth of the online leisure travel market in China; the demand for Tuniu’s products and services; its relationships with customers and travel suppliers; Tuniu’s ability to offer competitive travel products and services; Tuniu’s future business development, results of operations and financial condition; competition in the online travel industry in China; government policies and regulations relating to Tuniu’s structure, business and industry; the impact of health epidemics on Tuniu’s business operations, the travel industry and the economy of China and elsewhere generally; and the general economic and business condition in China and elsewhere. Further information regarding these and other risks, uncertainties or factors is included in the Company’s filings with the U.S. Securities and Exchange Commission. All information provided in this press release is current as of the date of the press release, and Tuniu does not undertake any obligation to update such information, except as required under applicable law.

About Non-GAAP Financial Measures

To supplement the Company’s unaudited consolidated financial results presented in accordance with United States Generally Accepted Accounting Principles (“GAAP”), the Company has provided non-GAAP information related to income from operations, net income, net income attributable to ordinary shareholders of Tuniu Corporation, which excludes share-based compensation expenses, amortization of acquired intangible assets, net gain on disposals of subsidiaries and impairment of property and equipment, net. The presentation of this non-GAAP financial measure is not intended to be considered in isolation or as a substitute for the financial information prepared and presented in accordance with U.S. GAAP. We believe that the non-GAAP financial measures used in this press release are useful for understanding and assessing underlying business performance and operating trends, and management and investors benefit from referring to these non-GAAP financial measures in assessing our financial performance and when planning and forecasting future periods.

This non-GAAP financial measure is not defined under U.S. GAAP and is not presented in accordance with U.S. GAAP. The non-GAAP financial measure has limitations as an analytical tool. Further, this non-GAAP measure may differ from the non-GAAP information used by other companies, including peer companies, and therefore its comparability may be limited. The Company compensates for these limitations by reconciling the non-GAAP financial measure to the nearest U.S. GAAP performance measure, all of which should be considered when evaluating performance. Tuniu encourages investors and others to review its financial information in its entirety and not rely on a single financial measure.

For more information on these non-GAAP financial measures, please see the table captioned “Reconciliations of GAAP and non-GAAP Results” set forth at the end of this press release.

(Financial Tables Follow)

Tuniu Corporation

Unaudited Condensed Consolidated Balance Sheets

(All amounts in thousands, except per share information)

 December 31, 2024 

 June 30, 2025 

 June 30, 2025 

 RMB 

 RMB 

 US$ 

ASSETS

Current assets

Cash and cash equivalents

465,004

438,084

61,154

Restricted cash 

26,061

10,715

1,496

Short-term investments

432,823

626,588

87,468

Accounts receivable, net

43,313

63,580

8,875

Amounts due from related parties

752

548

76

Prepayments and other current assets  

235,443

294,007

41,042

Total current assets

1,203,396

1,433,522

200,111

Non-current assets

Long-term investments

534,041

349,130

48,737

Property and equipment, net

32,849

19,839

2,769

Intangible assets, net

22,210

20,520

2,864

Land use right, net

88,467

–

–

Operating lease right-of-use assets, net

9,266

8,085

1,129

Other non-current assets

19,208

19,292

2,693

Total non-current assets

706,041

416,866

58,192

Total assets

1,909,437

1,850,388

258,303

LIABILITIES AND EQUITY

Current liabilities

Short-term borrowings

36

36

5

Accounts and notes payable 

290,112

348,323

48,624

Amounts due to related parties

3,121

4,257

594

Salary and welfare payable

23,148

20,470

2,858

Taxes payable

5,060

1,176

164

Advances from customers

247,151

193,413

26,999

Operating lease liabilities, current

2,994

3,163

442

Accrued expenses and other current liabilities

322,034

307,272

42,891

Total current liabilities

893,656

878,110

122,577

Non-current liabilities

Operating lease liabilities, non-current

1,680

1,373

192

Deferred tax liabilities

5,151

4,821

673

Total non-current liabilities

6,831

6,194

865

Total liabilities

900,487

884,304

123,442

Equity

Ordinary shares

249

249

35

Less: Treasury stock

(329,668)

(352,079)

(49,148)

Additional paid-in capital

9,146,928

9,119,636

1,273,052

Accumulated other comprehensive income

313,460

310,974

43,410

Accumulated deficit

(8,050,378)

(8,040,550)

(1,122,417)

Total Tuniu Corporation shareholders’ equity

1,080,591

1,038,230

144,932

Noncontrolling interests

(71,641)

(72,146)

(10,071)

Total equity

1,008,950

966,084

134,861

Total liabilities and equity

1,909,437

1,850,388

258,303


Tuniu Corporation

Unaudited Condensed Consolidated Statements of Comprehensive Income/(Loss)

(All amounts in thousands, except per share information)

 Quarter Ended 

 Quarter Ended 

 Quarter Ended 

 Quarter Ended 

 June 30, 2024 

 March 31, 2025 

 June 30, 2025 

 June 30, 2025 

 RMB 

 RMB 

 RMB 

 US$ 

Revenues

Packaged tours

89,782

98,969

113,404

15,831

Others

27,155

18,547

21,450

2,994

Net revenues

116,937

117,516

134,854

18,825

Cost of revenues

(32,530)

(48,169)

(48,865)

(6,821)

Gross profit

84,407

69,347

85,989

12,004

Operating expenses

Research and product development

(12,693)

(14,528)

(16,403)

(2,290)

Sales and marketing

(40,222)

(43,188)

(45,019)

(6,284)

General and administrative

(21,737)

(22,755)

(17,760)

(2,479)

Other operating income

24,735

326

312

44

Total operating expenses

(49,917)

(80,145)

(78,870)

(11,009)

Income/(Loss) from operations

34,490

(10,798)

7,119

995

Other income/(expenses)

Interest and investment income, net

8,221

7,829

7,279

1,016

Interest expense

(1,230)

(551)

(583)

(81)

Foreign exchange losses, net

(1,282)

(1,521)

(804)

(112)

Other income/(loss), net

1,822

(364)

(55)

(8)

Income/(loss) before income tax expense

42,021

(5,405)

12,956

1,810

Income tax expense

(459)

(52)

(274)

(38)

Equity in income of affiliates

1,438

105

1,423

199

Net income/(loss)

43,000

(5,352)

14,105

1,971

Net loss attributable to noncontrolling interests

(22)

(654)

(421)

(59)

Net income/(loss) attributable to ordinary shareholders of
Tuniu Corporation

43,022

(4,698)

14,526

2,030

Net income/(loss)

43,000

(5,352)

14,105

1,971

Other comprehensive income/(loss):

Foreign currency translation adjustment, net of nil tax

4,301

(861)

(1,625)

(227)

Comprehensive income/(loss)

47,301

(6,213)

12,480

1,744

Net income/(loss) per ordinary share attributable to ordinary
shareholders – basic and diluted

0.12

(0.01)

0.04

0.01

Net income/(loss) per ADS – basic and diluted*

0.36

(0.03)

0.12

0.03

Weighted average number of ordinary shares used in computing
basic income/(loss) per share

363,061,543

348,847,377

343,694,559

343,694,559

Weighted average number of ordinary shares used in computing
diluted income/(loss) per share

365,317,172

348,847,377

345,928,965

345,928,965

Share-based compensation expenses included are as follows:

Cost of revenues

65

65

65

9

Research and product development

65

65

65

9

Sales and marketing

31

31

32

4

General and administrative

1,429

1,230

1,244

174

Total

1,590

1,391

1,406

196

*Each ADS represents three of the Company’s ordinary shares.


Reconciliations of GAAP and Non-GAAP Results

(All amounts in thousands, except per share information)

 Quarter Ended June 30, 2025

 GAAP Result 

 Share-based 

Amortization of acquired 

Net gain on

Impairment

 Non-GAAP 

 Compensation 

  intangible assets 

 disposals of subsidiaries 

 of property and equipment, net 

 Result 

Income from operations

7,119

1,406

591

–

–

9,116

Net income

14,105

1,406

591

–

–

16,102

Net income attributable to ordinary shareholders

14,526

1,406

591

–

–

16,523

 Quarter Ended March 31, 2025

 GAAP Result 

 Share-based 

Amortization of acquired 

Net gain on

Impairment

 Non-GAAP 

 Compensation 

  intangible assets 

 disposals of subsidiaries 

 of property and equipment, net 

 Result 

Loss from operations

(10,798)

1,391

764

–

3,316

(5,327)

Net (loss)/income

(5,352)

1,391

764

–

3,316

119

Net (loss)/income attributable to ordinary shareholders

(4,698)

1,391

764

–

3,316

773

 Quarter Ended June 30, 2024

 GAAP Result 

 Share-based 

Amortization of acquired 

Net gain on

Impairment

 Non-GAAP 

 Compensation 

  intangible assets 

 disposals of subsidiaries 

 of property and equipment, net 

 Result 

Income from operations

34,490

1,590

828

(24,618)

–

12,290

Net income

43,000

1,590

828

(24,618)

–

20,800

Net income attributable to ordinary shareholders

43,022

1,590

828

(24,618)

–

20,822


GIBO Holdings Limited Announces Effective Date of Share Consolidation

HONG KONG, Aug. 15, 2025 /PRNewswire/ — – GIBO Holdings Limited (“GIBO” or the “Company”), a unique and integrated AIGC animation streaming platform, today announced the date of effectiveness and the ratio of a forthcoming share consolidation of the Company’s ordinary shares.

On August 6, 2025, the Company’s shareholders voted and approved at the extraordinary general meeting a two-hundred (200)-for-one (1) share consolidation of the Company’s issued and unissued Class A ordinary shares and Class B ordinary shares, whereby every 200 authorized issued and unissued Class A ordinary shares, par value US$0.000001 each, will be consolidated into one Class A ordinary share, par value US$0.0002 each, and every 200 authorized issued and unissued Class B ordinary shares, par value US$0.000001 each, will be consolidated into one Class B ordinary share, par value US$0.0002 each. The Company anticipates that beginning with the opening of trading on August 20, 2025, the Company’s Class A ordinary shares will trade on the Nasdaq Global Market on a split-adjusted basis and will have a new CUSIP number, G38617125.

The share consolidation affects all issued and outstanding ordinary shares of the Company. In addition, the share consolidation reduces the number of Class A ordinary shares issuable upon the exercise of the Company’s warrants in proportion to the ratio of the share consolidation and causes a proportionate increase in the exercise prices of such warrants. The share consolidation affects all shareholders uniformly and will not alter any shareholder’s percentage interest in the Company’s equity. No fractional shares will be issued; instead, shareholders who would otherwise be entitled to a fractional share will have their entitlement rounded up to the nearest whole share.

The Company anticipates that the share consolidation will increase the market price per share of the Company’s Class A ordinary shares.

Registered shareholders holding pre-consolidated shares of the Company are not required to take any action to receive post- consolidated shares. Shareholders owning shares via a broker, bank, trust or other nominee will have their positions automatically adjusted to reflect the share consolidation, and will not be required to take any action in connection with the share consolidation.

About GIBO Holdings Limited

GIBO Holdings Limited is a unique and integrated AIGC animation streaming platform with extensive functionalities provided to both viewers and creators that serves a broad community of young people across Asia to create, publish, share and enjoy AI-generated animation video content. With approximately 86 million registered users and advanced AI-powered tools, GIBO seeks to revolutionize content creation and consumption through AI.

Forward-Looking Statements

This press release includes “forward-looking statements” within the meaning of the “safe harbor” provisions of the United States Private Securities Litigation Reform Act of 1995. Forward-looking statements may be identified by the use of words such as “estimate,” “plan,” “project,” “forecast,” “intend,” “will,” “expect,” “anticipate,” “believe,” “seek,” “target” or other similar expressions that predict or indicate future events or trends or that are not statements of historical matters. These forward-looking statements also include, but are not limited to, statements regarding projections, estimates and forecasts of revenue and other financial and performance metrics, projections of market opportunity and expectations, the Company’s ability to scale and grow its business, the Company’s advantages and expected growth, the Company’s ability to source and retain talent, and the Company’s cash position, as applicable. These statements are based on various assumptions, whether or not identified in this press release, and on the current expectations of the Company’s management and are not predictions of actual performance. These statements involve risks, uncertainties and other factors that may cause the Company’s actual results, levels of activity, performance, or achievements to be materially different from those expressed or implied by these forward-looking statements. Although the Company believes that it has a reasonable basis for each forward-looking statement contained in this press release, the Company cautions you that these statements are based on a combination of facts and factors currently known and projections of the future, which are inherently uncertain. The forward-looking statements in this press release represent the views of the Company as of the date of this press release. Subsequent events and developments may cause those views to change. Except as may be required by law, the Company does not undertake any duty to update these forward-looking statements.

Contact Information

Investor Relations:
Bill Zima
ICR, Inc.
William.zima@icrinc.com 

Media Relations:
Edmond Lococo
ICR, Inc.
Edmond.Lococo@icrinc.com

Trip.com Group Limited to Report Second Quarter and First Half of 2025 Financial Results on August 27, 2025 U.S. Time

SINGAPORE, Aug. 15, 2025 /PRNewswire/ — Trip.com Group Limited (Nasdaq: TCOM; HKEX: 9961), a leading one-stop travel service provider of accommodation reservation, transportation ticketing, packaged tours and corporate travel management, will announce its financial results for the three months and six months ended on June 30, 2025 on Wednesday, August 27, 2025, U.S. Time, after the market closes.

Trip.com Group’s management team will host a conference call at 8:00 PM U.S. Eastern Time on August 27, 2025 (or 8:00 AM on August 28, 2025 in the Hong Kong Time) following the announcement.

The conference call will be available on Webcast live and replay at: http://investors.trip.com. The call will be archived for twelve months at this website.

All participants must pre-register to join this conference call using the Participant Registration link below:
https://register-conf.media-server.com/register/BI721587a0c39340f2abf725eb0ffb89eb.

Upon registration, each participant will receive details for this conference call, including dial-in numbers and a unique access PIN. To join the conference, please dial the number provided, enter your PIN, and you will join the conference instantly.

About Trip.com Group Limited 

Trip.com Group Limited (Nasdaq: TCOM; HKEX: 9961) is a leading global one-stop travel platform, integrating a comprehensive suite of travel products and services and differentiated travel content. It is the go-to destination for many travelers in Asia, and increasingly for travelers around the world, to explore travel, get inspired, make informed and cost-effective travel bookings, enjoy hassle-free on-the-go support, and share travel experience. Founded in 1999 and listed on Nasdaq in 2003 and HKEX in 2021, the Company currently operates under a portfolio of brands, including Ctrip, Qunar, Trip.com and Skyscanner, with the mission “to pursue the perfect trip for a better world.”

For further information, please contact:

Investor Relations
Trip.com Group Limited
Tel: +86 (21) 3406-4880 X 12229
Email: iremail@trip.com

From Waste to Worth: HP and TÜV Rheinland’s Sustainability Revolution

TAIPEI, Aug. 15, 2025 /PRNewswire/ — As companies worldwide strive for carbon reduction and net-zero goals, HP has been advancing its sustainable supply chain. Recently, HP has collaborated with suppliers to complete a brand closed-loop recycled materials certification project, audited by TÜV Rheinland Taiwan according to international standards. This initiative sets a new benchmark for e-waste recycling while demonstrating HP’s commitment to sustainability development.

HP has been an advocate of the circular economy as early as the 1960s. The enterprise has built upon its early initiatives in recycled materials programs to sustainably achieve the brand’s long-term sustainability goals, and this year it took a significant step by launching the recycling of the brand’s IT and telecom equipment waste—such as laptops, monitors, and keyboards—into raw materials for new products. HP has also partnered with TÜV Rheinland’s team of experts in recycled materials verification to establish inspection procedures, and TÜV Rheinland has fully conducted comprehensive audits throughout the entire process, complying with ISO 14021, EN 15343, and ISO 22095 standards.

Starting from waste collection, the inspection process involves meticulous evaluation of each stage, including manual sorting, dismantling, washing, electrostatic separation, and pelletizing, ensuring traceability and strict control. Unlike conventional e-waste processing, the emphasis with this system is precise manual disassembly and detailed classification management. During recycling, HP’s discarded products are carefully dismantled piece by piece, including screws, motherboards, and plastic parts, significantly enhancing material purity and recycled rates while minimizing contamination and material loss. According to TÜV Rheinland’s evaluation, a 65% recycled rate is achieved for ABS plastic from keyboards, enabling 0.65 kg of ABS to be recovered from every kilogram of discarded keyboards. Similarly, up to 30% of high-quality recycled plastic can be extracted from HP monitor waste and repurposed for next-generation HP products. This method has proven far more efficient and sustainable than traditional whole-device shredding.

In addition to plastics, HP has pioneered closed-loop recycling for metals. For example, PCBs rich in valuable metals undergo processes such as shredding, leaching, and electrolysis, enabling the recovery of 100% recycled electrolytic copper exclusively for HP. This comparatively sustainable process efficiently extracts material with electrolysis to separate multiple metals. The method ensures high purity and recovery rates, with an average of 200 to 300 kilograms of closed-loop recycled copper obtained per ton of discarded PCBs, showcasing its exceptional efficiency and sustainability.

Bringing over 20 years of experience in recycled material verification, TÜV Rheinland provided comprehensive technical support and inspection mechanisms, ensuring transparency and traceability across the recycling system—from waste collection to the application of materials in new HP products. TÜV Rheinland conducted rigorous audits of HP’s closed-loop recycling system and material production processes, ultimately verifying five types of material.

As consumer e-waste volumes continue to grow, governments and organizations worldwide are introducing stricter recycling regulations and encouraging the incorporation of recycled materials into products. HP’s closed-loop recycling model not only boosts resource efficiency but also sets a precedent for the electronics industry, promoting advancements in resource recovery and enhancing material management. Looking ahead, HP is taking further steps toward achieving a fully circular economy, and plans to expand its certification scope and integrate more recycled materials into HP products.

Leading the future with AI & mobility: NetDragon’s Cherrypicks & Zhongke WengAI’s Strategic Alliance

Wenge Invests in Cherrypicks to Jointly Drive China’s AI Go-Global Strategy and Elevate Hong Kong’s AI Ecosystem

HONG KONG, Aug. 15, 2025 /PRNewswire/ — NetDragon Websoft Holdings Limited (“NetDragon” or the “Company”, Hong Kong Stock Code: 777), a global leader in building internet communities, is pleased to announce that NetDragon and its subsidiary Cherrypicks, together with Zhongke WengAI, today hosted the launch ceremony for “Leading the future with AI & mobility: NetDragon’s Cherrypicks & Zhongke WengAI’s Strategic Alliance.” The alliance aims to accelerate innovative AI applications across enterprise and education. This collaboration marks a milestone in bringing China’s core AI technologies to global markets under the lead of a Hong Kong enterprise, injecting strong momentum into Hong Kong’s AI ecosystem and reinforcing the city’s role as an innovation hub for the Greater Bay Area and the world.

Cherrypicks and Zhongke WengAI will engage in an exclusive collaboration outside Mainland China to promote AI services. Under the partnership, Cherrypicks will serve as Wenge’s sole overseas commercialization and go-to-market platform. Wenge is investing in Cherrypicks and will contribute AI technology resources to jointly develop and deploy products and solutions for overseas markets across public services, finance, healthcare, and commercial sectors. Dr. Waley Wang, Chairman of Zhongke WengAI, will join the Board of Directors of Cherrypicks to align strategic direction and technology roadmap, driving efficient execution of joint projects.

Dr. Simon Leung, Vice Chairman of NetDragon, said: “This three-party collaboration exemplifies the convergence of China’s AI ‘go-global’ strategy with Hong Kong’s innovation strengths. As a bridge between the Mainland and international markets, Cherrypicks will leverage synergies to bring leading AI technologies such as the ‘YaYi’ large language model to Hong Kong and overseas, powering smart city development and industry upgrades, and further cementing Hong Kong’s position as an international innovation hub.”

Dr. Waley Wang, Chairman and Founder of Zhongke WengAI, said: “We attach great importance to our collaboration with Cherrypicks under NetDragon. As an international gateway for innovation with a multilingual environment, Hong Kong is strategically significant for Wenge’s overseas expansion. Cherrypicks’ professional capabilities and local ecosystem network will strongly support the rollout of our AI technologies and products in global markets. We look forward to jointly enabling industry transformation with AI and delivering higher-quality intelligent services for customers worldwide.”

Mr. Kenny Chien, CEO of Cherrypicks, said: “We are honored to partner with Zhongke WengAI to bring China’s leading AI technologies and innovations to the world. By combining our strengths in AI deployment, mobile technologies, and cross-border services, we will develop intelligent products tailored to local and international needs, foster a healthy AI ecosystem in Hong Kong, and help enterprises seize new opportunities in the intelligent era.”

Zhongke WengAI is widely recognized as a technology leader in Mainland China’s AI sector. Its self-developed “YaYi” large language model and AI Scientist agent ranked first across two global AI agent benchmarks in 2025, outperforming multiple international players. Wenge’s products deliver industry-leading performance in multimodal data processing, reasoning and decision-making, and semantic understanding, and are broadly applied in finance, healthcare, and scientific research, serving nearly one thousand organizations with efficient, intelligent solutions. Incubated by the Institute of Automation of the Chinese Academy of Sciences, Wenge continues to collaborate with renowned universities and technology enterprises at home and abroad to advance AI-driven industrial innovation.

At the launch event, Wenge introduced its latest research achievement, the YaYi AI-Scientist platform for scientific research, and showcased its international flagship products and technologies. Among them, the social listening product Wisky, powered by the YaYi model and cross-modal retrieval capabilities, enables comprehensive hot-topic trend analysis, cross-modal information retrieval across the web, intelligent report generation, an intelligent radar engine, and intelligent dashboard analytics. Wisky is available via API, on-premises deployment, SaaS, and mobile experiences, allowing users to stay on top of global dynamics anytime, anywhere and helping enterprises sharpen their competitive edge in the era of mobile intelligence.

Wenge also unveiled the international version of Yoya, a multimodal (audio/video) content creation tool. Built on 33 leading multimodal capabilities—including video segmentation, image generation, video generation, video cataloging, digital humans/avatars, speech synthesis, and cross-modal retrieval—Yoya serves marketing, branding, and events use cases with agent-driven features such as one-click video creation from raw assets, multilingual video translation, image style transfer, and AI voice cloning. The tool is specially optimized for mobile, enabling users in Hong Kong and worldwide to create high-quality multimedia content on their phones and accelerating the adoption of AI mobile intelligence across creative industries.

Wenge further introduced a one-stop Agent development toolkit, offering a zero-code, enterprise-grade platform to address deployment challenges across industries. With this tool, users can rapidly build custom AI agents and leverage mobile technologies for real-time deployment and use, further strengthening Hong Kong’s position as a hub for AI mobile intelligence.

Through its partnership with Cherrypicks, Wenge will combine the strengths of both parties to build cutting-edge AI products for mobile scenarios—for example, integrating Wisky’s social listening with Yoya’s content creation capabilities—to develop mobile intelligent solutions tailored to Hong Kong’s multilingual and cross-border needs, serving a broader international client base and helping enterprises capture new opportunities in the age of intelligent mobility.

About NetDragon Websoft Holdings Limited   

NetDragon Websoft Holdings Limited (HKSE: 0777) is a global leader in building internet communities with a long track record of developing and scaling multiple internet and mobile platforms that impact hundreds of millions of users, including previous establishments of China’s first online gaming portal, 17173.com, and China’s most influential smartphone app store platform, 91 Wireless.    

Established in 1999, NetDragon is one of the most reputable and well-known online game developers in China with a history of successful game titles including Eudemons Online, Heroes Evolved, Conquer Online, and Under Oath. In the past 10 years, NetDragon has also achieved success with its online education business both domestically and globally, and its overseas education business entity, currently a U.S.-listed subsidiary named Mynd.ai, is a global leader in interactive technology and its award-winning interactive displays and software can be found in more than 1 million learning and training spaces across 126 countries.   

About Zhongke WengAI

Zhongke WengAI is a leading enterprise AI technology service provider founded in 2017. Incubated by the Institute of Automation, Chinese Academy of Sciences, the company focuses on next generation decision intelligence, achieving breakthroughs in core technologies such as multilingual understanding, cross modal semantics, and decision making in complex scenarios. The company has developed DIOS, a proprietary decision intelligence operating system, the Tianhu X Data AI data operating system, the YaYi multilingual large language model, and the Zhichuan X Agent platform driving large scale commercial adoption of general AI. The company is a domestic leader in AI for media communications, security, finance, and government affairs, and has served more than 1,000 government and enterprise clients.

The company has led or participated in multiple National Key R&D Programs and major national science and technology initiatives. Zhongke WengAI is recognized as a national level “Specialized and Sophisticated Little Giant” enterprise and has been selected to the Forbes China Top 50 AI Companies and the CCID Think Tank (under MIIT) China Top 20 AI Companies.

About Cherrypicks

Founded in 2000 and headquartered in Hong Kong, Cherrypicks is a subsidiary of NetDragon Websoft Holdings Limited (HKEX: 777). The company focuses on innovative technologies spanning smart cities, augmented reality, artificial intelligence, e‑wallets, and smart location services, and holds a leading position in the Asia‑Pacific region. Cherrypicks’ user experiences and solutions are at the forefront of the industry, and its patented and patent‑pending products have won more than 100 local and international awards representing Hong Kong and China on global stages. The company’s early startup story was featured as a Harvard Business School case study (No. N9‑807‑106).

Cherrypicks’ world‑class mobile innovation solutions are trusted by long‑term partners across banking, insurance, F&B, retail, property management, travel, and transportation.

For investor enquiries, please contact:   

NetDragon Websoft Holdings Limited  
Ms. Maggie Zhou
Senior Director of Investor Relations  
Email: maggiezhou@nd.com.hk  / ir@netdragon.com   
Website: ir.netdragon.com     

So-Young Reports Unaudited Second Quarter 2025 Financial Results

BEIJING, Aug. 15, 2025 /PRNewswire/ — So-Young International Inc. (Nasdaq: SY) (“So-Young” or the “Company”), the leading aesthetic treatment platform in China connecting consumers with online services and offline treatments, today announced its unaudited financial results for the second quarter ended June 30, 2025.

Second Quarter 2025 Financial Highlights

  • Total revenues were RMB378.7 million (US$52.9 million[1]), compared with RMB407.4 million in the corresponding period of 2024. The aesthetic treatment services revenues were RMB144.4 million (US$20.2 million), compared with RMB27.4 million in the corresponding period of 2024, exceeding the high end of guidance.
  • Net loss attributable to So-Young International Inc. was RMB36.0 million (US$5.0 million), compared with net income attributable to So-Young International Inc. of RMB18.9 million in the same period of 2024.
  • Non-GAAP net loss attributable to So-Young International Inc.[2] was RMB30.5 million (US$4.3 million), compared with non-GAAP net income attributable to So-Young International Inc. of RMB22.2 million in the same period of 2024.

Second Quarter 2025 Operational Highlights

  • The aggregate value of medical aesthetic treatment transactions facilitated by So-Young’s platform was RMB303.9 million, compared with RMB427.8 million in the same period of 2024.
  • Number of verified treatment visits to the branded aesthetic centers for the quarter reached over 67,400, compared with approximately 14,000 in the same period of 2024. The number of verified aesthetic treatments performed surpassed 154,500, compared with approximately 27,600 in the same period of 2024.
  • The number of active users, defined as those who visited branded aesthetic centers at least once during the 12-month period ended on June 30, 2025, exceeded 100,400, compared with approximately 16,000 users during the corresponding period in 2024.
  • As of June 30, 2025, So-Young had 29 fully operational branded aesthetic centers in nine major cities, including Beijing, Shanghai, Guangzhou, Shenzhen, Hangzhou, Chengdu, Wuhan, Chongqing and Changsha. Among them, 25 centers have achieved positive monthly operating cash flow. The following table shows the revenues generated by So-Young aesthetic centers, categorized by their phase of development:

Phase (The length of time
since establishment
)

Number of
Centers

Revenue
(RMB)

Average Revenue per
Center (RMB)

Ramp-up (0-3 months)

9

23,554,000

2,617,000

Growth (4-12 months)

14

89,644,000

6,403,000

Maturity (over 12 months)

6

31,192,000

5,199,000

  • The number of institutions So-Young served with supply chain solutions for injectables grew to over 1,600 as of June 30, 2025. Shipments of Elasty injectable products reached approximately 39,100 units in the second quarter of 2025, compared with 43,200 in the same period of 2024.

[1] This press release contains translations of certain Renminbi (RMB) amounts into U.S. dollars (US$) solely for the convenience of the reader. Unless otherwise specified, all translations of Renminbi amounts into U.S. dollar amounts in this press release are made at RMB7.1636 to US$1.00, which was the U.S. dollars middle rate announced by the Board of Governors of the Federal Reserve System of the United States on June 30, 2025.

[2] Non-GAAP net income/(loss) attributable to So-Young International Inc. is defined as net income/(loss) attributable to So-Young International Inc. excluding share-based compensation expenses attributable to So-Young International Inc. See “Reconciliation of GAAP and Non-GAAP Results” at the end of this press release.

Mr. Xing Jin, Co-Founder and Chief Executive Officer of So-Young, commented, “During the second quarter, our branded aesthetic centers became the largest contributor to revenue for the first time, a significant milestone in our transformation strategy. With 29 aesthetic centers now in operation across China, we have solidified our position as the country’s leading light medical aesthetics brand. This achievement highlights the strength of our vertically integrated strategy and continued focus on offering standardized aesthetic services. Through ongoing operational enhancements, expanding portfolio of proprietary products, and brand-enhancing initiatives that deepen consumer engagement, we have substantially increased customer trust and loyalty. As we enter the next phase of growth, we are focused on further scaling our aesthetic center network and broadening our market presence, unlocking greater long-term value for customers, partners, and shareholders.”

Mr. Hui Zhao, Chief Financial Officer of So-Young, added, “In the second quarter, we saw further improvements in both the scale and quality of our aesthetic centers. With a target of operating 50 centers by year-end, our near-term financial results will continue to reflect ongoing investments to support the long-term sustainable growth and consolidate our market leading position.”

Second Quarter 2025 Financial Results

Revenues

Total revenues were RMB378.7 million (US$52.9 million), a decrease of 7.0% from RMB407.4 million in the same period of 2024. The decrease was primarily due to a decrease in the number of medical service providers subscribing to information services on So-Young’s platform.

  • Aesthetic treatment services[3] revenues were RMB144.4 million (US$20.2 million), an increase of 426.1% from RMB27.4 million in the same period of 2024. The increase was primarily due to the business expansion of the branded aesthetic centers.
  • Information and reservation services revenues were RMB135.2 million (US$18.9 million), a decrease of 35.6% from RMB209.7 million in the same period of 2024. The decrease was primarily due to a decrease in the number of medical service providers subscribing to information services on So-Young’s platform.
  • Sales of medical products and maintenance services were RMB76.0 million (US$10.6 million), a decrease of 28.1% from RMB105.8 million in the same period of 2024, primarily due to a decrease in the order volume of medical products.  
  • Other services revenues were RMB23.2 million (US$3.2 million), a decrease of 64.0% from RMB64.4 million in the same period of 2024, primarily due to a decrease in So-Young Prime. 

[3] Since the second quarter of 2025, in light of the better monitoring business development of branded aesthetic centers, the previous line item information services and others was separated into three line items, which are aesthetic treatment services, information services and other services. And the Company grouped the revenue generated from information services and reservation services, which is renamed as information and reservation services.

The revenue generated from aesthetic treatment services was previously reported in line item of information services and others. The revenue generated from information and reservation services and other services for the second quarter of 2024 have also been retrospectively updated. The amount reclassified from previous line item information services and others to aesthetic treatment services and information and reservation services is RMB27.4 million and RMB187.4 million for the second quarter of 2024, respectively.


Cost of Revenues

Cost of revenues was RMB184.6 million (US$25.8 million), an increase of 19.0% from RMB155.1 million in the second quarter of 2024. The increase was primarily due to business expansion of the branded aesthetic centers. Cost of revenues included share-based compensation expenses of RMB0.1 million (US$0.0 million), compared with RMB0.2 million in the corresponding period of 2024.

  • Cost of aesthetic treatment services were RMB109.4 million (US$15.3 million), an increase of 405.5% from RMB21.6 million in the second quarter of 2024. The increase was primarily due to the business expansion of the branded aesthetic centers.
  • Cost of information and reservation services[4] were RMB16.7 million (US$2.3 million), a decrease of 47.4% from RMB31.7 million in the second quarter of 2024. The decrease was in line with the decrease in revenue generated from information and reservation services.
  • Cost of medical products sold and maintenance services were RMB39.5 million (US$5.5 million), a decrease of 25.8% from RMB53.2 million in the second quarter of 2024. The decrease was primarily due to a decrease in costs associated with the sales of medical products.   
  • Cost of other services were RMB19.0 million (US$2.7 million), a decrease of 60.8% from RMB48.5 million in the second quarter of 2024. The decrease was primarily due to a decrease in costs associated with So-Young Prime.   

Operating Expenses

Total operating expenses were RMB241.3 million (US$33.7 million), a decrease of 1.8% from RMB245.6 million in the second quarter of 2024.

  • Sales and marketing expenses were RMB131.3 million (US$18.3 million), a decrease of 0.7% from RMB132.3 million in the second quarter of 2024. The decrease was primarily attributable to the decrease of payroll cost. Sales and marketing expenses included share-based compensation expenses of RMB0.6 million (US$0.1 million) in the second quarter of 2025, compared with RMB0.2 million in the corresponding period of 2024.
  • General and administrative expenses were RMB78.8 million (US$11.0 million), an increase of 11.3% from RMB70.8 million in the second quarter of 2024. The increase was primarily due to an increase in payroll costs associated with the expansion of administrative employees to support our business upgrade and new strategic businesses. General and administrative expenses included share-based compensation expenses of RMB4.3 million (US$0.6 million) in the second quarter of 2025, compared with RMB2.0 million in the corresponding period of 2024.
  • Research and development expenses were RMB31.2 million (US$4.4 million), a decrease of 26.6% from RMB42.5 million in the second quarter of 2024. The decrease was primarily attributable to improvements in staff efficiency. Research and development expenses included share-based compensation expenses of RMB0.5 million (US$0.1 million) in the second quarter of 2025, compared with RMB0.8 million in the corresponding period of 2024.  

[4] Since the second quarter of 2025, the previous line item cost of services and others was separated into three line items, which are cost of aesthetic treatment services, cost of information and reservation services and cost of other services. Cost of aesthetic treatment services primarily consists of expenditures relating to aesthetic treatment services in branded aesthetic centers, cost of information and reservation services primarily consists of expenditures relating to operation of platform business, and the remaining cost of services and others is reclassified into cost of other services. The cost of aesthetic treatment services, cost of information and reservation services and cost of other services for the second quarter of 2024 have also been retrospectively reclassified.

Income Tax (Expenses)/Benefits

Income tax expenses were RMB1.9 million (US$0.3 million), compared with income tax benefits of RMB2.6 million in the same period of 2024.

Net (Loss)/Income Attributable to So-Young International Inc.

Net loss attributable to So-Young International Inc. was RMB36.0 million (US$5.0 million), compared with a net income attributable to So-Young International Inc. of RMB18.9 million in the second quarter of 2024.

Non-GAAP Net (Loss)/Income Attributable to So-Young International Inc.

Non-GAAP net loss attributable to So-Young International Inc., which excludes the impact of share-based compensation expenses, was RMB30.5 million (US$4.3 million), compared with RMB22.2 million non-GAAP net income attributable to So-Young International Inc. in the same period of 2024.

Basic and Diluted (Loss)/Earnings per ADS

Basic and diluted loss per ADS attributable to ordinary shareholders were RMB0.35 (US$0.05) and RMB0.35 (US$0.05), respectively, compared with basic and diluted earnings per ADS attributable to ordinary shareholders of RMB0.18 and RMB0.18, respectively, in the same period of 2024.

Cash and Cash Equivalents, Restricted Cash and Term Deposits, Term Deposits and Short-Term Investments

As of June 30, 2025, cash and cash equivalents, restricted cash and term deposits, term deposits and short-term investments were RMB998.6 million (US$139.4 million), compared with RMB1,253.2 million as of December 31, 2024.

Business Outlook

For the third quarter of 2025, So-Young expects aesthetic treatment services revenues to be between RMB150.0 million (US$20.9 million) and RMB170.0 million (US$23.7 million), representing a 230.5% to 274.6% increase from the same period in 2024. The above outlook is based on the current market conditions and reflects the Company’s preliminary estimates of market and operating conditions, as well as customer demand, which are all subject to change.

Non-GAAP Financial Measures

To supplement the financial measures prepared in accordance with generally accepted accounting principles in the United States, or GAAP, this press release presents non-GAAP income/(loss) from operations and non-GAAP net income/(loss) attributable to So-Young International Inc. by excluding share-based compensation expenses from income/(loss) from operations and net income/(loss) attributable to So-Young International Inc., respectively. The Company believes these non-GAAP financial measures are important to help investors understand the Company’s operating and financial performance, compare business trends among different reporting periods on a consistent basis and assess the Company’s core operating results, as they exclude certain expenses that are not expected to result in cash payments. The use of the above non-GAAP financial measures has certain limitations. Share-based compensation expenses have been and will continue to be incurred in the future. All these are not reflected in the presentation of the non-GAAP financial measures, but should be considered in the overall evaluation of the Company’s results. The Company compensates for these limitations by providing the relevant disclosure of its share-based compensation expenses in the reconciliations to the most directly comparable GAAP financial measures, which should be considered when evaluating the Company’s performance. These non-GAAP financial measures should be considered in addition to financial measures prepared in accordance with GAAP, but should not be considered a substitute for, or superior to, financial measures prepared in accordance with GAAP. Reconciliation of each of these non-GAAP financial measures to the most directly comparable GAAP financial measure is set forth at the end of this release.

Conference Call Information

So-Young’s management will hold an earnings conference call on Friday, August 15, 2025, at 7:30 AM U.S. Eastern Time (7:30 PM on the same day, Beijing/Hong Kong Time). Dial-in details for the earnings conference call are as follows:

International:    

+1-412-902-4272

Mainland China:

4001-201203

US:   

+1-888-346-8982

Hong Kong:

+852-301-84992

Passcode:       

So-Young International Inc.

A telephone replay will be available two hours after the conclusion of the conference call through 23:59 U.S. Eastern Time, August 22, 2025. The dial-in details are:

International:       

+1-412-317-0088

US:  

+1-877-344-7529

Passcode:      

1137391

Additionally, a live and archived webcast of this conference call will be available at http://ir.soyoung.com.

About So-Young International Inc.

So-Young International Inc. (Nasdaq: SY) (“So-Young” or the “Company”) is the leading aesthetic treatment platform in China connecting consumers with online services and offline treatments. The Company provides access to aesthetic treatments through its online platform and branded aesthetic centers, offering curated treatment information, facilitating online reservations, delivering high-quality treatments, and developing, producing and distributing optoelectronic medical equipment and injectable products. With its strong brand recognition, digital reach, affordable treatments and efficient supply chain, So-Young is well-positioned to serve its audience over the long term and grow along the medical aesthetic value chain.

Safe Harbor Statement

This announcement contains forward-looking statements. These statements are made under the “safe harbor” provisions of the U.S. Private Securities Litigation Reform Act of 1995. These forward-looking statements can be identified by terminology such as “will,” “expects,” “anticipates,” “future,” “intends,” “plans,” “believes,” “estimates,” “confident” and similar statements. Among other things, the Financial Guidance and quotations from management in this announcement, as well as So-Young’s strategic and operational plans, contain forward-looking statements. So-Young may also make written or oral forward-looking statements in its periodic reports to the U.S. Securities and Exchange Commission, in its annual report to shareholders, in press releases and other written materials and in oral statements made by its officers, directors or employees to third parties. Statements that are not historical facts, including but not limited to statements about So-Young’s beliefs and expectations, are forward-looking statements. Forward looking statements involve inherent risks and uncertainties. A number of factors could cause actual results to differ materially from those contained in any forward-looking statement, including but not limited to the following: So-Young’s strategies; So-Young’s future business development, financial condition and results of operations; So-Young’s ability to retain and increase the number of users and medical service providers, and expand its service offerings; competition in the online medical aesthetic service industry; changes in So-Young’s revenues, costs or expenditures; Chinese governmental policies and regulations relating to the online medical aesthetic service industry, general economic and business conditions globally and in China; and assumptions underlying or related to any of the foregoing. Further information regarding these and other risks is included in the Company’s filings with the Securities and Exchange Commission. All information provided in this press release and in the attachments is as of the date of the press release, and So-Young undertakes no duty to update such information, except as required under applicable law.

For more information, please contact:

So-Young

Investor Relations
Ms. Mona Qiao
Phone: +86-10-8790-2012
E-mail: ir@soyoung.com

Christensen

In China
Ms. Charlie Chi
Phone: +86-10-5900-1548
E-mail: charlie.chi@christensencomms.com

In US
Ms. Linda Bergkamp
Phone: +1-480-614-3004
Email: linda.bergkamp@christensencomms.com


SO-YOUNG INTERNATIONAL INC.

UNAUDITED CONDENSED CONSOLIDATED BALANCE SHEETS

(Amounts in thousands, except for share and per share data) 


As of


December 31,


June 30,


June 30,

2024

2025

2025


RMB


RMB


US$

Assets


Current assets:


Cash and cash equivalents

587,749


380,907


53,173

Restricted cash and term deposits

66,367


84,996


11,865

Trade receivables

98,774


78,199


10,916

Inventories

151,754


242,415


33,840

Receivables from online payment platforms

24,255


23,218


3,241

Amounts due from related parties

1,218


2,620


366

Term deposits and short-term investments

599,041


532,696


74,361

Prepayment and other current assets

195,202


250,557


34,976

Total current assets

1,724,360


1,595,608


222,738

Non-current assets:


Long-term investments

280,281


277,642


38,757

Intangible assets

126,615


126,561


17,667

Goodwill

684


684


95

Property and equipment, net

155,352


196,252


27,396

Deferred tax assets

84,950


83,805


11,699

Operating lease right-of-use assets

162,764


196,677


27,455

Other non-current assets

200,152


172,937


24,141

Total non-current assets

1,010,798


1,054,558


147,210

Total assets

2,735,158


2,650,166


369,948


Liabilities


Current liabilities:


Short-term borrowings

69,771


59,801


8,348

Taxes payable

61,862


46,623


6,508

Contract liabilities

76,579


70,362


9,822

Salary and welfare payables

111,396


58,883


8,220

Amounts due to related parties

477


569


79

Accrued expenses and other current liabilities

265,216


330,237


46,101

Operating lease liabilities-current

44,905


58,649


8,187

Total current liabilities

630,206


625,124


87,265

Non-current liabilities:


Operating lease liabilities-non current

125,200


145,238


20,274

Deferred tax liabilities

19,758


17,973


2,509

Other non-current liabilities

1,264


1,736


242

Total non-current liabilities

146,222


164,947


23,025

Total liabilities

776,428


790,071


110,290


SO-YOUNG INTERNATIONAL INC.

UNAUDITED CONDENSED CONSOLIDATED BALANCE SHEETS (Continued)

(Amounts in thousands, except for share and per share data)

Shareholders‘ equity:


Treasury stock

(376,690)


(391,944)


(54,713)

Class A ordinary shares (US$0.0005 par value; 750,000,000
   shares authorized as of December 31, 2024 and June 30,
   2025; 77,897,969 and 65,659,510 shares issued and
   outstanding as of December 31, 2024, 78,328,240 and
   64,400,914 shares issued and outstanding as of June 30,
   2025, respectively)

253


254


35

Class B ordinary shares (US$0.0005 par value; 20,000,000
   shares authorized as of December 31, 2024 and June 30,
   2025; 12,000,000 shares issued and outstanding as of
   December 31, 2024 and June 30, 2025)

37


37


5

Additional paid-in capital

3,069,799


3,057,951


426,873

Statutory reserves

40,552


40,552


5,661

Accumulated deficit

(926,390)


(995,567)


(138,976)

Accumulated other comprehensive income

31,560


27,977


3,905

Total So-Young International Inc. shareholders‘ equity

1,839,121


1,739,260


242,790

Non-controlling interests

119,609


120,835


16,868

Total shareholders’ equity

1,958,730


1,860,095


259,658

Total liabilities and shareholders‘ equity

2,735,158


2,650,166


369,948


SO-YOUNG INTERNATIONAL INC.

UNAUDITED CONDENSED CONSOLIDATED STATEMENTS OF OPERATIONS

 (Amounts in thousands, except for share and per share data) 


For the Three Months Ended


For the Six Months Ended


June 30,
2024


June 30,
2025


June 30,
2025


June 30,
2024


June 30,
2025


June 30,
2025


RMB


RMB


US$


RMB


RMB


US$


Revenues:


Aesthetic treatment services

27,444


144,390


20,156


42,615


243,217


33,952


Information and reservation services

209,734


135,172


18,869


386,109


256,797


35,847


Sales of medical products and maintenance services

105,808


76,036


10,614


192,278


131,626


18,374


Other services

64,394


23,150


3,232


104,660


44,378


6,195


Total revenues

407,380


378,748


52,871


725,662


676,018


94,368


Cost of revenues:


Cost of aesthetic treatment services

(21,637)


(109,370)


(15,267)


(34,032)


(189,634)


(26,472)


Cost of information and reservation services

(31,744)


(16,705)


(2,332)


(63,261)


(40,002)


(5,584)


Cost of medical products sold and maintenance services

(53,198)


(39,491)


(5,513)


(96,291)


(69,916)


(9,760)


Cost of other services

(48,472)


(18,992)


(2,651)


(78,782)


(36,421)


(5,084)


Total cost of revenues

(155,051)


(184,558)


(25,763)


(272,366)


(335,973)


(46,900)


Gross profit

252,329


194,190


27,108


453,296


340,045


47,468


Operating expenses:


Sales and marketing expenses

(132,308)


(131,333)


(18,333)


(245,564)


(229,209)


(31,996)


General and administrative expenses

(70,799)


(78,786)


(10,998)


(155,752)


(138,070)


(19,274)


Research and development expenses

(42,498)


(31,177)


(4,352)


(82,089)


(63,286)


(8,834)


Total operating expenses

(245,605)


(241,296)


(33,683)


(483,405)


(430,565)


(60,104)


Income/(Loss) from operations

6,724


(47,106)


(6,575)


(30,109)


(90,520)


(12,636)


Other income/(expenses):


Investment income, net

788


884


123


2,887


99


14


Interest income, net

11,718


7,948


1,109


24,031


14,973


2,090


Exchange gains

16


701


98


410


726


101


Share of losses of equity method investee

(3,733)


(1,012)


(141)


(7,729)


(3,454)


(482)


Others, net

2,039


5,663


791


5,319


10,497


1,465


Income/(Loss) before tax

17,552


(32,922)


(4,595)


(5,191)


(67,679)


(9,448)


Income tax benefits/(expenses)

2,571


(1,877)


(262)


5,128


(272)


(38)


Net income/(loss)

20,123


(34,799)


(4,857)


(63)


(67,951)


(9,486)


Net income attributable to noncontrolling interests

(1,182)


(1,240)


(173)


(2,236)


(1,226)


(171)


Net income/(loss) attributable to So-Young International Inc.

18,941


(36,039)


(5,030)


(2,299)


(69,177)


(9,657)


SO-YOUNG INTERNATIONAL INC.

UNAUDITED CONDENSED CONSOLIDATED STATEMENTS OF OPERATIONS (Continued)

 (Amounts in thousands, except for share and per share data) 


For the Three Months Ended


For the Six Months Ended


June 30,
2024


June 30,
2025


June 30,
2025


June 30,
2024


June 30,
2025


June 30,
2025


RMB


RMB


US$


RMB


RMB


US$


Net earnings/(loss) per ordinary share


Net earnings/(loss) per ordinary share attributable to ordinary shareholder –
   basic

0.24


(0.46)


(0.06)


(0.03)


(0.88)


(0.12)

Net earnings/(loss) per ordinary share attributable to ordinary shareholder –
   diluted

0.24


(0.46)


(0.06)


(0.03)


(0.88)


(0.12)

Net earnings/(loss) per ADS attributable to ordinary shareholders – basic (13
   ADS represents 10 Class A ordinary shares)

0.18


(0.35)


(0.05)


(0.02)


(0.68)


(0.09)

Net earnings/(loss) per ADS attributable to ordinary shareholders – diluted (13
   ADS represents 10 Class A ordinary shares)

0.18


(0.35)


(0.05)


(0.02)


(0.68)


(0.09)

Weighted average number of ordinary shares used in computing
   earnings/(loss) per share, basic*

79,586,926


77,826,404


77,826,404


79,569,190


78,194,634


78,194,634

Weighted average number of ordinary shares used in computing
   earnings/(loss) per share, diluted*

79,899,412


77,826,404


77,826,404


79,569,190


78,194,634


78,194,634


Share-based compensation expenses included in:


Cost of revenues

(229)


(124)


(17)


(174)


(154)


(21)

Sales and marketing expenses

(184)


(598)


(83)


(237)


(728)


(102)

General and administrative expenses

(2,015)


(4,286)


(598)


(26,468)


(5,690)


(794)

Research and development expenses

(817)


(487)


(68)


(1,660)


(580)


(81)


*   Both Class A and Class B ordinary shares are included in the calculation of the weighted average number of ordinary shares outstanding, basic and diluted.


SO-YOUNG INTERNATIONAL INC.

Reconciliation of GAAP and Non-GAAP Results

(Amounts in thousands, except for share and per share data)


For the Three Months Ended


For the Six Months Ended


June 30,

2024


June 30,

2025


June 30,
2025


June 30,
2024


June 30,
2025


June 30,
2025


RMB


RMB


US$


RMB


RMB


US$


GAAP income/(loss) from operations

6,724


(47,106)


(6,575)


(30,109)


(90,520)


(12,636)


Add back: Share-based compensation expenses

3,245


5,495


766


28,539


7,152


998


Non-GAAP income/(loss) from operations

9,969


(41,611)


(5,809)


(1,570)


(83,368)


(11,638)


GAAP net income/(loss) attributable to So-Young International Inc.

18,941


(36,039)


(5,030)


(2,299)


(69,177)


(9,657)


Add back: Share-based compensation expenses

3,245


5,495


766


28,539


7,152


998


Non-GAAP net income/(loss) attributable to So-Young International Inc.

22,186


(30,544)


(4,264)


26,240


(62,025)


(8,659)


Mureka V7.5 Goes Live: Elevating AI Music Creation to New Heights

SINGAPORE, Aug. 15, 2025 /PRNewswire/ — The SkyWork AI Technology Release Week officially kicked off on August 11. From August 11 to August 15, one new model was launched each day for five consecutive days, covering cutting-edge models for core multimodal AI scenarios.

As of now, Skywork has already launched the SkyReels-A3, Matrix-Game 2.0, Matrix-3D, Skywork UniPic 2.0, and Skywork Deep Research Agent models. On August 15, the Mureka V7.5 model was officially launched, marking the successful conclusion of the SkyWork AI Technology Release Week.

Mureka V7.5 has reached new heights in its interpretation of Chinese songs. The model demonstrates significant improvements not only in vocal timbre and instrumental techniques but also in lyric articulation and emotional expression.

First, building on its robust understanding of Chinese musical styles and elements, Mureka’s comprehension model delivers profound insights — spanning traditional folk songs, operatic pieces, classic Mandopop hits, and contemporary folk music. This deep mastery of musical diversity and cultural nuances allows the model to precisely capture and express the unique artistic essence and emotional subtleties in both interpretation and generation of Chinese music.

Second, to achieve more authentic and emotionally expressive AI-generated vocals, we have significantly enhanced our ASR technology, tailoring it to musical characteristics and establishing it as a powerful complement to our comprehension module. This technology analyzes vocal performances at a granular level, going beyond basic lyric recognition to examine performance techniques including breath control, emotional dynamics, and articulation nuances. By intelligently parsing musical phrases, detecting natural breathing points, and identifying structural pauses – while maintaining precise section recognition – it delivers synthesized vocals with unprecedented structural coherence and perceptual realism.

The captured high-resolution vocal data is fed back into the generative model, significantly enhancing the synthesized vocals’ naturalness, breath realism, and emotional expressiveness while reducing mechanical artifacts. This enables AI-generated songs to achieve human-like fluidity — particularly when reproducing the distinctive rhythmic phrasing and breath control unique to Chinese vocal music.

This unique combination of culturally-informed expertise and our song-optimized ASR technology’s granular insights constitutes our definitive competitive advantage in Chinese music generation.

Mureka V7.5 not only “understands” melodic and rhythmic production requirements but also deeply interprets and replicates the nuanced emotions and artistic expressions inherent to different cultural contexts — especially Chinese music. This capability provides a robust technical foundation for generating music that is both culturally authentic and aesthetically compelling, balancing artistic depth with lifelike realism.

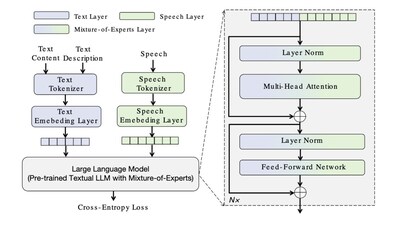
For voice models, the Skywork voice team has launched MoE-TTS — the first Mixture-of-Experts-based character-descriptive text-to-speech framework.

As a novel TTS framework specialized for out-of-domain descriptions, this technology enables precise control over vocal characteristics via natural language inputs (e.g., “a crystal-clear youthful voice with magnetic vocal fry”). Despite using only open-source training data, it achieves character voice consistency on par with or superior to proprietary commercial systems.

In recent years, descriptive TTS has demonstrated significant potential across virtual assistants, audio content creation, and digital humans. However, academic research has long been constrained by scarce description datasets and poor model generalization to open-domain semantics. These limitations frequently lead to mismatched vocal outputs — particularly when interpreting figurative language such as metaphors or analogies.

The introduction of MoE-TTS presents a promising solution to this core challenge. The framework innovatively integrates a pre-trained textual large language model (LLM) with specialized speech expert modules, employing dedicated experts for each modality. Its transformer architecture incorporates novel modality routing that enables independent optimization of text and voice pathways without interference. While keeping text parameters frozen, the framework achieves efficient cross-modal alignment, thereby delivering generalization capabilities with “zero knowledge degradation.”


In comprehensive evaluations spanning both in-domain and out-of-domain description test sets, MoE-TTS was benchmarked against leading proprietary TTS models across six dimensions. Results reveal MoE-TTS’s statistically significant advantages in acoustic control metrics — particularly Stylistic Expressiveness Alignment (SEA) and Overall Alignment (OA) — with these precision gains directly explaining its superior performance in complex linguistic description matching.

The release of MoE-TTS provides academia with the first reproducible out-of-domain TTS solution while conclusively demonstrating the efficacy of modality-decoupled architectures with frozen knowledge transfer in speech synthesis. This breakthrough marks a critical step toward transitioning the industry from “closed-label control” systems to “natural language free-form control” — a paradigm shift that will redefine user experiences across digital humans, virtual assistants, and immersive content creation platforms.

MoE-TTS is currently under active iteration, with plans to integrate it into the Mureka-Speech platform as a foundational model for character voice synthesis. This will provide global developers and creators with open, efficient, and customizable descriptive speech synthesis capabilities.

Experience the all-new V7.5 Model
Unlock infinite possibilities in music creation!

Try it now: www.mureka.ai

Tropical Storm LingLing Triggers Flood Warning in Laos

This photo is for representational purpose only.

The Department of Meteorology and Hydrology has issued a flood warning for multiple provinces in Laos from 16 to 19 August, due to the formation of Tropical Depression LingLing. 

According to the forecast, a mass of hot air over southern China, the northern South China Sea, and Taiwan is expected to cause a low-pressure system to strengthen into a tropical depression on 16 August. 

By 17 August, it will intensify into Tropical Storm LingLing and move toward the central South China Sea near central Vietnam.

As a result, Laos will see widespread rainfall ranging from light to moderate, with heavy to very heavy rain in some areas and strong winds in certain localities.

Specially, on 16-17 August, Vientiane Capital, Vientiane Province, Xaysomboun, Bolikhamxay, Khammouane, Savannakhet, Salavanh, Champasack, Sekong, and Attapeu may experience significant downpours and gusty winds. 

Then, on 18-19 August, rain is expected to spread to Phongsaly, Houaphanh, Xieng Khouang, Oudomxay, Bokeo, Luang Namtha, Luang Prabang, Xayabouly, Vientiane Capital, Xaysomboun, Vientiane Province, Bolikhamxay, Khammouane, and Savannakhet.

Authorities have identified areas with particularly high flood risk across Laos. 

In the northern region, the most vulnerable districts include Phongsaly (Samphanh, Khua, Bun Neua, Bun Tai), Bokeo (Merng, Paktha, Pha Oudom), Luang Namtha (Luang Namtha, Viengphoukha), Houaphanh (Xon, Hiam, Et, Xiengkhor, Sobbao, Kavanh), Xieng Khouang (Khoun, Phou Kout, Mokmai, Paek, Kham, Nong Het, Souy), Luang Prabang (Nan, Phonthong, Viengkham, Nam Bak, Xieng Ngeun), and Xayabouly (Xayabouly, Boten, Paklay).

In central, districts at high risk include Vientiane Province (Kasi, Vang Vieng, Xanakham), Xaysomboun (Thathom, Hom, Longsan, Anouvong), Bolikhamxay (Khamkeut, Bolikhan, Viengthong, Xaychamphone, Thaphabat), and Khammouane (Nakai, Yommalath, Boualapha, Xaybuathong, Khounkham).

Meanwhile, in southern Laos, the districts of Salavanh (Samouay, Ta-Oy), Sekong (Kaleum, Dakcheung), and Attapeu (Sanxay, Phouvong) are considered particularly vulnerable.

Authorities urge residents and officials to stay alert for heavy rain that may cause floods and to follow updates.