Home Blog Page 1391

“No Data, No Talk”: How Data Fundraising Is Redefining SME Growth in ASEAN

KUALA LUMPUR, MALAYSIA – Media OutReach Newswire – 30 January 2026 – In an era where investors are more selective than ever, SMEs can no longer rely on vision, passion, or static pitch decks alone. The new rule of fundraising is clear: No Data, No Talk.

Participants of the Data Fundraising Masterclass gather on Day 3 of the programme in Kuala Lumpur, where SME owners presented investor-ready pitch decks built using CapitalOS, BizPal’s data-driven corporate finance platform.


This message took centre stage at the
Data Fundraising Masterclass (12–14 December 2025) organised by BizPal by Simplyfi™, where close to 80 SME owners, founders, and senior leaders gathered to learn how technology, branding, and corporate finance must be integrated into a single, data-driven narrative to unlock capital and sustainable growth.

The three-day masterclass was designed to help SMEs move beyond siloed decision-making. Participants were guided through structuring their business models, identifying value drivers, and translating strategy into investor-ready financial narratives using CapitalOS — BizPal’s data-driven corporate finance platform that consolidates operational, strategic, and financial data into a coherent dashboard designed to speak the language of investors.

“I thank the team for their tireless preparation for the masterclass. Our mission is simple — SMEs should never walk into a funding conversation unsure of their numbers,” said Ms. Anya Tan, CEO of BizPal by Simplyfi™.

Rather than treating technology, brand, and finance as separate initiatives, CapitalOS demonstrated how these elements work together to form one credible, measurable story of enterprise value.

Technology as a Measurable Growth Strategy
As part of the programme, guest speaker Mr. Chris Teng, Sales Director of FSBM Holdings Berhad, shared insights on the role of technology in enterprise scalability.

“Every business today needs a clear technology blueprint — not just to operate efficiently, but to attract investors. Technology is the foundation of scalability. When you can demonstrate how your tech investments drive data, efficiency, and market access, your enterprise value naturally grows.”

This session reinforced a core principle of data fundraising: technology only creates value when it produces measurable outcomes. Within CapitalOS, participants learned how technology investments can be translated into operational metrics and long-term financial impact — moving technology from a backend function to a valuation driver.

Turning Brand and IP into Recognised Assets
In another session, Mr. Tee Lin Yik, CEO and Co-founder of Tee IP Sdn Bhd, addressed the growing importance of brand and intellectual property (IP) valuation in fundraising.

“Your marketing, design, and digital assets are not just expenses — they represent intangible value. When structured properly, these can be recognised as brand assets, contributing directly to enterprise valuation.”
Participants explored how branding and IP, when properly documented and governed, can be captured within CapitalOS as value-creating assets, strengthening credibility during fundraising discussions and due diligence.

Finance, Governance, and the Investor Lens
Concluding Day 2, Mr. Dylan Woon, Director of Sparta Haus, highlighted the importance of live data, governance, and transparency from an investor’s perspective.

“In the modern business environment, static reports are no longer enough. Investors expect live dashboards and clear governance trails. Platforms like CapitalOS help SMEs manage and present their data dynamically — aligning business strategy with financial credibility.”

Through guided exercises, participants learned to view their businesses from an investor’s lens — understanding how data consistency, governance discipline, and financial clarity directly influence valuation and funding decisions.

From Learning to Real Conversations
Beyond theory, the programme delivered tangible outcomes. Participants were guided to develop investor-ready pitch decks using AI-assisted tools, with many completing their decks during the three-day programme.

Several selected participants presented their pitch decks to investors and judging panelists on Day 3, leading to follow-up discussions and early expressions of interest.

Soft Launch of Global Mentorship Exchange (GMx)
Wrapping up Day 3 of the Data Fundraising Masterclass, BizPal also announced the soft launch of the Global Mentorship Exchange (GMx), a strategic ecosystem initiative designed to complement CapitalOS by connecting experienced business leaders with high-potential entrepreneurs.

BizPal Head of Innovation, Wayne, announcing the soft launch of the Global Mentorship Exchange (GMx) alongside Dato’ Jacky of Asia Success Media Group during Day 3 of the Data Fundraising Masterclass in Kuala Lumpur.

The initiative is built on a central premise: the greatest untapped resource in business is experience. GMx aims to make this experience more accessible by providing a structured platform where mentors, entrepreneurs, and investors can engage through data-backed evaluation, technology-enabled assessment, and transparent benchmarking.

GMx is positioned as a global exchange where experienced founders and industry leaders support emerging businesses not only through guidance, but through measurable insights aligned with investor expectations. By integrating mentorship with structured evaluation frameworks, GMx seeks to help high-potential SMEs gain visibility, credibility, and readiness for the global stage.

According to the organisers, the soft launch marks the first phase of a broader effort to formalise mentorship, recognition, and capital access into a single ecosystem — enabling experience, data, and technology to work together in supporting sustainable enterprise growth.

Validated by Participants
The impact of the masterclass was reflected in post-programme feedback:

  • Over 80% of respondents rated their likelihood to recommend the programme 8–10 on the Net Promoter Score (NPS) scale
  • Participants rated the programme an average of 4.52 out of 5 stars for value received relative to investment
  • The results highlight strong validation from SME owners on the programme’s relevance, practicality, and return on learning

Beyond the Masterclass
To ensure continuity and execution beyond the workshop, all participants have been invited to an upcoming online coaching session, where they will further strengthen their teams’ hands-on capability in using CapitalOS.
For SMEs interested in joining future cohorts, BizPal by Simplyfi™ is accepting early expressions of interest for upcoming Data Fundraising programmes in 2026.

Interested businesses can:
– Register interest for 2026 programmes: support@bizpal.tech
– Schedule a complimentary CapitalOS consultation: sales@bizpal.tech

One System, One Story
The masterclass demonstrated a clear framework:

  • Technology generates data
  • Brand amplifies enterprise value
  • Corporate finance translates strategy into investor language

CapitalOS ties these elements together, enabling SMEs to move from intuition-led decision-making to data-backed, investor-ready positioning.

Through its CapitalOS methodology, BizPal by Simplyfi™ is helping canvASEAN SMEs transition from intuition-led decision-making to data-backed, investor-ready businesses — proving that in today’s capital market, the conversation begins with data, or it doesn’t begin at all.

Hashtag: #NoDataNoTalk #DataFundraising #InvestorReady #CapitalReadiness #FinTech #BusinessValuation #ASEANSMEs


The issuer is solely responsible for the content of this announcement.

About BizPal by Simplyfi™

BizPal by Simplyfi™ empowers ASEAN SMEs to become investor-ready through data-driven corporate finance solutions. Its flagship platform, CapitalOS, consolidates operational, strategic, and financial data into a unified system that speaks the language of investors. By integrating technology, brand, and finance into one measurable narrative, BizPal helps SMEs transition from intuition-led decision-making to data-backed growth strategies.

DFI Retail Group Celebrates Multiple Wins in YouGov’s Best Brands 2025 in Hong Kong

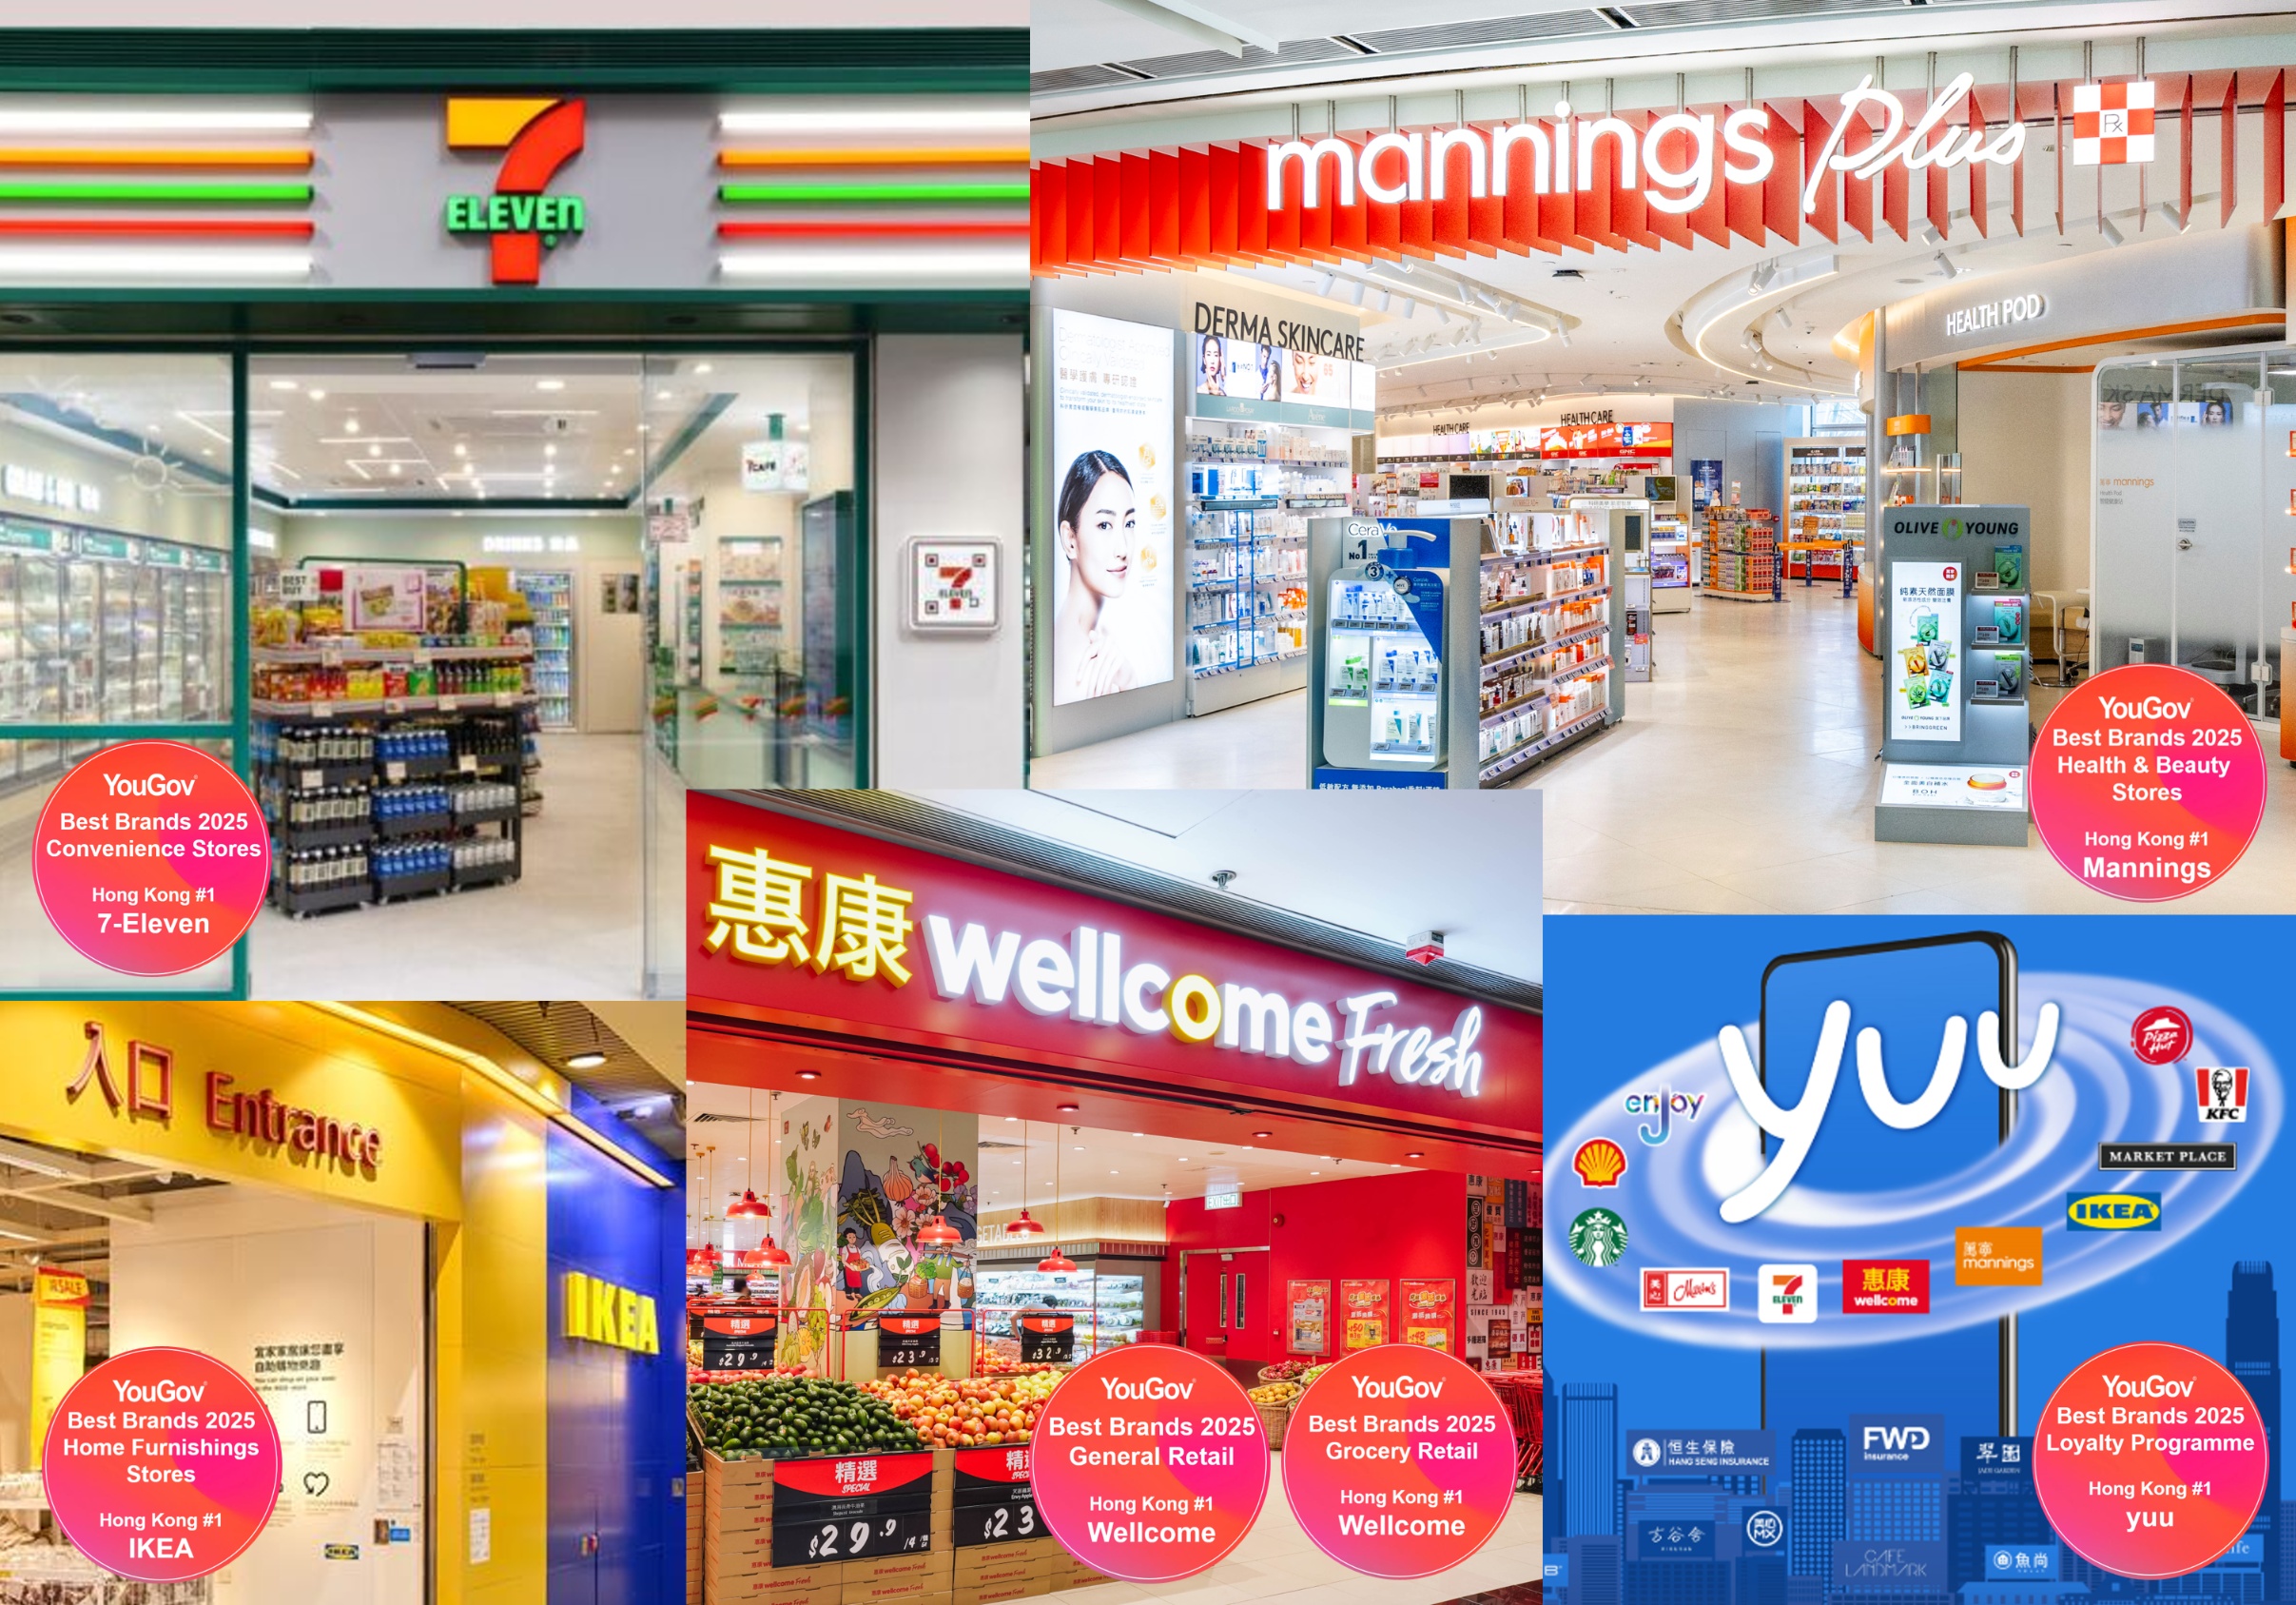
HONG KONG SAR – Media OutReach Newswire – 30 January 2026 – DFI Retail Group is delighted to have five of our brands recognised in YouGov’s Best Brands 2025 Hong Kong rankings, with leading positions across the General Retail and Loyalty Programme sectors. Each brand’s No. 1 ranking in its respective category further highlights the Group’s commitment to delivering trusted, high quality and customer-focused retail experiences to customers across Hong Kong.

DFI Retail Group Celebrates Multiple Wins in YouGov’s Best Brands 2025 in Hong Kong

Four of DFI’s well-known banners, Mannings, Wellcome, 7-Eleven and IKEA were featured in YouGov’s Top 10 General Retail Brands, demonstrating their strong brand health and long-standing consumer trust. In addition, the Group’s yuu Rewards, ranked No. 1 in the Loyalty Programmes category.

DFI brands also excelled across key retail categories:

  • Wellcome – No. 1 Grocery Retail & No. 1 in General Retail
  • Mannings – No. 1 Health & Beauty Stores & No. 3 in General Retail
  • 7-Eleven – No. 1 Convenience Stores & No. 8 in General Retail
  • IKEA – No. 1 Home Furnishing Stores & No. 2 in General Retail
  • yuu – No. 1 Loyalty Programme
The rankings are based on thousands of interviews conducted across Hong Kong from 1 January to 31 December 2025, measuring six brand health metrics (impression, quality, value, satisfaction, reputation, and recommendation). These achievements reflect the strength and breadth of DFI portfolio across health and beauty, convenience, food, home furnishings and loyalty programme.

As a Group, DFI remains focused on elevating everyday living for customers by delivering products, services and experiences they can rely on. These strong YouGov rankings demonstrate the meaningful connection DFI brands have built with the Hong Kong community. Looking ahead, DFI will continue investing in innovation, digital engagement, store enhancement and loyalty programmes to support long-term, sustainable growth for the communities it serves.

Hashtag: #DFIRetailGroup#Mannings#7-Eleven#Wellcome#IKEA#yuu#YouGov

The issuer is solely responsible for the content of this announcement.

DFI Retail Group

DFI Retail Group (the ‘Group’) is a leading Asian retailer, driven by its purpose to “Sustainably Serve Asia for Generations with Everyday Moments”. At 1 Dec 2025, the Group and its associates operated over 7,400 outlets and employed over 81,000 people. The Group is dedicated to delivering quality, value and service to Asian consumers through a compelling retail experience, supported by an extensive store network and highly efficient supply chains. The Group, including associates, operates a portfolio of well-known brands across five key divisions: health and beauty, convenience, food, home furnishings and restaurants.

Multi-Award Winning Phuket Marriott Resort & Spa, Merlin Beach: Voted Top 3 Best Family Resort

PHUKET, Thailand, Jan. 30, 2026 /PRNewswire/ — Recognized as the Top 3 in “Thailand’s Best Family Resorts” by readers of Holidays with Kids magazine, Phuket Marriott Resort & Spa, Merlin Beach solidifies its status as the ultimate family sanctuary for 2026. Located on the secluded Tri-Trang Beach just minutes from Patong, this multi-award-winning resort blends sustainable eco-adventures, world-class amenities, and 5-star relaxation to create a holiday experience that is truly second to none.

Phuket Marriott Resort & Spa, Merlin Beach - A family of three relaxes in a resort room with a view of the beach, featuring M Passport Family Package
Phuket Marriott Resort & Spa, Merlin Beach – A family of three relaxes in a resort room with a view of the beach, featuring M Passport Family Package

Experience the “Best Family Resort” Difference Celebrated by families worldwide, the resort has been honored as a Top 3 winner in Holidays with Kids magazine’s Readers’ Choice Awards for Thailand’s Best Family Resorts. Combined with consistent top-tier ratings on TripAdvisor, “Trip.Best” No.1 Family Resort in Phuket. Phuket Marriott Resort & Spa, Merlin Beach is a destination designed for connection. The resort sits on its own private stretch of white sand, surrounded by lush jungle and a protected house reef, offering families a unique “resort-within-a-resort” atmosphere where nature and luxury meet.

Why Families Choose an Award-Winning Stay Our commitment to creating the best family experience is evident in our diverse, high-quality amenities that cater to every generation:

  • Kids Club and Splash Zone:Kids Club alongside our exhilarating Splash Zone mini-water park with three landscaped pools and a splash pad.
  • Education Meets Adventure: We turn vacations into learning opportunities at our on-site Merlin House ReefEducation Center. Families can snorkel directly from the beach and learn about marine conservation, or visit our unique Butterfly Sanctuary to observe native species in the wild.
  • Dining for Everyone: With 10 diverse restaurants and bars, including the Japanese favorite Kanpai, the authentic Chang Thai, and the seaside Beach Grill, we ensure every palate is pleased.

Featured Package: To celebrate our status as a top family destination, we invite you to book the M Passport Package, designed to spark joy and curiosity in our youngest guests:

  • M Passport Pack: A special activity passport for children to explore the resort, complete challenges, and earn exclusive rewards.
  • Kids Eat Free: Children under 12 enjoy complimentary meals from the kids’ menu (up to 2 children per room, when accompanied by a dining adult).
  • Daily Breakfast: Delicious international buffet breakfast for 2 adults and 2 children.
  • Special Amenities: Kid’s Theme room decoration, Exclusive welcome gift for kids and child-friendly in-room amenities.
  • Inspiring Activities: Access to educational and fun activities at the Kids Club and Reef Education Center.

Book Your 2026 Adventure Today Discover why critics and guests alike call us the Best Family Resort in Phuket.

For reservations our exclusive deal M Passport Package
For more information please visit our website Phuket Marriott Resort & Spa, Merlin Beach

Aerial view of Phuket Marriott Resort & Spa, Merlin Beach, showcasing its expansive beachfront property with lush greenery, multiple swimming pools, and solar panel-equipped buildings along the turquoise coastline

EconomyBookings Statement to the Media

SYDNEY, Jan. 30, 2026 /PRNewswire/ — SIA Booking Group Corporation (trading as EconomyBookings) acknowledges the Australian Competition and Consumer Commission’s (ACCC) infringement notices and allegations regarding aspects of how prices were displayed to consumers on our website in the Australian market. The company has paid penalties totalling A$39,600.

The pricing display practice in question is no longer used. “We have updated our booking experience to make the total price more prominent earlier in the process, including any pre-selected optional extras, and to clearly label what is optional,” said Alens Baibekovs, Chairman of the Board, SIA Booking Group Corporation.

“We apologise to customers who may have experienced confusion as a result of this issue. While the total price was displayed prior to payment, we recognise that clearer pricing information earlier in the booking journey is important for customers to make informed choices.”

“We take this matter seriously. Our priority is honest, clear, and transparent communication with our customers. We are strengthening internal quality controls around pricing displays and compliance to ensure our customer experience meets both legal requirements and the standard of clarity customers expect,” Mr Baibekovs said.

Customers with questions about their booking can contact our customer support team through the websites contact form.

Payment of a penalty specified in an infringement notice is not an admission of a contravention of the Australian Consumer Law.


Youxin Technology Ltd Reports Financial Results for Fiscal Year 2025

GUANGZHOU, China, Jan. 30, 2026 /PRNewswire/ — Youxin Technology Ltd (Nasdaq: YAAS) (the “Company” or “Youxin Technology”), a software as a service (“SaaS”) and platform as a service (“PaaS”) provider committed to helping retail enterprises digitally transform their businesses, today announced its financial results for the fiscal year ended September 30, 2025.

Mr. Shaozhang Lin, Chief Executive Officer of Youxin Technology Ltd, commented, “In fiscal year 2025, we successfully completed our initial public offering and a follow-on offering, which substantially improved the Company’s liquidity and strengthened financial foundation. A key part of the R&D progress was the successful integration of AI models into our PaaS platform, enabling the generation of complex customized code through natural language and conversational interaction, which significantly enhanced development efficiency and user experience. With AI-enhanced solutions, we have already attracted clients from a broader range of industries, including cosmetics and cruise lines, and have reinforced the scalability of our platform. In parallel, by serving customers across multiple industries, we continued to expand the functionality of our PaaS platform and build multi-industry service capabilities, laying a solid foundation for a potential performance inflection in fiscal year 2026.”

Mr. Lin added, “Fiscal year 2025 marked a year of execution and capability building. Total revenues reached $0.54 million, representing a 3% increase from fiscal year 2024, primarily driven by the restart of our customized customer relationship management (CRM) system development services. Our net loss for the year was largely attributable to non-recurring items, including IPO- and follow-on-offering-related professional fees, warrant-related expenses, and investment losses, rather than any deterioration in our core operating performance.”

Mr. Lin continued, “The successful acquisition of Celnet Technology Co., Ltd. on October 29, 2025 advanced our internationalization strategy and enhanced our ability to serve multinational and large domestic enterprises through its extensive Salesforce implementation experience, further improving the practicality and enterprise readiness of our PaaS platform. Looking ahead, we plan to fully commercialize our R&D achievements and aim to achieve operating breakeven by fiscal year 2026. We will continue to promote our PaaS and SaaS solutions across various sectors and, together with our partners, pursue opportunities to expand into international markets, positioning the Company to support customers’ overseas expansion and sustainable growth in 2026 and beyond.”

Fiscal Year 2025 Financial Overview

  • Revenue was $0.54 million in fiscal year 2025, an increase of 3% from $0.52 million in fiscal year 2024.
  • Gross profit was $0.18 million in fiscal year 2025, compared to $0.34 million in fiscal year 2024.
  • Gross margin was 33% in fiscal year 2025, compared to 66% in fiscal year 2024.
  • Net loss was $9.65 million in fiscal year 2025, compared to $1.28 million in fiscal year 2024, mainly due to the professional fees incurred during the IPO and the follow-up offering, investment loss, and loss on issuance of warrant liabilities.
  • Cash was $9.91 million as of September 30, 2025, compared to $0.02 million as of September 30, 2024, significantly increasing cash reserves and liquidity.

Fiscal Year 2025 Financial Results

Revenues

Total revenues were $0.54 million in fiscal year 2025, an increase of 3% from $0.52 million in fiscal year 2024. The increase was mainly because the Company restarted the customized CRM system development services.

For the years ended September 30,

2025

2024

($)

Revenue

Cost of
Revenue

Gross
Margin

Revenue

Cost of
Revenue

Gross
Margin

Professional services

515,684

356,807

31 %

275,314

158,880

42 %

Payment channel services

21,590

–

100 %

206,526

–

100 %

Others

2,200

2,702

(23) %

39,401

20,768

47 %

Total

539,474

359,509

33 %

521,241

179,648

66 %

Revenue from professional services was $0.52 million in fiscal year 2025, an increase of 87% from $0.28 million in fiscal year 2024.

  • Revenue from customized CRM system development services was $0.29 million in fiscal year 2025. The Company did not generate revenue from customized CRM system development services in fiscal year 2024. The increase was mainly due to the Company restarting the customized CRM system development service.
  • Revenue from the additional function development services was $38,808 in fiscal year 2025, a decrease of 9% from $42,758 in fiscal year 2024. The decrease was mainly due to the less new needs of the function development from the existing clients for fiscal year 2025.
  • Revenue from subscription services was $0.19 million in fiscal year 2025, a decrease of 18% from $0.23 million in fiscal year 2024. The decrease was mainly due to the decreasing customized CRM system development services from 2023 to 2024, which led to the Company to provide less subscription service in the following periods.

Cost of Revenues

Cost of revenues was $0.36 million in fiscal year 2025, an increase of 100% from $0.18 million in fiscal year 2024.

Gross Profit

Gross profit was $0.18 million in fiscal year 2025, compared to $0.34 million in fiscal year 2024.

Gross margin was 33% in fiscal year 2025, compared to 66% in fiscal year 2024. 

Operating Expenses

Operating expenses were $3.04 million in fiscal year 2025, compared to $1.73 million in fiscal year 2024.

  • Selling expenses were $0.13 million in fiscal year 2025, an increase of 38% from $0.09 million in fiscal year 2024. The increase was mainly due to the increase in advertising and promotion expenses. The increase of advertising and promotion expenses by $25,661 or 3,270% was primarily due to an increase in putting effort to the business promotion to expand customer base for fiscal year 2025, compared to fiscal year 2024.
  • General and administrative expenses were $2.75 million in fiscal year 2025, an increase of 454% from $0.50 million in fiscal year 2024. The increase for fiscal year 2025 was primarily due to the professional fees incurred during the IPO and the follow-up offering that were not directly attributable of the offerings were expensed as incurred.
  • Research and development expenses were $0.16 million in fiscal year 2025, a decrease of 86% from $1.14 million in fiscal year 2024. The decrease was primarily attributed to the decrease in labor related costs including salary and welfare by $0.90 million or 94% for fiscal year 2025 compared to fiscal year 2024.

Other Income (Expense), Net

Total net other expense was $6.79 million in fiscal year 2025, compared to total net other income of $0.11 million in fiscal year 2024, primarily due to loss from investments of $2.74 million, issuance costs allocated to warrant liabilities of $0.88 million, and loss on issuance of warrant liabilities of $5.80 million in fiscal year 2025, partly offset by gains from change in fair value of warrant liabilities of $2.65 million.

Net Loss

Net loss was $9.65 million in fiscal year 2025, compared to $1.28 million in fiscal year 2024.

Basic and Diluted Loss per Share

Basic and diluted loss per share was $1.04 in fiscal year 2025, compared to $0.14 in fiscal year 2024.

Financial Condition

As of September 30, 2025, the Company had cash of $9.91 million, compared to $0.02 million as of September 30, 2024.

Net cash used in operating activities was $3.91 million in fiscal year 2025, compared to $0.73 million in fiscal year 2024.

Net cash used in investing activities was $3.03 million in fiscal year 2025, compared to net cash provided by investing activities of $360 in fiscal year 2024.

Net cash provided by financing activities was $16.79 million in fiscal year 2025, compared to $0.43 million in fiscal year 2024.

About Youxin Technology Ltd

Youxin Technology Ltd is a SaaS and PaaS provider committed to helping retail enterprises digitally transform their businesses using its cloud-based SaaS product and PaaS platform to develop, use and control business applications without the need to purchase complex IT infrastructure. Youxin Technology provides a customized, comprehensive, fast-deployment omnichannel digital solutions that unify all aspects of commerce with store innovations, distributed inventory management, cross-channel data integration, and a rich set of ecommerce capabilities that encompass mobile applications, social media, and web-based applications. The Company’s products allow mid-tier brand retailers to use offline direct distribution to connect the management team, distributors, salespersons, stores, and end customers across systems, apps, and devices. This provides retailers with a comprehensive suite of tools to instantly address issues using real-time sales data. For more information, please visit the Company’s website: https://ir.youxin.cloud.

Forward-Looking Statements

This press release contains “forward-looking statements” within the meaning of Section 27A of the Securities Act of 1933 and Section 21E of the Securities Exchange Act of 1934, each as amended. Forward-looking statements include all statements that do not relate solely to historical or current facts, including without limitation statements regarding the Company’s product development and business prospects, and can be identified by the use of words such as “may,” “will,” “expect,” “project,” “estimate,” “anticipate,” “plan,” “believe,” “potential,” “should,” “continue” or the negative versions of those words or other comparable words. Forward-looking statements are not guarantees of future actions or performance. These forward-looking statements are based on information currently available to the Company and its current plans or expectations and are subject to a number of risks and uncertainties that could significantly affect current plans. Should one or more of these risks or uncertainties materialize, or the underlying assumptions prove incorrect, actual results may differ significantly from those anticipated, believed, estimated, expected, intended, or planned. Although the Company believes that the expectations reflected in the forward-looking statements are reasonable, the Company cannot guarantee future results, performance, or achievements. Except as required by applicable law, including the security laws of the United States, the Company does not intend to update any of the forward-looking statements to conform these statements to actual results.

For more information, please contact:

Youxin Technology Ltd.
Investor Relations Department
Email: ir@youxin.cloud

Ascent Investor Relations LLC
Tina Xiao
Phone: +1-646-932-7242
Email: investors@ascent-ir.com


YOUXIN TECHNOLOGY LTD

CONSOLIDATED BALANCE SHEETS

AS OF SEPTEMBER 30, 2025 and 2024

(Expressed in U.S. dollars, except for the number of shares)

September 30, 2025

September 30, 2024

ASSETS

CURRENT ASSETS

Cash

$

9,912,327

$

18,372

Restricted cash

24,298

24,649

Accounts receivable, net

213,772

176,607

Deferred contract costs

13,103

–

Amount due from a related party

17,486

–

Prepaid expenses and other current assets

295,559

122,676

Total current assets

10,476,545

342,304

NON-CURRENT ASSETS

Property and equipment, net

2,518

3,948

Deferred offering costs

–

478,108

Operating lease right-of-use assets

78,862

123,170

Other non-current assets

10,457

10,608

Prepayment for acquisition

210,704

–

Total non-current assets

302,541

615,834

TOTAL ASSETS

$

10,779,086

$

958,138

LIABILITIES

CURRENT LIABILITIES

Short-term bank loan

$

318,865

$

323,472

Accounts payable

34,190

31,350

Contract liabilities

30,024

215,768

Amount due to related parties

–

1,067,119

Operating lease liabilities – current

46,190

42,277

Payroll payable

1,134,532

1,869,436

Warrant liabilities

902,287

–

Accrued expenses and other current liabilities

87,439

40,299

Total current liabilities

2,553,527

3,589,721

Operating lease liabilities – non-current

35,306

82,674

Total non-current liabilities

35,306

82,674

TOTAL LIABILITIES

$

2,588,833

$

3,672,395

COMMITMENTS AND CONTINGENCIES (NOTE 17)

SHAREHOLDERS’ EQUITY (DEFICIT)

Class A ordinary shares, ($0.008 par value, 5,000,000 shares authorized,
2,325,550 and 278,809 shares issued and outstanding as of September 30,
2025 and 2024, respectively) (1)

18,604

2,230

Class B ordinary shares, ($0.0001 par value, 100,000,000 shares authorized,
8,945,307 shares issued and outstanding as of September 30, 2025 and
2024, respectively)

895

895

Share subscription receivables

–

(3,125)

Additional paid-in capital

32,614,603

12,154,929

Accumulated deficit

(25,065,907)

(15,419,765)

Accumulated other comprehensive income

622,058

550,579

Total shareholders’ equity (deficit)

8,190,253

(2,714,257)

TOTAL LIABILITIES AND SHAREHOLDERS’ EQUITY (DEFICIT)

$

10,779,086

$

958,138

(1)

All per share amounts and shares outstanding for all periods have been retroactively adjusted to reflect the 80-for-1
reverse share split for Class A ordinary share of Youxin Technology Ltd, which was effective on September 30, 2025.


YOUXIN TECHNOLOGY LTD

CONSOLIDATED STATEMENTS OF OPERATIONS AND COMPREHENSIVE LOSS

FOR THE YEARS ENDED SEPTEMBER 30, 2025, 2024 and 2023

(Expressed in U.S. dollars, except for the number of shares)

2025

2024

2023

Years Ended September 30,

2025

2024

2023

REVENUES

$

539,474

$

521,241

$

895,978

COST OF REVENUES

(359,509)

(179,648)

(352,676)

GROSS PROFIT

179,965

341,593

543,302

OPERATING EXPENSES

Selling expenses

(130,792)

(94,481)

(225,926)

General and administrative expenses

(2,746,298)

(496,006)

(589,372)

Research and development expenses

(158,190)

(1,139,922)

(2,152,602)

Total operating expenses

(3,035,280)

(1,730,409)

(2,967,900)

NET LOSS FROM OPERATIONS

(2,855,315)

(1,388,816)

(2,424,598)

OTHER (EXPENSE) INCOME

Other income

539

134,802

99,053

Other expense

(24,271)

(21,435)

(17,693)

Loss from investments

(2,736,514)

–

–

Issuance costs allocated to warrant liabilities

(876,282)

–

–

Loss on issuance of warrant liabilities

(5,802,241)

–

–

Change in fair value of warrant liabilities

2,647,942

–

–

Total other (expense) income, net

(6,790,827)

113,367

81,360

NET LOSS BEFORE TAXES

(9,646,142)

(1,275,449)

(2,343,238)

Income tax expense

–

(5,212)

–

NET LOSS

(9,646,142)

(1,280,661)

(2,343,238)

Accretion to redeemable preferred equity

–

–

(326,837)

Net loss attributable to ordinary shareholders

(9,646,142)

(1,280,661)

(2,670,075)

NET LOSS

(9,646,142)

(1,280,661)

(2,343,238)

Other comprehensive income (loss)

Foreign currency translation income (loss)

71,479

(72,056)

(212,292)

TOTAL COMPREHENSIVE LOSS

$

(9,574,663)

$

(1,352,717)

$

(2,555,530)

Basic and diluted loss per share (1)(2)

$

(1.04)

$

(0.14)

$

(0.29)

Weighted average number of ordinary shares outstanding – basic
and diluted (1) (2)

9,311,589

9,224,116

9,224,116

(1)

All per share amounts and shares outstanding for all periods have been retroactively adjusted to reflect the 80-for-1 reverse
share split for Class A ordinary share of Youxin Technology Ltd, which was effective on September 30, 2025.

(2)

Giving retroactive effect to the issuance of ordinary shares effected on April 21, 2023.


YOUXIN TECHNOLOGY LTD

CONSOLIDATED STATEMENTS OF CASH FLOWS

FOR THE YEARS ENDED SEPTEMBER 30, 2025, 2024 and 2023

(Expressed in U.S. dollars, except for the number of shares)

2025

2024

2023

Years Ended September 30

2025

2024

2023

Cash flows from operating activities

Net loss

$

(9,646,142)

$

(1,280,661)

$

(2,343,238)

Adjustments to reconcile net loss to cash used in operating activities:

Loss (gain) on disposal of property and equipment

–

572

(357)

Amortization of right-of-use assets

42,002

101,888

204,715

Loss from Investments, net

2,814,514

–

–

Change in fair value of warrant liabilities

(2,647,942)

–

–

Issuance costs allocated to warrants liabilities

876,282

–

–

Loss on issuance of warrant liabilities

5,802,241

–

–

Depreciation

1,355

6,816

12,293

Credit loss provision

–

4,664

–

Loss from termination of right-of-use assets

–

183

369

Changes in operating assets and liabilities

Accounts receivable

(39,166)

52,210

94,595

Prepaid expenses and other current assets

(172,366)

18,020

69,605

Deferred contract costs

(13,103)

–

30,192

Amount due from a related party

(17,260)

–

–

Other non-current assets

–

16,950

28,368

Accounts payable

2,840

(21,098)

(14,007)

Operating lease liabilities

(43,455)

(100,073)

(207,881)

Payroll payable

(734,904)

404,216

102,096

Accrued expenses and other current liabilities

47,096

19,107

(18,026)

Contract liabilities

(185,744)

49,140

(268,907)

Net cash used in operating activities

(3,913,752)

(728,066)

(2,310,183)

Cash flows from investing activities

Proceeds from dispose of property and equipment

–

360

815

Purchase of short-term investment

(3,800,000)

–

–

Redemption of short-term investment

979,031

–

–

Prepayment for acquisition

(207,972)

–

–

Net cash (used in) provided by investing activities

(3,028,941)

360

815

Cash flows from financing activities

Loan from related parties

–

792,283

284,292

Repayment to related parties

(1,038,283)

–

–

Repayment of short-term bank loan

(314,731)

(315,090)

–

Proceeds from short-term bank loan

314,731

315,090

321,834

Proceeds from issuance of ordinary shares upon initial public offering, net of
underwriting commissions, discounts and other offering costs of $1,253,000

9,097,000

–

–

Proceeds from issuance of units upon follow-on offering, net of underwriting
commissions, discounts and other offering costs of $730,000

5,270,064

–

–

Proceeds from issuance of ordinary shares upon exercise of Series A Warrants

4,486,999

–

–

Proceeds from issuance of ordinary shares upon exercise of Series B Warrants

731

–

–

Payment of offering costs

(1,028,932)

(360,893)

(121,248)

Collection of subscription receivable

3,125

–

–

Net cash provided by financing activities

16,790,704

431,390

484,878

Effect of exchange rates on cash and restricted cash

45,593

(59,713)

5,194

Net increase (decrease) in cash and restricted cash

9,893,604

(356,029)

(1,819,296)

Cash and restricted cash at beginning of year

43,021

399,050

2,218,346

Cash and restricted cash at end of year

$

9,936,625

$

43,021

$

399,050

Cash

$

9,912,327

$

18,372

$

399,050

Restricted cash

$

24,298

$

24,649

$

–

Cash and restricted cash at end of year

$

9,936,625

$

43,021

$

399,050

Supplemental disclosure of cash flow information

Cash paid for interest expenses

$

9,377

$

10,237

$

257

Cash paid for income tax

$

264

$

–

$

–

Supplemental disclosure of non-cash investing and financing activities:

Accretion to redeemable preferred equity

$

–

$

–

$

326,837

Exchange redeemable preferred equity with Class A ordinary shares

$

–

$

–

$

12,154,929

Operating lease right-of-use assets obtained in exchange for operating lease
liabilities

$

–

$

140,844

$

–

Deferred offering costs charged against additional paid-in capital

$

478,108

$

–

$

–


GREENLAND TECHNOLOGIES HOLDING CORPORATION ANNOUNCES CLOSING OF UNDERWRITTEN PUBLIC OFFERING

EAST WINDSOR, N.J., Jan. 30, 2026 /PRNewswire/ — Greenland Technologies Holding Corporation (Nasdaq: GTEC) (“Greenland” or the “Company”), a technology developer and manufacturer of electric industrial vehicles and drivetrain systems for material handling machineries and vehicles, today announced the closing of its previously announced underwritten public offering of 5,083,330 units (the “Units”) at a public offering price of $1.20 per Unit. Each Unit consists of one ordinary share of the Company (each, an “ordinary share” and collectively, the “ordinary shares”) and four-fifths of one warrant (each, a “warrant” and collectively, the “warrants”), with each whole warrant exercisable for one ordinary share.

The Units were not certificated or issued as stand-alone securities. The ordinary shares and warrants included in the Units were immediately separable and were issued separately in the offering. The warrants are immediately exercisable upon issuance, have an exercise price of $1.20 per share, or by means of a zero price exercise, and will expire three years from the date of issuance. There is no established trading market for the Units or the warrants, and the Company does not intend to list the Units or the warrants on any securities exchange or other trading market. The ordinary shares are listed on The Nasdaq Capital Market under the symbol “GTEC.”

The gross proceeds from the offering were approximately $6.1 million, before deducting underwriting discounts and other offering expenses payable by the Company. The Company intends to use the net proceeds from the offering for working capital and general corporate purposes.

The offering was conducted on a firm commitment basis. Joseph Stone Capital, LLC acted as the sole underwriter for the offering. Hunter Taubman Fischer & Li LLC acted as U.S. securities counsel to the Company, and Sichenzia Ross Ference Carmel LLP acted as U.S. securities counsel to Joseph Stone Capital, LLC in connection with the offering.

The offering was made pursuant to a registration statement on Form S-1, as amended (File No. 333-292412) (the “Registration Statement”), which was declared effective by the U.S. Securities and Exchange Commission (the “SEC”) on January 26, 2026. The offering was made only by means of a prospectus forming part of the effective registration statement. A final prospectus related to the offering has been filed with the SEC and is available on the SEC’s website at www.sec.gov. Electronic copies of the final prospectus may be obtained from Joseph Stone Capital, LLC, by standard mail to Joseph Stone Capital, LLC, 585 Stewart Ave, Suite L60-C, Garden City, NY 11530, via email at corporatefinance@josephstonecapital.com, or by telephone at +1 (888) 302-5548.

This press release shall not constitute an offer to sell or the solicitation of an offer to buy the securities described herein, nor shall there be any sale of these securities in any state or jurisdiction in which such offer, solicitation or sale would be unlawful prior to registration or qualification under the securities laws of any such state or jurisdiction.

About Greenland Technologies Holding Corporation

Greenland Technologies Holding Corporation (Nasdaq: GTEC) is a technology developer and manufacturer of electric industrial vehicles and drivetrain systems for material handling machineries and vehicles. For more information, please visit the Company’s website at https://ir.gtec-tech.com.

Forward-Looking Statements

This press release contains forward-looking statements within the meaning of the Private Securities Litigation Reform Act of 1995. All statements other than statements of historical facts are forward-looking statements, including statements regarding the expected use of proceeds from the offering. These forward-looking statements involve known and unknown risks and uncertainties and are based on current expectations and projections about future events and financial trends that the Company believes may affect its financial condition, results of operations, business strategy and financial needs. Investors can identify these forward-looking statements by words or phrases such as “may,” “will,” “expect,” “anticipate,” “aim,” “estimate,” “intend,” “plan,” “believe,” “is/are likely to,” “potential,” “continue” or other similar expressions. The Company undertakes no obligation to update forward-looking statements to reflect subsequent occurring events or circumstances, or changes in its expectations, except as may be required by law. Although the Company believes that the expectations expressed in these forward-looking statements are reasonable, it cannot assure you that such expectations will turn out to be correct, and the Company cautions investors that actual results may differ materially from the anticipated results and encourages investors to review other factors that may affect its future results in the Registration Statement, the Company’s quarterly report on Form 10-Q, filed with the SEC on November 7, 2025, and other filings with the SEC.

OP Labs Launches OP Enterprise, a Production-Grade, Managed Blockchain Infrastructure Offering

NEW YORK, Jan. 30, 2026 /PRNewswire/ — OP Labs PBC (oplabs.co), a blockchain infrastructure provider that enables developers and enterprises to launch scalable, secure and customizable networks and applications, today announced OP Enterprise: its production-grade blockchain infrastructure offering.

With OP Enterprise, OP Labs handles operations, security, and scaling so enterprises can focus on shipping products, not running blockchains. Offering three tiers, OP Enterprise is designed to meet the needs of a variety of enterprise users:

  • Fully Managed: full blockchain hosting and operational services
  • Self Managed:you operate the blockchain, we support it
  • OP Mainnet:start on a proven public network, graduate to your own chain when ready

At launch, OP Enterprise supports key partners with Mission-Critical Support:

  • Unichain is built for high-performance DeFi. Uniswap Labs operates Unichain with OP Enterprise Mission-Critical Support—priority response for high-stakes moments where downtime isn’t an option.
  • Celo migrated to the OP Stack to leverage proven infrastructure for mobile-first payments around the globe. Serving millions of users, Celo operates their network with OP Enterprise Mission-Critical Support, ensuring enterprise-grade backing for consumer-facing applications in emerging markets, from Latin America to Africa.

“We chose the OP Stack for its flexibility and reliability, and the OP Enterprise team has been a top-tier partner in supporting Unichain at scale,” said Uniswap Founder Hayden Adams.

OP Enterprise seeks to refocus partners and institutions on what’s most important for their business: delivering differentiated products and business outcomes. Whether you’re a fintech building next-generation financial services, a centralized exchange launching tokenized products, a payments company building cross-border rails, or a financial institution exploring tokenization and digital assets—if you need infrastructure that performs without the operational burden, OP Enterprise is for you.

While most blockchains extract a percentage of every transaction, OP Enterprise offers something different: businesses can own their chain, and infrastructure becomes a revenue-generating asset, rather than a cost center.

OP Enterprise also solves the ecosystem partnership bottleneck, offering vendor and partner management at scale. OP Labs has onboarded several top-tier partners, integrated and ready to deploy on new chains. The team negotiates standard terms and fast-tracks partnerships that could otherwise delay a chain’s launch by 6-12 months. These integrations unlock faster settlements, lower costs, programmable assets, and 24/7 availability.

“OP Enterprise is a major focus for us in 2026,” said Jing Wang, Co-Founder of Optimism and CEO of OP Labs. “We have active engagements across fintech, exchanges, payments, and financial services. The OP Stack is becoming the standard for the next generation of financial systems.”

To learn more about OP Enterprise, please visit oplabs.co

About OP Labs
OP Labs is a blockchain infrastructure provider that enables developers and enterprises to launch scalable, secure and customizable networks and applications. The company serves fintechs, payment providers, institutions and crypto companies creating the next generation of onchain products. Optimism’s open-source OP Stack delivers Ethereum-grade security, nearly-free transactions, and the flexibility to meet complex business needs at scale.

Logo – https://laotiantimes.com/wp-content/uploads/2026/01/op_labs__logo.jpg

Philips Receives Frost & Sullivan’s 2025 Global Enabling Technology Leadership Recognition for Excellence in Digital Pathology-Healthcare Informatics

Philips is recognized for its market-leading innovation and comprehensive digital pathology ecosystem, driving global transformation in diagnostics and healthcare informatics

SAN ANTONIO, Jan. 30, 2026 /PRNewswire/ — Frost & Sullivan is pleased to announce that Philips has been awarded the 2025 Global Enabling Technology Leadership Recognition in the Digital Pathology–Healthcare Informatics sector for its outstanding achievements in delivering next-generation digital pathology innovation, accelerated workflow modernization, and clinical informatics. This recognition highlights Philips Healthcare’s consistent leadership in driving measurable outcomes, strengthening its global market presence, and delivering customer-centric innovation in an increasingly complex healthcare environment.

Frost & Sullivan evaluates companies through a rigorous benchmarking process across two core dimensions: strategy effectiveness and strategy execution. Philips Healthcare excels in both, demonstrating an ability to align long-term innovation strategy with global market demand while executing at scale with consistency and precision. “Philips leads the global healthcare industry in patent applications. This propensity for innovation has positioned the company at the forefront of one of the sector’s fastest-growing fields: digital pathology. Building on this legacy, Philips Healthcare has emerged as a global leader in digital pathology,” said Melissa Kenig, Senior Consultant at Frost & Sullivan.

Guided by a long-term growth strategy centered on digital innovation, customer partnerships, and scalable enterprise informatics, Philips has demonstrated a strong ability to adapt and lead in a rapidly evolving diagnostic ecosystem. The company’s sustained investments in digital pathology and AI-enabled1,2 informatics have enabled it to deliver value across diverse clinical environments, from large academic medical centers to multi-site laboratory networks.

Innovation remains foundational to Philips Healthcare’s approach. Its integrated digital pathology portfolio, including high-performance slide scanners, a robust image management system, advanced AI-powered2 workflows, cloud archiving by Cloud Data Services3, and full-lab workflow support, addresses the end-to-end needs of modern pathology practices. These capabilities are strengthened by the Philips IntelliSite Pathology Solution, the first digital pathology platform to receive FDA 510(k) clearance for primary diagnosis.

“As diagnostic demand grows and resources tighten, digital pathology is becoming foundational to modern care. Frost & Sullivan’s recognition underscores our commitment to turning innovation into meaningful impact by streamlining workflows, enabling collaboration, and accelerating diagnosis, while responsibly advancing AI to support better patient care,” said Martijn Hartjes, Business Unit Leader Clinical Informatics at Philips.

Philips’ commitment to customer experience further amplifies its global leadership. With more than 3,500 pathologists across over 40 countries leveraging Philips’ digital pathology platform, and over 38 million slides scanned globally, the company has built one of the largest, most clinically validated installed bases in the industry. Its structured implementation services, extensive training programs, and globally unified support organization ensure strong customer engagement, high system uptime, and seamless scalability across enterprise networks.

Frost & Sullivan commends Philips for setting the industry benchmark in competitive strategy, technology innovation, and global execution. Philips’s vision for open, interoperable, and AI-powered2 digital diagnostics is shaping the future of digital pathology and redefining what is possible for healthcare organizations seeking to improve diagnostic accuracy, speed, and collaboration at scale.

Each year, Frost & Sullivan presents the Enabling Technology Leadership Recognition to a company that demonstrates outstanding strategy development and implementation, resulting in measurable improvements in market share, customer satisfaction, and competitive positioning. The recognition honors organizations that are transforming their industries through forward-thinking innovation and growth excellence.

1 PIPS enables iSyntax files and with the Software Development Kit (SDK) third-party companies can use this for AI capabilities.
2 With Ibex AI, Ibex AI is Research Use Only (RUO) in the U.S.
3 With our partner AWS. Third party claims from AWS, which may not apply in all markets and may be updated from time to time. The functionalities and benefits of the solution depend on customer-specific configuration and use. Please contact your local Philips representative for (market) availability.

Frost & Sullivan Best Practices Recognition

Frost & Sullivan’s Best Practices Recognitions honor companies across regional and global markets that exhibit exceptional achievement and consistent excellence in areas such as leadership, technological innovation, customer experience, and strategic product development. Each recognition is the result of a rigorous analytical process in which Frost & Sullivan industry experts benchmark performance through comprehensive interviews, deep-dive analysis, and extensive secondary research. The goal is to identify true best-in-class organizations that are driving transformative growth and setting new industry standards.
Contact us: Start the discussion.

Contact:
Ashley Shreve
E: ashley.weinkauf@frost.com

About Philips

Royal Philips (NYSE: PHG, AEX: PHIA) is a leading health technology company focused on improving people’s health and well-being through meaningful innovation. Philips’ patient- and people-centric innovation leverages advanced technology and deep clinical and consumer insights to deliver personal health solutions for consumers and professional health solutions for healthcare providers and their patients in the hospital and the home.

Headquartered in the Netherlands, the company is a leader in diagnostic imaging, ultrasound, image-guided therapy, monitoring and enterprise informatics, as well as in personal health. Philips generated 2024 sales of EUR 18 billion and employs approximately 67,300 employees with sales and services in more than 100 countries. News about Philips can be found at www.philips.com/newscenter.