Home Blog Page 1599

Cypherpunk Accelerates Zcash Accumulation; Increases Treasury Holdings to 290,062.67 ZEC

CAMBRIDGE, Mass., Dec. 30, 2025 /PRNewswire/ — Cypherpunk Technologies Inc. (Nasdaq: CYPH) (“Cypherpunk”), the privacy-focused technology company, today announced a significant expansion of its corporate treasury. The company has acquired an additional 56,418.09 ZEC for approximately $29 million at an average price of $514.02 per ZEC.

This latest acquisition follows a series of strategic purchases over the preceding months. With this transaction, Cypherpunk’s total Zcash holdings now stand at 290,062.67 ZEC, representing an estimated 1.76% of the total circulating network supply. The company’s total ZEC position was acquired at a cumulative average price of $334.41 per ZEC.

“We continue to execute on our goal of accumulating 5% of the Zcash network.” said Will McEvoy, CIO of Cypherpunk. “As our Zcash position grows, we are well positioned for a market that is repricing the societal importance of privacy. We are excited to continue executing on our Zcash strategy while expanding our work across a broader set of privacy-preserving technologies and initiatives.”

About Cypherpunk

Cypherpunk Technologies Inc. is a privacy technology company implementing a digital asset treasury strategy anchored by Zcash and, through its subsidiary Leap Therapeutics, Inc., is developing novel therapies for patients with cancer. The Company is aiming to build long-term shareholder value by acquiring ZEC, participating in the development of Zcash, and continuing the development of sirexatamab and FL-501 to treat patients with cancer. For more information about the Company, visit our websites at http://www.cypherpunk.com and http://www.leaptx.com or view our public filings with the SEC that are available via EDGAR at http://www.sec.gov or via https://investors.leaptx.com/.

About Winklevoss Capital

Winklevoss Capital is an investment firm founded in 2012 by Cameron and Tyler Winklevoss that invests in frontier technologies.

Channels for Disclosure of Information
Going forward, we intend to announce material information to the public through filings with the Securities and Exchange Commission (SEC), the investor relations page on our website, press releases, public conference calls, public webcasts, our X account (@cypherpunk), and our LinkedIn page. The information disclosed in the foregoing channels could be deemed to be material information. As such, we encourage investors, the media, and others to follow the channels listed above and to review the information disclosed through such channels. Any updates to the list of disclosure channels through which we will announce information will be posted on the investor relations page on our website.

FORWARD-LOOKING STATEMENTS
This press release includes forward-looking statements within the meaning of Section 27A of the Securities Act of 1933, as amended, Section 21E of the Securities Exchange Act of 1934, as amended. These forward-looking statements generally can be identified by the use of words such as “anticipate,” “expect,” “plan,” “could,” “may,” “will,” “believe,” “estimate,” “forecast,” “goal,” “project,” and other words of similar meaning. Forward-looking statements address various matters including statements relating to ZEC or digital assets held or to be held by the Company, the expected future market, price and liquidity of ZEC or other digital assets the Company acquires, the macro and political conditions surrounding Zcash or digital assets, the Company’s plan for value creation and strategic advantages, market size and growth opportunities, regulatory conditions, competitive position and the interest of other corporations in similar business strategies, technological and market trends, and future financial condition and performance. Risks and uncertainties of the digital asset treasury strategy include, among others: (a) the risk that the Company will fail to realize the anticipated benefits of the digital asset treasury strategy; (b) changes in business, market, financial, political and regulatory conditions; (c) risks relating to the Company’s operations and business, including the highly volatile nature of the price of cryptocurrencies, including ZEC; (d) the risk that the price of the Company’s Common Stock may be highly correlated to the price of ZEC or other digital assets that it holds; (e) risks related to increased competition in the industries in which the Company does and will operate; (f) risks relating to significant legal, commercial, regulatory and technical uncertainty regarding digital assets generally; and (g) risks relating to the treatment of crypto assets for U.S. and foreign tax purposes. New risks and uncertainties may emerge from time to time, and it is not possible to predict all risks and uncertainties. No representations or warranties (expressed or implied) are made about the accuracy of any such forward-looking statements. The Company may not actually achieve the forecasts disclosed in such forward-looking statements, and you should not place undue reliance on such forward-looking statements. Such forward-looking statements are subject to a number of material risks and uncertainties including but not limited to those set forth under the caption “Risk Factors” in the Company’s most recent Annual Report on Form 10-K filed with the SEC, or as may be included in other reports or information we file with the SEC, as well as discussions of potential risks, uncertainties, and other important factors in its subsequent filings with the SEC. Any forward-looking statement speaks only as of the date on which it was made. Neither the Company, nor any of its affiliates, advisors or representatives, undertake any obligation to publicly update or revise any forward-looking statement, whether as a result of new information, future events or otherwise, except as required by law. These forward-looking statements should not be relied upon as representing the Company’s views as of any date subsequent to the date hereof.

CONTACT:

Douglas E. Onsi
President & Chief Executive Officer
Cypherpunk Technologies Inc.
617-714-0360
ir@cypherpunk.com 

For Investors:
Matthew DeYoung
Investor Relations
Argot Partners
212-600-1902
leap@argotpartners.com

For Media:
Jacqueline Ortiz Ramsay
It Factor Strategies
954-294-3249
jacqueline@itfactorstrategies.com 

The Korean ethnic group: Nongak dance shares joy of harvest season

BEIJING, Dec. 30, 2025 /PRNewswire/ — A news report from China.org.cn on the Korean ethnic group:

The Korean ethnic group: Nongak dance shares joy of harvest season

https://www.youtube.com/watch?v=hJ2_hQxXUAQ

In October, the autumn wind sweeps across the golden fields of northeast China, and the black soil embraces the harvest season. The Korean ethnic group don vibrant traditional costumes, strike sonorous gongs and drums, and perform the Nongak Dance – a celebration that brims with the joy of harvest.

Originating from agricultural labor, China’s Korean Nongak Dance is a highly comprehensive art form that integrates music, singing, and dance. From prayers for good fortune during spring plowing to jubilations after autumn harvest, Nongak Dance has long been intertwined with the Korean people’s daily work and life. It also holds the distinction of being China’s first dance-related UNESCO Intangible Cultural Heritage. What truly defines its charm, however, is its rich array of distinct dance styles, each weaving unique tales of the Korean ethnic culture.

The Janggu Dance stands as one of its most iconic forms. Dancers wield the janggu (a traditional long drum), their movements blending strength with grace as drumbeats sync seamlessly with their bodily expressions. Both men and women take part: female dancers exude tenacity and agility, while male performers showcase boldness and spontaneity.

The traditional Flat Drum Dance, performed in groups, features dancers moving in perfect unison with meticulous coordination. Every gesture is charged with power, recreating the collaborative spirit of farming and embodying the Korean people’s unity.

The Fan Dance captivates with its elegance and fluidity. Colorful silk fans come alive in the dancers’ hands, fluttering like butterflies in flight. Through the soft, lyrical nuances of Korean dance, it conveys a profound love for all creatures of nature.

The Crane Dance, a type of mimetic dance, masterfully merges art with cultural symbolism. In Korean culture, the red-crowned crane is a revered symbol of auspiciousness and longevity. Dancers glide with light, ethereal steps, vividly capturing the crane’s poise and essence.

Saving the best for last, the Sangmo Dance represents the pinnacle of Nongak Dance. Dancers wear specially crafted hats adorned with a 20-meter-long ribbon. With deft neck and head movements, they swing the ribbon, which arcs through the air in vibrant, fluid curves–a spectacle that sends the performance to its thrilling climax.

More than a feast for the eyes and ears, the Koreanethnic group’s Nongak Dance is a cultural expression deeply rooted in agrarian traditions. It allows audiences to feel the Korean people’s passionate zest for life, their gratitude for nature’s bounty, and the ethnic group’s unyielding optimism and vibrant vitality.

The Korean ethnic group: Nongak dance shares joy of harvest season

http://www.china.org.cn/2025-10/17/content_118128532.shtml


The “Eastern Wisdom” of Aging: How Taikang’s “New Life Insurance” Responds to a Global Challenge?

SHANGHAI, Dec. 30, 2025 /PRNewswire/ — Under the global background of ageing people, WallstreetCN reported how TaiKang play its wisdom in new-life-insurance.

In 2014, journalists from Japan’s NHK documented the phenomenon of A Society Without Bonds, portraying how the elderly in an atomized society—devoid of social, familial, or community ties—gradually become isolated and ultimately pass away alone.

A decade later, the Japanese drama Two in the Neighborhood (Douban rating 9.3) offers a starkly different narrative. Its two 55-year-old female protagonists no longer treat aging with tragic solemnity; instead, they put on face masks, lift weights casually, and remark with ease: “Humans simply can’t give up hope.”

Japan, China’s neighboring country, provides a vivid window into how attitudes toward aging have shifted from fear to composure amid profound, gradual demographic changes.

Young people are often captivated by youth, seldom envisioning their own twilight years. Yet the reality is that in twenty years, the silver-haired generation—now less visible in shopping malls and cinemas—will constitute a critical one-third of society.

According to the latest data from China’s Ministry of Civil Affairs, by the end of 2024, the population aged 60 and above had reached 310 million, accounting for 22.0% of the total populace. This figure is projected to rise to around 30% by 2035.

While the morning sun has set, the evening glow still shines bright.

China’s average life expectancy neared 79 years in 2024, continuing to increase by 2-3 years per decade. Concurrently, the older generation is moving beyond mindsets of self-denial and sacrifice, embracing their later years with positivity and savoring the depth and richness that time brings. Time, therefore, should be seen as a gift, not a burden.

From an industry perspective, the vast opportunities arising from the desire to “enjoy aging” in this longevity era are well-documented in developed nations. The U.S. Bureau of Labor Statistics, for instance, identified healthcare as one of the most promising sectors for 2017-2027.

A similar story is unfolding in China.

To address the industrial demands of a shifting demographic structure, China has established a personal pension system and piloted various commercial pension products, aiming to build a diversified payment framework for the senior care industry. Sectors like healthcare and wellness have emerged as new “blue oceans,” attracting a steady stream of entrants.

The most notable pioneers are insurance companies—entities with substantial capital and the unique capability to integrate healthcare and wellness resources. We observe that the life insurance industry has entered a new round of competition for the senior care market. Among these players, forward-thinking leaders have been cultivating the senior care track for over a decade, building supply chain networks spanning wellness, medical care, and real estate. Their efforts have yielded a distinctly Chinese model, different from those in the U.S. or Japan.

For example, since 2007, Taikang Insurance Group has been exploring ways to extend insurance into tangible healthcare, senior living, and wellness services.

In the latest Fortune Global 500 ranking, Taikang Insurance Group climbed to 334th place, up 47 spots from the previous year. In his new book Strategy Determines Everything, Chen Dongsheng—founder, chairman, and CEO of Taikang—articulates an innovation that integrates physical services into the traditional two-dimensional framework of liabilities and investments, creating a “three-pronged synergy.” He terms this model “New Life Insurance.”

1. How to Plan for Old Age?

The UN’s World Population Prospects 2024 reports that life expectancy has surpassed 75 years in half of all countries globally. By the late 2070s, the global population aged 65 and above is projected to exceed 2.2 billion.

Chen Dongsheng noted in his research for The Longevity Era that increased lifespans bring intense demands for funding and healthcare. Thus, the age of longevity is also an age of wealth and health. Following this logic, constructing a robust pension system is the most immediate challenge of this era. As life expectancy grows and the social dependency ratio tightens, the accumulated surplus of the basic pension fund for enterprise employees continues to decline, intensifying pressure on the system’s sustainability.

Moshe A. Milevsky, a Canadian retirement research expert, emphasized in his book Pensionize Your Nest Egg that the foundation of personal retirement planning lies in income sustainability. Individuals must ensure they accumulate sufficient financial resources during their working years to support themselves throughout retirement.

This sustainability does not rely solely on frugal savings during one’s prime.

Milevsky illustrates the point with an analogy: accumulating wealth is like filling a pool—its capacity depends on length, width, and depth. Similarly, one’s ability to build wealth hinges on the term, principal, and rate of return of financial products. Given these “three core factors,” long-term, compound-interest pension products have gained widespread popularity.

In the 1970s, the U.S. government incentivized employer and individual participation in the pension system through two key measures: first, adding Section 401(k) to the tax code, which offered tax advantages for employer-sponsored retirement plans (sparking the development of corporate pensions); second, establishing Individual Retirement Accounts (IRAs), laying the groundwork for the commercial third pillar of the pension system.

Among developed economies, the U.S. pension system is dominated by its second and third pillars, which account for over 90% of total assets. Japan’s system, meanwhile, relies primarily on its first and second pillars, achieving “universal insurance and universal pensions for all citizens.”

To address its own challenges of insufficient total pension assets and structural imbalance, China has also established a personal pension system. Pilot programs for innovative insurance products—such as exclusive commercial pension insurance and commercial pension plans—have delivered tangible results.

The Weighty Issue of Health

We cherish the richness and depth that time confers upon life, yet we cannot escape the afflictions of disease, loneliness, and frailty.

This is undeniably linked to individual constitution and the advancement of modern medicine. However, by stepping beyond traditional perspectives to redefine “health,” we may uncover broader, more insightful answers.

Before the mid-20th century, the “biomedical model” dominated medicine, reducing illness to abnormal physiological indicators and focusing on correction through drugs or surgery.

While invaluable for combating infectious and organic diseases, this model’s limitations became increasingly apparent as society developed: it overlooked psychological and social factors, failing to recognize that many chronic conditions are closely tied to emotional stress, cognitive patterns, and lifestyle choices.

In response, George Engel proposed the “biopsychosocial medical model” in 1977, advocating for understanding health and illness through the interplay of biological, psychological, and social factors. This model integrates prevention, healthcare, treatment, and rehabilitation into a holistic framework.

Long confined to theory due to technological constraints and systemic inertia, this approach is now being revitalized in today’s longevity era, as the needs of the silver-haired generation shift from mere “survival” to “development and enjoyment.”

As the demands of the elderly evolve, the senior care industry chain in many countries has matured, encompassing upstream players (investment, finance, and insurance with large capital pools), midstream entities (real estate and healthcare), and downstream support sectors (senior-specific products, tourism, and education).

Together, these elements form the systemic support for elderly health envisioned by Engel.

Today, the broader health industry is one of the largest globally. Medical and care services for the elderly and disabled are expanding rapidly, and community-based integrated senior care services are thriving.

2. The Rise of Institutions

It is evident that as the scope of demand widens, the elderly are shedding the stereotypical image of being self-sacrificing, restrained, and conservative. Instead, they are demonstrating diverse, individualized, and proactive needs.

Preferences regarding senior living arrangements offer a telling glimpse of this shift.

According to the Guide to a New Lifestyle for Aging Well—jointly released by Taikang Insurance and research firm AgeClub—a survey of 1,500 seniors showed a 17% year-on-year increase in visits to senior care communities in 2022. A growing number of older adults are actively abandoning traditional, solitary aging in favor of a high-quality, vibrant new life.

As hubs integrating pensions, real estate, and wellness, senior care institutions are a vital window into the longevity economy. Such assets have been common features in the aging trajectories of developed nations like the U.S. and Japan, with several distinct segments based on location, services, and profit models:

  • Active Adult Communities (AACs): Originating from the real estate sector, these are typically located in scenic suburbs or resort areas. Their primary profit model involves selling property ownership, and they do not provide medical care. Essentially, they are real estate projects with specialized senior-friendly amenities—such as golf courses and swimming pools—catering to independent seniors. The renowned Sun City is a prime example.
  • Nursing Communities (NCs): Catering to the physically or cognitively frail, or those with chronic illnesses, these communities are situated in areas with high elderly populations. They charge short-term rents, employ professional medical staff, and are equipped with advanced facilities to provide 24-hour care.
  • Continuing Care Retirement Communities (CCRCs): Striking a balance between AACs and NCs, these communities offer independent living, assisted living, and skilled nursing care. Residents can receive continuous care within the same community even if their health declines. Revenue comes from entry fees and monthly rents, which vary significantly based on housing type and service level.

Japan also features a distinctive community-based model centered around “convenience stores.”

Pioneered by retail giant Lawson, this approach leverages convenience stores to extend community care and health management services. Stores host consultation and product sales counters, providing professional advice and care support.

Unlike the U.S. and Japan, a significant number of China’s high-quality senior care institutions are founded by life insurance companies.

This strategic choice is logically sound from an investment perspective: insurers naturally hold substantial cash reserves and are among the few players with the capital strength to integrate real estate, healthcare, and wellness resources. Furthermore, the long-term, stable returns of well-run senior care communities align perfectly with the long-dated liability profile of insurance capital.

Notably, top-performing CCRCs often yield returns superior to bonds while offering greater stability than stocks or commodities. U.S. commercial real estate firm CBRE reported that from 2004 to 2018, facility-based senior housing communities delivered an average annualized investment return of 14.6%, with asset appreciation and operational income contributing 7.6% and 7% annually, respectively—outperforming commercial real estate sectors like apartments, offices, and hotels.

3. Lessons from Abroad

Thanks to their inherent long-term, compound-interest nature—a natural fit for retirement planning—life insurers have the potential to lead in both the pension and senior care markets.

However, in the fiercely competitive U.S. market, the life insurance industry—once a dominant force—has long since lost its leading position.

During the critical period of rising life expectancy, U.S. life insurers failed to adequately prioritize the middle class, mistakenly believing that demand for annuity products from affluent individuals was the key to growth.

This misjudgment led the industry to largely miss out on the health insurance market. For instance, in 1995, MetLife sold its health insurance business for $1.5 billion, later finding itself unable to compete effectively in that sector. Meanwhile, the booming asset management and mutual fund industries further captured the savings needs of the middle class.

After setbacks in these two key markets, U.S. life insurers faltered in the pension arena.

Today, traditional life insurance premiums account for less than 30% of the pension system, down from a peak of nearly 80% in 1950.

Moreover, U.S. life insurance companies rarely make direct investments in senior living real estate.

The investment landscape for U.S. senior care communities is dominated by real estate developers and established REITs (Real Estate Investment Trusts). These entities either lease the communities to operators for rent or adopt a management contract model, paying operators 5-6% of revenue while bearing the risks themselves.

Sun City exemplifies the real estate developer-led model.

Its originator, developer Del Webb, noticed that Arizona’s hot, dry, sunny climate was ideal for retirees from colder northern states. Seizing the opportunity, Webb began constructing communities tailored for this demographic.

At the time, the “active community” concept was nascent. A cautious Webb initially released a limited number of homes, complemented by a shopping center, recreation center, and golf course. On opening day, his community drew 100,000 visitors, causing traffic jams. Webb soon graced the cover of Time magazine.

Unlike in China, cash-rich U.S. insurers did not enter the market directly. Instead, they invested indirectly through REITs. For example, AIG invested in California CCRCs via REITs, and MetLife also holds indirect stakes in numerous senior living communities through healthcare REITs.

However, communities operated solely by real estate developers have inherent limitations.

The Longevity Era points out that both active communities and CCRCs create a sense of superiority through high-quality consumption, making residents feel their lifelong efforts have been rewarded. This reliance on a superiority-oriented mindset ties the industry’s fate closely to a nation’s economic strength, middle-class size, and pension system.

As lifespans extend, this high-consumption model—lacking integrated financial tools—inevitably faces the risk of retirees outliving their savings.

The U.S. experience offers two key lessons: First, facing the “blue ocean” of senior care, the life insurance industry must decisively seize the strategic window for developing pensions and the senior care industry. Second, a senior care community only achieves a true closed-loop of service and security when it incorporates a complete mechanism for recycling individual funds.

4. The “New Life Insurance” Model

The term “New Life Insurance” was first introduced by Chen Dongsheng during an academic conference in late 2023.

Shortly after, in a signed article titled Embracing New Life Insurance for High-Quality Industry Development, he elaborated on the concept. He proposed adding a “service end”—encompassing medical care, senior living, health, and wellness—to the traditional two-dimensional structure of liabilities and investments.

Later that year, in his book Strategy Determines Everything, he discussed the bottlenecks faced by the life insurance industry in mature Western markets, stressing that seizing strategic opportunities is key to achieving leapfrog development.

In the year that followed, this “New Life Insurance” model—restructuring the industry’s value chain—sparked widespread discussion.

For years, senior care communities have been one of Taikang’s most recognizable flagship offerings. In fact, many perceive Taikang first and foremost as a professional, high-end, and valuable senior care service provider, and only secondarily as a leading insurer.

Also in Strategy Determines Everything, Chen Dongsheng shares for the first time the original intent behind the company’s senior care strategy, the doubts, challenges, and hardships faced during its execution, and the perseverance that followed. He condenses years of experience and reflection into the book’s title.

For a long time, the primary contributor to the life insurance value chain has been the interest spread from the asset side.

But over the past two decades, global mature markets have been trapped in a low, even zero-interest-rate environment, putting long-term pressure on investment returns. China’s life insurance industry has also entered a “deep-water zone” of transformation in the last five years, with diminishing marginal benefits across the value chain. Meanwhile, the advent of the longevity era presents new, unavoidable challenges for individuals concerning health and wealth in old age.

Thus, the entire industry faces immense pressure: the challenges are clear, but the path forward is not.

Failure to seize this critical strategic period could lead, at best, to a fate like the U.S. life insurance industry—relegated to a secondary role, ceding market share. At worst, companies could face bankruptcy due to interest spread pressure, potentially triggering systemic risk.

The “New Life Insurance” model, characterized by the three-pronged synergy of “Payment + Services + Investment,” is Taikang’s proposed solution.

By incorporating the “service end,” Taikang’s “Happiness Plan” insurance product provides long-term, stable cash flow, enhancing clients’ ability to pay for future services. Comprehensive medical and wellness services, in turn, stimulate insurance sales, while high-return assets like senior care communities help alleviate “asset scarcity.” Robust investment returns stabilize the interest spread, naturally boosting the competitiveness of the insurance products.

This increasingly detailed blueprint also explains why, while state-owned and centrally-administered enterprise giants have been slow to activate their senior care engines, Taikang embarked early on the “more challenging path” of building its own asset-heavy communities.

The book highlights several key milestones in Taikang’s senior care journey:

  • 2007: Identified senior care services during its search for a “second growth curve.”
  • 2009: Secured the first regulatory pilot approval from the China Insurance Regulatory Commission (CIRC) for a life insurer to operate a senior care community.
  • 2012: Launched “Happiness Plan,” its first large-scale annuity product linked to a senior care community, and began constructing its high-end community, Taikang Home•Yanyuan. This marked a breakthrough from the traditional life insurance model to a “payment + senior care services” approach.

Thereafter, Taikang’s strategy crystallized. It moved into healthcare, building rehabilitation hospitals for each community, and expanded its service network into end-of-life care, forming three interconnected closed loops: Longevity, Health, and Wealth.

This journey was inevitably fraught with challenges best left unsaid.

On the title page of Strategy Determines Everything, Chen Dongsheng inscribed: “Pursue pure goals, stay single-minded, do the right thing—time is the answer.”

As of 2025, Taikang has cumulatively invested more than RMB 50 billion in the construction and operation of healthcare and elderly-care services. In addition, over RMB 17 billion has been invested in companies across the broader healthcare ecosystem. Taikang Home has developed 47 projects in 37 cities nationwide, with a resident population exceeding 20,000.

The “Happiness Plan” has evolved into four systems: “Longevity Plan,” “Health Plan,” “Wealth Plan,” and “Graceful Aging Plan,” serving a total client base exceeding 300,000. Its team of Health and Wealth Planners has grown to over 20,000 members.

Genuine three-pronged synergy constitutes Taikang’s unique “moat” in both the life insurance and senior care markets. From 2007 into 2025, Taikang is narrating not just a corporate story for the Chinese market, but a Chinese story for the global stage.

In 2025, amid economic transition, shifting growth drivers, industry transformation, and capital market pressures, Taikang continued to execute its “New Life Insurance” strategy. It achieved annual growth in revenue, new business value, and net profit, while maintaining sufficient solvency. Having navigated the senior care sector for nearly two decades, Taikang’s industry-leading strategy has been consistently validated by time. The market has good reason to expect even greater value from “New Life Insurance” in the future.


 

2025, They’re Living in Zhongshan

ZHONGSHAN, China, Dec. 30, 2025 /PRNewswire/ — A report from Zhongshan Daily & Zhongshan International Communications Center: 


They come from all over the world—the United States, Canada, Egypt, Russia… yet they call Zhongshan home. They are scientific researchers, entrepreneurs, soccer coaches, restaurant owners, preschool teachers, singers…In 2025, we captured the stories of 30 people from different countries and regions living and working in Zhongshan, Guangdong. How was life for them in 2025? What does Zhongshan look like through their eyes? And what are they looking forward to in 2026?


SANY Commences Operations at its First Engineering Machinery Remanufacturing Base in Hainan

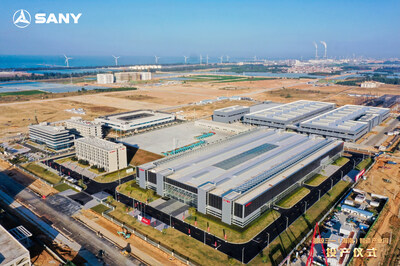
DONGFANG, China, Dec. 30, 2025 /PRNewswire/ — SANY Group officially commenced operations of its first global engineering machinery remanufacturing base, the SANY Hunan-Hainan Intelligent Manufacturing Industrial Park (the “Park”), on December 23 in Dongfang City of Hainan Province. The event marks a key milestone in SANY’s globalization and sustainability strategy, and on the opening day, the group secured orders worth CNY100 million (USD14.27 million) from Southeast Asia and Africa.

SANY Launches First Global Engineering Machinery Remanufacturing Base in Hainan

The Park is China’s first industrial park co-constructed by a pilot free trade zone (FTZ) and a pilot free trade port, and it is taking the cross-regional linkage development of Hunan and Hainan a step further, leveraging both provinces’ respective industrial and policy advantages to support Chinese companies in expanding their global footprint.

The Park, which commenced construction in August 2023, covers an area of 150 mu (approximately 10 hectares). And with a total investment of CNY600 million (USD85.62 million), it’s expected to achieve an annual output value of about CNY750 million (USD107.02 million) once operating at full capacity.

Strategically positioned as a regional remanufacturing center and resource distribution platform serving both domestic and international markets, the Park focuses on the maintenance and remanufacturing of core engineering machinery components and second-hand equipment from domestic and international markets, promoting the circular reuse of industrial resources.

In addition, under the framework of the Hainan FTZ, eligible value-added processing activities are entitled to tariff preferences, while remanufacturing operations can be conducted under bonded supervision and may qualify for corporate and personal income‑tax incentives. ThePark benefits from the “Dual 15%” tax‑incentive policy and has received approval for its outsourced processes to enjoy a 15% corporate income‑tax reduction.

“The project represents a key strategic initiative for SANY to deepen its globalization, digitalization, and low-carbon transformation. Moving forward, SANY will continue to actively explore new models for remanufacturing, promote the circular reuse of industrial resources, and jointly advance the global engineering machinery industry’s transition toward a greener, low-carbon future,” said Tang Xiuguo, Chairman of SANY.


Empowering an Affordable Energy Future with Solar Energy Solutions by Felicitysolar

The Rise of Solar Energy Battery Storage Systems in the U.S. Market

GUANGZHOU, China, Dec. 30, 2025 /PRNewswire/ — As energy costs continue to rise, more and more households and businesses in the U.S. are turning to solar energy solutions to reduce their electricity bills. According to the latest data from the U.S. Energy Information Administration (EIA), the average residential electricity price for 2025, as of October, has reached $17.27 per month, surpassing the average of $16.48 for the entirety of 2024. Similarly, the average commercial electricity price for 2025, as of October, has risen to $13.48, compared to the average of $12.75 in 2024.

This increasing energy cost is driving demand for solar energy storage systems, which allow users to maximize the benefits of their solar energy production while saving on electricity costs. As a leading solar energy company, Felicitysolar continues to innovate in providing off-grid and hybrid solar energy storage solutions.

Key Considerations When Choosing Solar Energy Storage Systems in the U.S.
When selecting a solar energy battery storage system in the U.S., users typically focus on several key factors to ensure reliability, safety, and efficiency:

1. Safety and Compliance
Safety is a top concern for users. Felicitysolar addresses this by integrating fire protection modules into its critical models. Additionally, key products such as the LUX-X-48100LG01-US and LUX-Y-48280LG01 have earned UL9540A, UL1973, FCC, and UL60730 certifications, meeting the rigorous safety standards required in the U.S. market.

2. Data Visualization and Smart Monitoring
As solar energy solutions become more sophisticated, users increasingly seek systems that offer smart monitoring capabilities. Platforms like the one offered by Felicitysolar allow users to monitor their system’s performance in real time, providing intuitive insights to help manage energy consumption and optimize energy use.

3. Reliability
Ensuring that systems remain operational without interruptions is essential for many consumers. Features like real-time fault detection and alerts are commonly integrated into advanced systems, helping users quickly address any issues that may arise. This focus on reliability is key to maintaining a consistent energy supply.

4. Ease of Installation
Simplifying installation is crucial for both installers and users. Felicitysolar products are designed with features like external fuse designs (FLB series 24V and 48V LiFePO4 batteries), integrated grounding bracketsand battery modules automatic addressing (FLH series 48V100Ah, FLH48100UG2). These thoughtful features reduce installation time and complexity, ensuring a more cost-effective and efficient setup process.

Felicitysolar: Expertise and R&D Strength
Founded in 2007, Felicitysolar has accumulated nearly 20 years of experience in the solar energy industry, providing cutting-edge solar energy solutions globally. With more than 170 patented technologies, the company remains committed to continuous innovation. Every year, they invest 10% of their revenue into R&D, and by 2026, they aim to expand their R&D team to over 400 experts. Meanwhile, a new photovoltaic and energy storage R&D and manufacturing base project was officially launched on December 25, with a total construction area of nearly 190,000 square meters and a site area of 50,539 square meters, further strengthening the company’s long-term research and innovation capabilities.

Their advanced technology portfolio includes a wide range of products such as solar energy battery storage, off grid inverters, hybrid inverters, and lithium batteries in various configurations, including 12V, 24V, and 48V LiFePO4 batteries, to meet the diverse needs of their customers.

Looking Ahead: The New Year of Service
As Felicitysolar steps into 2026, they are placing an even greater emphasis on customer service, alongside their ongoing commitment to product quality. The company is proud to announce that 2026 will be their “Year of Service,” focusing on providing fast and efficient delivery services, pre- and post-sales support, technical assistance, and marketing guidance to help build long-term trust with their partners.

Felicitysolar is dedicated to making solar energy solutions more accessible and reliable for everyone, aiming to provide a more sustainable and greener energy future for all.

Empowering an Affordable Energy Future with Solar Energy Solutions by Felicitysolar

CONTACT:
Felicitysolar
https://felicitysolar.com
sales@felicitysolar.com 

Delixy Holdings Limited Reports Unaudited Financial Results for the First Six Months of Fiscal Year 2025

SINGAPORE, Dec. 30, 2025 /PRNewswire/ — Delixy Holdings Limited (Nasdaq: DLXY) (the “Company” or “Delixy”), a Singapore-based company engaged in the trading of oil related products, today announced its unaudited financial results for the six months ended June 30, 2025.

First Six Months of Fiscal Year 2025 Financial Summary

  • Revenue was $102.0 million for the six months ended June 30, 2025, compared to $143.8 million for the same period last year.
  • Gross profit was $1.1 million for the six months ended June 30, 2025, compared to $1.8 million for the same period last year.
  • Net income was $0.6 million for the six months ended June 30, 2025, an increase from $0.5 million for the same period last year.
  • Basic and diluted income per share was $0.04 for the six months ended June 30, 2025, an increase from $0.03 for the same period last year.

Mr. Dongjian Xie, Executive Chairman and Chief Executive Officer of Delixy, commented, “During the first half of fiscal year 2025, we remained focused on efficiency while navigating a dynamic market environment. This approach allowed us to strengthen profitability and deliver improved operating results. While revenues during the period reflected softer market activity, our general and administrative expenses declined significantly year-over-year, reflecting streamlined corporate operations and strong expense controls. As a result, our profits from operations increased to $0.4 million from $0.2 million for the same period last year, and net income rose to $0.6 million from $0.5 million.

“On July 9, 2025, our ordinary shares commenced trading on Nasdaq following our initial public offering (the “IPO”), marking a major milestone for Delixy. The IPO strengthened our balance sheet, enhanced our visibility in the capital markets, and further improved our corporate governance framework. Looking ahead, we plan to continue to emphasize disciplined execution and prudent growth initiatives. With the foundation established as a public company, we believe Delixy is well positioned to pursue sustainable growth and create long-term value for our shareholders.”

First Six Months of Fiscal Year 2025 Unaudited Financial Results

Revenues

Revenues were $102.0 million for the six months ended June 30, 2025, a decrease from $143.8 million for the same period last year. The decrease was primarily attributable to the lower selling price, following weak oil demand and lower international oil price in first half of 2025.

Cost of Revenue

Cost of revenue was $100.9 million for the six months ended June 30, 2025, a decrease from $142.0 million for the same period last year. The decrease was primarily due to a weaker world oil market, with lower oil price we traded in. 

Gross Profit

Gross profit was $1.1 million for the six months ended June 30, 2025, a decrease from $1.8 million for the same period last year.

General and Administrative Expenses

General and administrative expenses were $0.7 million for the six months ended June 30, 2025, a decrease from $1.6 million for the same period last year. The decrease was primarily driven by less vessel chartering and less logistics expense due to a high stocks of crude oil and oil products in far east.

Net Income

Net income was $0.6 million for the six months ended June 30, 2025, an increase from $0.5 million for the same period last year.

Basic and Diluted Income per Share

Basic and diluted income per share was $0.04 for the six months ended June 30, 2025, an increase from $0.03 for the same period last year.   

Financial Condition

As of June 30, 2025, the Company had cash and cash equivalents of $1.8 million, compared to $5.6 million as of June 30, 2024.

Net cash used in operating activities was $0.6 million for the six months ended June 30, 2025, compared to $1.4 million for the same period last year.

Net cash used in investing activities was $0.5 million for the six months ended June 30, 2025, compared to net cash provided of $1.3 million for the same period last year.

Net cash used in financing activities was $2.7 million for the six months ended June 30, 2025, compared to $2.5 million for the same period last year.

About Delixy Holdings Limited

Delixy Holdings Limited is a Singapore-based company principally engaged in the trading of oil-related products, including (i) crude oil and (ii) oil-based products such as fuel oils, motor gasoline, additives, gas oil, base oils, asphalt, naphtha (heavy gasoline) and petrochemicals. Operating across multiple countries in Southeast Asia, East Asia, and Middle East, Delixy has established a strong presence in the region’s oil trading markets. While Delixy maintains a diversified portfolio of oil products, crude oil trading represents a core aspect of its business. The Company leverages its strong existing relationships with customers and suppliers as well as deep industry expertise to provide value-added services, including tailored recommendations on optimal trading strategies and shipping and logistical support where required. In addition, the Company’s financing capabilities allow it to extend credit terms to customers while satisfying suppliers’ immediate payment terms. For more information, please visit the Company’s website: https://ir.delixy.com.

Forward-Looking Statements

Certain statements in this announcement are forward-looking statements. These forward-looking statements involve known and unknown risks and uncertainties and are based on the Company’s current expectations and projections about future events that the Company believes may affect its financial condition, results of operations, business strategy, and financial needs. Investors can find many (but not all) of these statements by the use of words such as “believe”, “plan”, “expect”, “intend”, “should”, “seek”, “estimate”, “will”, “aim” and “anticipate” or other similar expressions in this prospectus. The Company undertakes no obligation to update or revise publicly any forward-looking statements to reflect subsequent occurring events or circumstances, or changes in its expectations, except as may be required by law. Although the Company believes that the expectations expressed in these forward-looking statements are reasonable, it cannot assure you that such expectations will turn out to be correct, and the Company cautions investors that actual results may differ materially from the anticipated results and encourages investors to review other factors that may affect its future results in the Registration Statement and other filings with the U.S. Securities and Exchange Commission (the “SEC”).

For media inquiries, please contact:

Delixy Holdings Limited
Investor Relations Department
Email: ir@delixy.com

Ascent Investor Relations LLC
Tina Xiao
Phone: +1-646-932-7242
Email: investors@ascent-ir.com


DELIXY HOLDINGS LIMITED AND SUBSIDIARIES

CONSOLIDATED BALANCE SHEETS

(UNAUDITED)

(Amount in USD thousands, except for share and per share data, or otherwise noted)

As of Jun 30, 
2024

As of Jun 30,
2025

US$’000

US$’000

ASSETS

Current assets:

Cash and cash equivalents

5,609

1,824

Accounts receivable, net

3,772

18,648

Deposits, prepayments and other receivables

34

502

Derivative financial instruments

312

831

Total current assets

9,727

21,805

Non-current assets:

Property and equipment, net

4

1

Right-of-use assets, net

99

37

Deferred offering costs

1,152

2,492

Total non-current assets

1,255

2,530

TOTAL ASSETS

10,982

24,335

LIABILITIES AND SHAREHOLDERS’ EQUITY

Current liabilities:

Accounts payable

2,521

18,227

Accrued liabilities

87

51

Dividend payables

2,245

Amount due to shareholder

99

1

Lease liabilities

62

38

Income tax payable

157

105

Total current liabilities

5,171

18,422

Non-current liabilities:

Lease liabilities

36

Loan from shareholder

5,000

4,000

Non-current liability

5,036

4,000

TOTAL LIABILITIES

10,207

22,422

Commitments and contingencies

—

—

Shareholders’ equity:

Ordinary share, par value US$0.000005, 100,000,000,000 shares authorized,

15,000,000 shares issued*

**

**

Additional paid-up capital

695

695

Retained earnings

34

1172

Other reserve

46

46

Total shareholders’ equity

775

1,913

TOTAL LIABILITIES AND SHAREHOLDERS’ EQUITY

10,982

24,335

____________

*        Retrospectively restated for the effect of 1:200 forward stock split of our Ordinary Shares and the shares surrendered by our existing shareholders.
**      — Denotes amount less than US$1,000.


DELIXY HOLDINGS LIMITED AND SUBSIDIARIES

CONSOLIDATED STATEMENTS OF INCOME AND COMPREHENSIVE INCOME

(UNAUDITED)

(Amount in USD thousands, except for share and per share data, or otherwise noted)

For the six months period ended
June 30,

2024

2025

US$’000

US$’000

Revenues

143,761

102,000

Cost of revenue

(141,959)

(100,925)

Gross profit

1,802

1,075

General and administrative expenses

(1,635)

(692)

Profits from operations

167

383

Other income:

Gain on disposal of property

177

Foreign exchange gain

1

8

Interest income

135

35

Shipping charges reimbursed

10

201

Other income

5

1

Total other income

328

245

Income before income tax

495

628

Income tax expense

(45)

(68)

NET INCOME

450

560

TOTAL COMPREHENSIVE INCOME

450

560

Net income per share

Basic and diluted**

0.030

0.037

Weighted average number of ordinary shares outstanding Basic and diluted**

15,000,000

15,000,000

____________

*        — Denotes amount less than US$1,000.
**      Retrospectively restated for the effect of 1:200 forward stock split of our Ordinary Shares and the shares surrendered by our existing shareholders.


DELIXY HOLDINGS LIMITED AND SUBSIDIARIES

CONSOLIDATED STATEMENTS OF CASH FLOW

(UNAUDITED)

(Amount in USD thousands, except for share and per share data, or otherwise noted)

For the six months period ended
June 30,

2024

2025

US$’000

US$’000

Cash flows from operating activities:

Net income after tax

450

560

Depreciation of property and equipment

7

3

Amortization of right-of-use assets

20

25

Gain on disposal of property

(177)

Interest expense

89

(88)

Change in working capital:

Accounts receivable, net

(3,059)

(14,876)

Deposits, prepayments and other receivables

1

(468)

Other non-current assets

(1,152)

(1,340)

Accounts payable

2,521

15,706

Accrued liabilities

12

(36)

Lease liabilities

(22)

(23)

Income tax payable

(89)

(52)

Net cash provided by/(used in) operating activities

(1,399)

(589)

Cash flows from investing activities:

Derivative financial instruments

295

(519)

Proceeds from disposal of property

957

Amount due from shareholder

—

Net cash (used in)/provided by investing activities

1,252

(519)

Cash flows from financing activities:

Amount due to related party

—

Amount due to shareholder

11

(10)

Dividend paid

(2,500)

(2,667)

Net cash used in financing activities

(2,489)

(2,677)

Net change in cash and cash equivalents

(2,636)

(3,785)

BEGINNING OF FINANCIAL PERIOD

8,245

5,609

END OF FINANCIAL PERIOD

5,609

1,824

Supplemental Cash Flow Information:

Cash paid for income taxes

(134)

(90)

Cash paid for interest

(1)

(5)

Supplemental schedule of noncash financing activities

Loan from shareholder

5,000

4,000


Euro Tech Holdings Company Limited Reports Interim Results For The Six Months Ended June 30, 2025

HONG KONG, Dec. 30, 2025 /PRNewswire/ — Euro Tech Holdings Company Limited (Nasdaq: CLWT) today reported its unaudited financial results for the six months ended June 30, 2025.

The Company’s revenue for the six months ended June 30, 2025 (“1H 2025”) were US$5,888,000, a 18.9% decrease as compared to  US$7,259,000 for the six months ended June 30, 2024 (“1H 2024”). Revenue from trading activities decreased significantly, primarily due to lowered sales of U.S. products to China following U.S. tariffs and Chinese retaliatory measures.

Gross profit decreased by 5.2% to US$1,697,000 for 1H 2025 as compared to US$1,790,000 for 1H 2024. The decrease was due to the decrease in revenue. However the gross profit margin % for 1H 2025 increased by 4.2% to 28.8% as compared to 24.6% for 1H 2024.

General and administrative expenses decreased by US$102,000 to US$2,065,000 for 1H 2025 as compared to US$2,167,000 for 1H 2024.

The Company’s net loss for 1H 2025 was US$127,000 as compared to net income of US$44,000 for 1H 2024 resulting from decrease in revenue and equity in income of affiliate.

Mr. David Leung, CEO of the company commented,

 “Despite the challenging business environment, we have seen a remarkable increase in sales orders, achieving double-digit growth in the first half of the year. This growth is primarily driven by heightened engineering activities in water and wastewater treatment (“WWT”), although the delivery timelines will be extended until the end of this year or early next year.

Recently, we have also secured additional purchase orders from international markets, including Mongolia, Norway, and Dubai, for both WWT and ballast water treatment systems (“BWTS”). 

In the coming days, we intend to diversify our sales channels and explore new product applications in high-growth regions and industries to further leverage this momentum.”

About BWTS

BWTS are an imminent requirement by The International Maritime Organization (“IMO”) to prevent the biological unbalance caused by the estimated 12 billion tons of ballast water transported across the seas by ocean-going vessels when their ballast water tanks are emptied or refilled. In 2012, ballast water discharge standard became a law in the US. Any vessel constructed in December 2013 or later will need to comply when entering US waters, and existing vessels will follow shortly after. IMO’s Ballast Water Management Convention entered into force for new-built vessels on September 8, 2017 after ratification by 52 States, representing 35.1441% of world merchant shipping tonnage. In July 2017, IMO decided that the phase-in period for ballast water system retrofits started on 8 September 2019. 

The company obtained type approval certificate from China’s Classification Society for its 200, 300, 500, 750, 1200 and 1250 Cubic Meters per hour BWTS in 2016.

The IMO convention stipulates that type approval for revised G8 requirements must be obtained for all BWTS installed on or after October 28, 2020, and the company have been in compliance with such requirements.

The ballast water port solution system is a system installed in port to offer ballast water treatment services for ocean going ships without their own BWTS and for those with damaged BWTS.

Certain statements in this news release regarding the Company’s expectations, estimates, present view of circumstances or events, and statements containing words such as estimates, anticipates, intends, or expects, or words of similar import, constitute forward looking statements within the meaning of the Private Securities Litigation Reform Act of 1995. Such statements indicate uncertainty and the Company can give no assurance with regard to actual outcomes. Specific risk factors may include, without limitation, having the Company’s offices and operations situated in Hong Kong and China, doing business in China, competing with Chinese manufactured products, competing with the Company’s own suppliers, dependence on vendors, and lack of long term written agreements with suppliers and customers, development of new products, entering new markets, possible downturns in business conditions, increased competition, loss of significant customers, availability of qualified personnel, negotiating definitive agreements, new marketing efforts and the timely development of resources. See the “Risk Factor” discussions in the Company’s filings with the Securities and Exchange Commission, including its Annual Report on Form 20-F for its fiscal year ended December 31, 2024.

EURO TECH HOLDINGS COMPANY LIMITED

CONSOLIDATED BALANCE SHEETS

As of

June 30,

2025

(Unaudited)

As of

December 31,

2024

(Audited)

US$’000

US$’000

ASSETS

Current assets:

Cash and cash equivalents

4,493

5,805

Restricted cash

1,517

1,132

Accounts receivable, net

1,342

1,386

Prepayments and other current assets

437

271

Contract assets

80

135

Inventories

302

500

──────

──────

Total current assets

8,171

9,229

──────

──────

Property, plant and equipment, net

157

159

Investments in affiliates

9,774

9,947

Goodwill

1,071

1,071

Operating lease right-of-use assets, net

231

101

Deferred tax assets

80

62

Restricted cash

315

139

──────

──────

Total non-current assets

11,628

11,479

──────

──────

TOTAL ASSETS

19,799

20,708

══════

══════

LIABILITIES AND SHAREHOLDERS’ EQUITY

Current liabilities:

Accounts payable

1,547

2,279

Contract liabilities

761

593

Other payables and accrued expenses

895

1,050

Current portion of long-term operating lease liabilities

127

83

──────

──────

Total current liabilities

3,330

4,005

──────

──────

Long-term operating lease liabilities, net of current portion

95

9

──────

──────

Total non-current liabilities

95

9

──────

──────

TOTAL LIABILITIES

3,425

4,014

──────

──────

Commitments and contingencies

–

–

SHAREHOLDERS’ EQUITY:

Ordinary share,

20,000,000 shares authorized and no par value; 7,899,832 and 7,899,832
shares issued as of June 30, 2025 and  December 31, 2024, respectively

123

123

Additional paid-in capital

9,774

9,774

Treasury stock, 330,306 and 183,533 shares at cost as of June 30, 2025 and
  December 31, 2024, respectively

(981)

(807)

PRC statutory reserves

345

345

Accumulated other comprehensive income

734

713

Retained earnings

5,468

5,595

──────

──────

Total shareholders’ equity attributable to Euro Tech Holdings Company
  Limited

15,463

15,743

Noncontrolling interests

911

951

──────

──────

Shareholders’ equity

16,374

16,694

──────

──────

TOTAL LIABILITIES AND SHAREHOLDERS’ EQUITY

19,799

20,708

══════

══════

EURO TECH HOLDINGS COMPANY LIMITED

CONSOLIDATED STATEMENTS OF OPERATIONS AND COMPREHENSIVE INCOME
FOR THE SIX MONTHS ENDED JUNE 30, 2025 AND 2024

2025

(Unaudited)

2024

(Unaudited)

US$’000

US$’000

Revenue, net:

Trading and manufacturing

3,424

5,138

Engineering

2,464

2,121

────────

────────

5,888

7,259

Cost of revenue:

Trading and manufacturing

(2,566)

(3,997)

Engineering

(1,625)

(1,472)

────────

────────

(4,191)

(5,469)

────────

────────

Gross profit

1,697

1,790

Operating expenses:

 Finance costs

–

(1)

 General and administrative expenses

(2,065)

(2,167)

────────

────────

LOSS FROM OPERATION

(368)

(378)

Interest income

43

45

Other income, net

10

10

Equity in income of affiliates

148

232

────────

────────

LOSS BEFORE INCOME TAXES

(167)

(91)

Income tax credit / (expense)

3

(10)

────────

────────

NET LOSS

(164)

(101)

Net loss attributable to noncontrolling interests

37

145

────────

────────

Net  (loss) / income attributable to Euro Tech
  Holdings Company Limited

(127)

44

════════

════════

Other comprehensive (loss)

    Net (loss)

(164)

(101)

    Foreign currency adjustments

21

(9)

────────

────────

COMPREHENSIVE LOSS

(143)

(110)

Comprehensive (income) / loss attributable to
  noncontrolling interests

(3)

151

────────

────────

Comprehensive (loss) / income attributable
  to Euro Tech Holdings Company Limited

(146)

41

════════

════════

Net (loss) / income per ordinary share
  attributable to Euro Tech Holdings
  Company Limited

– Basic

$  US(0.02)

$  US0.01

════════

════════

– Diluted

$  US(0.02)

$  US0.01

════════

════════

Weighted average number of ordinary
  shares outstanding

– Basic

7,660,243

7,717,695

════════

════════

– Diluted

7,660,243

7,717,695

════════

════════