Home Blog Page 2544

SEMI Reports Global Semiconductor Equipment Billings Increased 24% Year-Over-Year in Q2 2025

Strong Growth in the First Half of the Year Driven by Advanced Logic and DRAM Applications

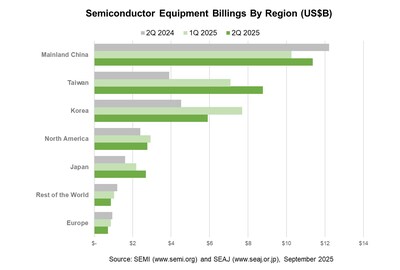
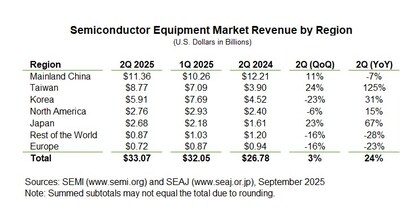
MILPITAS, Calif., Sept. 5, 2025 /PRNewswire/ — SEMI, the industry association serving the global semiconductor and electronics design and manufacturing supply chain, today announced in its Worldwide Semiconductor Equipment Market Statistics (WWSEMS) Report that global semiconductor equipment billings increased 24% year-over-year to US$33.07 billion in the second quarter of 2025. Second quarter 2025 billings registered a 3% quarter-over-quarter expansion supported by the leading-edge logic, advanced high bandwidth memory (HBM) related DRAM applications, as well as increase in shipments to Asia.

Semiconductor Equipment Billings by Region

“The global semiconductor equipment market registered a strong first half of 2025 with more than $65 billion in revenue, building on the record billings of $117 billion in 2024,” said Ajit Manocha, SEMI President and CEO. “Chipmakers continue to invest in production capacity to support advanced logic and memory innovation powering the AI wave, as well as key projects to bolster regional supply chain resilience.”

Compiled from data submitted by members of SEMI and the Semiconductor Equipment Association of Japan (SEAJ), the WWSEMS Report is a summary of the monthly billings figures for the global semiconductor equipment industry. 

Following are quarterly billings data in billions of U.S. dollars, with quarter-over-quarter and year-over-year changes by region:

The SEMI Equipment Market Data Subscription (EMDS) provides comprehensive market data for the global semiconductor equipment market. The subscription includes three reports:

  • Monthly SEMI Billings Report, a perspective on equipment market trends
  • Monthly WWSEMS, a detailed report of semiconductor equipment billings for seven regions and 24 market segments
  • SEMI Semiconductor Equipment Forecast, an outlook for the semiconductor equipment market

Download a sample of the EMDS report.

For more information about the report or to subscribe, please contact the SEMI Market Intelligence Team at mktstats@semi.org. More details are also available on the SEMI Market Data webpage.  

About SEMI

SEMI® is the global industry association connecting over 3,000 member companies and 1.5 million professionals worldwide across the semiconductor and electronics design and manufacturing supply chain. We accelerate member collaboration on solutions to top industry challenges through Advocacy, Workforce Development, Sustainability, Supply Chain Management and other programs. Our SEMICON® expositions and events, technology communities, standards and market intelligence help advance our members’ business growth and innovations in design, devices, equipment, materials, services and software, enabling smarter, faster, more secure electronics. Visit www.semi.org, contact a regional office, and connect with SEMI on LinkedIn and X to learn more.

Association Contacts
Sherrie Gutierrez/SEMI
Phone: 1.831.889.3800
Email: sgutierrez@semi.org 

Stephanie Quinn/Kiterocket (Media Inquiries)
Phone: 1.480.316.8370
Email: squinn@kiterocket.com  

Semiconductor Equipment Market Revenue by Region


Cango Inc. Reports Second Quarter 2025 Unaudited Financial Results

HONG KONG, Sept. 5, 2025 /PRNewswire/ — Cango Inc. (NYSE: CANG) today announced its unaudited financial results for the second quarter ended June 30, 2025.

Financial and Operational Highlights

  • As of June 30, 2025, the company’s total mining capacity reached 50 EH/s, primarily driven by the acquisition of 18 EH/s in June 2025. Furthermore, in May, Cango completed the divestiture of its China-based assets for US$352 million, generating substantial liquidity to support ongoing strategic initiatives.
  • Total revenues were US$139.8 million during the period, with the Bitcoin mining business generating revenue of US$138.1 million.
  • Adjusted EBITDA was US$99.1 million during the period.
  • A total of 1,404.4 Bitcoins were mined during the quarter. Average cost to mine, excluding depreciation of mining machines, was US$83,091 per Bitcoin, with all-in costs of US$98,636 per Bitcoin. As of the end of June 2025, the Company had mined 3,879.2 Bitcoins since entering the Bitcoin mining industry.
  • The net loss for the period was mainly attributable to the one-off loss on discontinued operations and the non-cash impairment loss from mining equipment contracted last November and settled via equity in June of this year—triggered by the significant appreciation in Cango’s share price between signing and delivery. These charges related to the Company’s strategic steps rather than operational underperformance. Excluding the impairment and the one-off loss from discontinued operations, adjusted EBITDA stood at US$99.1 million during the period, demonstrating the strength and profitability of the core Bitcoin mining business.

Mr. Paul Yu, CEO of Cango, said, “This quarter marks a significant milestone as we report our first full quarter following our strategic transformation. In just nine months, we’ve established ourselves as one of the largest Bitcoin miners globally, supported by our asset-light strategy that enables quick scaling with minimal upfront capital. While this approach incurs higher cash costs per Bitcoin, our lower depreciation expenses ensure competitive all-in costs and strong capital efficiency. Our recent acquisition of 18 EH/s increased our total mining capacity to 50 EH/s, contributing to a 44% increase in Bitcoin production in July. This growth underscores the impact of our expanded operations and supports further scaling through organic initiatives and strategic acquisitions. Additionally, our acquisition of 50 MW mining facility in Georgia enhances our energy security and lowers power costs, providing operational expertise for future HPC and energy initiatives.”

Full article link: https://www.prnewswire.com/news-releases/cango-inc-reports-second-quarter-2025-unaudited-financial-results-302546670.html 

Investor Relations Contact
Email: ir@cangoonline.com 

Chanson International Holding Announces First Half of Fiscal Year 2025 Financial Results

URUMQI, China, Sept. 5, 2025 /PRNewswire/ — Chanson International Holding (Nasdaq: CHSN) (the “Company” or “Chanson”), a provider of bakery, seasonal, and beverage products through its chain stores in China and the United States, today announced its unaudited financial results for the six months ended June 30, 2025.

Mr. Gang Li, Chairman of the Board of Directors and Chief Executive Officer of the Company, commented, “In the first half of fiscal year 2025, despite facing various challenges, we have shown resilience and adaptability in a dynamic market. With the revenue growth we achieved, we have successfully maintained our gross margins at above 40%, by enforcing cost control measures and enhancing operating efficiency. Additionally, with an increased cash reserve as of June 30, 2025, we are in a solid position to manage market uncertainties. As we move forward, we remain confident in our long-term growth strategy and execution capabilities. Our expansion initiatives in both the United States and China are expected to remain a key focus of our growth. We aim to further drive revenue by attracting new customers and encouraging repeat business from existing ones. We aim to achieve these results by strengthening opportunistic purchasing, optimizing inventory management, maintaining strong store conditions, and effectively marketing both current and new product offerings. We believe that those efforts will help us navigate short-term headwinds and support long-term growth in the near future.”

First Half of Fiscal Year 2025 Financial Summary

  • Total revenue was $8.7 million, compared to $7.5 million for the same period of last year.  
     
  • Gross profit was $3.9 million, compared to $3.1 million for the same period of last year.
  • Gross margin was 44.5%, compared to 41.5% for the same period of last year.    
  • Net loss was $1.0 million, compared to net income of $0.02 million for the same period of last year.    
  • Basic and diluted loss per share were $2.87, compared to basic and diluted earnings per share $0.15 for the same period of last year.

First Half of Fiscal Year 2025 Financial Results

Revenue

Total revenue was $8.7 million for the six months ended June 30, 2025, which increased by 15.2%, from $7.5 million for the same period of last year. The increase in revenue was due to increased revenue from the stores in China (the “China Stores”), which was partially offset by decreased revenue from the stores in the United States (the “United States Stores”).

China Stores

Revenue from the China Stores was $7.8 million for the six months ended June 30, 2025, which increased by $1.3 million or 19.7%, from $6.5 million for the same period of last year. The increase was mainly due to the increased revenue from bakery products as well as from other products.

  • Revenue from bakery products was $7.2 million for the six months ended June 30, 2025, which increased by 20.8%, from $5.9 million for the same period of last year. The increase was mainly attributed to the increased revenue generated by the newly opened bakery stores, as nineteen bakery stores have been opened since the second half of fiscal year 2024.
  • Revenue from other products was $0.63 million for the six months ended June 30, 2025, which increased by 8.5%, from $0.58 million for the same period of last year. The increase was mainly due to increased revenue from seasonal products, which was partially offset by decreased revenue from beverage products. Revenue from seasonal products was $0.51 million for the six months ended June 30, 2025, which increased by 39.0% from $0.36 million for the same period of last year. The increase was due to increased revenue from group purchases from corporate customers of the China Stores, as we offered more sales promotions and price discounts to attract more customers and received more group purchases orders. Revenue from beverage products was $0.12 million for the six months ended June 30, 2025, a decrease by 42.9% from $0.22 million for the same period of last year. The opening of new stores by several well-known coffee chain brands in Xinjiang, offering products at very low prices to gain market share, provided customers with more choices and contributed to a decline in beverage product revenue at our China Stores. As of June 30 2025, two coffee bakery stores were closed, one in fiscal year 2024 and another in the six months ended June 30, 2025.

United States Stores

Revenue from the U.S. Stores was $0.9 million for the six months ended June 30, 2025, which decreased by 13.2% from $1.0 million for the same period of last year. The decrease was mainly due to decreased revenue from bakery products and eat-in services, which was partially offset by the slightly increased revenue from beverage products.

  • Revenue from bakery products was $0.22 million for the six months ended June 30, 2025, which decreased by 10.1% from $0.24 million for the same period of last year. The decrease was due to the decreased revenue from Chanson 23rd Street LLC (“Chanson 23rd Street”) and Chanson 1293 3rd Ave LLC (“Chanson 3rd Ave”). Facing increased competition from competitors operating in the same area, Chanson 23rd Street suspended its business operation of bakery products and eat-in services in April 2025 and Chanson 3rd Ave suspended all business operation in January 2025. However, the decrease in revenue from bakery products was partially offset by the increased revenue from Chanson Broadway as we implemented a series of performance-enhancing measures, including extending business hours, optimizing the products mix and offering more sales promotions and price discounts to attract more customers.
  • Revenue from beverage products remained relatively stable at $0.64 million for the six months ended June 30, 2025, with a slight increase by 1.9% from $0.63 million for the same period of last year. The increase was due to the increased revenue of beverage products generated by Chanson Broadway, resulting from implementation of the performance-enhancing measures as mentioned above. The increase was partially offset by the decreased revenue from Chanson 23rd Street, primarily attributable to increased competition from competitors operating in the same area, as well as the decreased revenue from Chanson 3rd Ave resulting from the suspension of business operation as mentioned above.
  • Revenue from eat-in services was $0.05 million for the six months ended June 30, 2025, which decreased by 72.9% from $0.17 million for the same period of last year. As mentioned above, Chanson 23rd Street suspended its business operation of bakery products and eat-in services in April 2025 and Chanson 3rd Ave suspended all business operation in January 2025, hence, revenue from eat-in services decreased for the six months ended June 30, 2025.

Gross Profit and Gross Margin

Gross profit was $3.9 million for the six months ended June 30, 2025, which increased by 23.6% from $3.1 million for the same period of last year. Gross margin was 44.5% for the six months ended June 30, 2025, which increased by 3.0 percentage points from 41.5% for the same period of last year.

Operating Expenses

Operating expenses were $5.1 million for the six months ended June 30, 2025, compared to $3.7 million for the same period of last year.

  • Selling expenses were $2.8 million for the six months ended June 30, 2025, which increased by 26.3%, from $2.2 million for the same period of last year, mainly due to an increase in selling expenses of $0.6 million from the China Stores. The increase in the China Stores was primarily attributable to (i) an increase in salaries and welfare benefit expenses of $0.21 million, as the China Stores hired additional sales staff for the new stores; (ii) an increase in online platform service fees of $0.14 million, resulting from the increased online sales on the third-party platform during the six months ended June 30, 2025; and (iii) an increase in rental expenses, renovation expenses and electricity expenses of $0.08 million, as twenty-three stores have been opened since the second half of fiscal year 2024.    
  • General and administrative expenses were $2.2 million for the six months ended June 30, 2025, which increased by 53.7 % from $1.5 million for the same period of last year. The increase was primarily due to an    increase in allowance for credit losses of $0.5 million. On April 3, 2023, we entered a loan agreement with Liberty Asset Management Capital Limited (the “Borrower”) to lend the Borrower $2.0 million for two years, with a maturity date of April 3, 2025. Due to the Borrower’s financial distress, we collected $1.5 million upon maturity of the loan, and the remaining balance of 0.5 million was charged off and recognized as the bad debt written-off. The increase in general and administrative expenses was also attributable to the increased audit, legal and professional service fees due to issuance of additional equity security during the six months ended June 30, 2025.

Net Income (Loss)

Net loss was $1.0 million for the six months ended June 30, 2025, compared to net income of $0.02 million for the same period of last year.

Basic and Diluted Earnings (Loss) per Share

Basic and diluted loss per share were $2.87 for the six months ended June 30, 2025, compared to basic and diluted earnings per share of $0.15 for the same period of last year.

Balance Sheet

As of June 30, 2025, the Company had cash of $22.1 million, compared to $12.1 million as of December 31, 2024.

Cash Flow

Net cash used in operating activities was $0.4 million for the six months ended June 30, 2025, compared to net cash provided by $0.8 million for the same period of last year.

Net cash provided by investing activities was $1.5 million for the six months ended June 30, 2025, compared to $1.4 million for the same period of last year.

Net cash provided by financing activities was $8.6 million for the six months ended June 30, 2025, compared to $0.4 million for the same period of last year.

About Chanson International Holding

Founded in 2009, Chanson International Holding is a provider of bakery, seasonal, and beverage products through its chain stores in China and the United States. Headquartered in Urumqi, China, Chanson directly operates stores in Xinjiang, China and New York, United States. Chanson currently manages 60 stores in China, and three stores in New York City while selling on digital platforms and third-party online food ordering platforms. Chanson offers not only packaged bakery products but also made-in-store pastries and eat-in services, serving freshly prepared bakery products and extensive beverage products. Chanson aims to make healthy, nutritious, and ready-to-eat food through advanced facilities based on in-depth industry research, while creating a comfortable and distinguishable store environment for customers. Chanson’s dedicated and highly-experienced product development teams constantly create new products that reflect market trends to meet customer demand. For more information, please visit the Company’s website: http://ir.chanson-international.net/.

Forward-Looking Statements

Certain statements in this announcement are forward-looking statements. These forward-looking statements involve known and unknown risks and uncertainties and are based on the Company’s current expectations and projections about future events that the Company believes may affect its financial condition, results of operations, business strategy and financial needs. Investors can find many (but not all) of these statements by the use of words such as “approximates,” “believes,” “hopes,” “expects,” “anticipates,” “estimates,” “projects,” “intends,” “plans,” “will,” “would,” “should,” “could,” “may” or other similar expressions. The Company undertakes no obligation to update or revise publicly any forward-looking statements to reflect subsequent occurring events or circumstances, or changes in its expectations, except as may be required by law. Although the Company believes that the expectations expressed in these forward-looking statements are reasonable, it cannot assure you that such expectations will turn out to be correct, and the Company cautions investors that actual results may differ materially from the anticipated results and encourages investors to review other factors that may affect its future results in the Company’s registration statement and other filings with the U.S. Securities and Exchange Commission.

For investor and media inquiries, please contact:

Chanson International Holding
Investor Relations Department
Email: IR@chansoninternational.com

Ascent Investor Relations LLC
Tina Xiao
Phone: +1-646-932-7242
Email: investors@ascent-ir.com


CHANSON INTERNATIONAL HOLDING AND SUBSIDIARIES

 UNAUDITED CONDENSED CONSOLIDATED BALANCE SHEETS

 June 30,

 December 31,

2025

2024

(Unaudited)

(Audited)

 ASSETS

 CURRENT ASSETS:

 Cash and cash equivalents

$

22,092,155

$

12,102,763

 Accounts receivable

2,412,842

991,467

 Inventories

712,040

738,773

 Long term loan to a third-party, current

2,000,000

 Prepaid expenses and other current assets

2,255,097

2,595,417

27,472,134

18,428,420

 NON-CURRENT ASSETS:

 Operating lease right-of-use assets

11,207,618

11,021,615

 Property and equipment, net

5,322,405

4,444,473

 Intangible assets, net

244,375

262,500

 Long term security deposits

681,011

944,170

 Long term debt investment

6,359,014

6,359,014

 Long term prepaid expenses

275,949

315,642

24,090,372

23,347,414

 TOTAL ASSETS

$

51,562,506

$

41,775,834

 LIABILITIES

 CURRENT LIABILITIES:

 Short-term bank loans

$

418,576

$

1,507,159

 Current portion of long-term bank loans

306,956

 Accounts payable

2,443,259

2,127,740

 Due to a related party

2,811

772,489

 Taxes payable

174,290

48,712

 Deferred revenue

7,228,151

6,697,964

 Operating lease liabilities, current

2,221,418

2,325,390

 Other current liabilities

929,801

662,963

13,725,262

14,142,417

 NON-CURRENT LIABILITIES

 Operating lease liabilities, non-current

9,135,236

9,207,971

 Long-term bank loans

4,157,853

13,293,089

9,207,971

 TOTAL LIABILITIES

27,018,351

23,350,388

 COMMITMENTS AND CONTINGENCIES (Note 15)

 SHAREHOLDERS’ EQUITY

 Ordinary shares, $0.08 par value, 62,500,000 shares
authorized; 643,411 shares and 341,247 shares issued
and outstanding as of June 30, 2025 and December
31, 2024, respectively:*

 Class A ordinary share, $0.08 par value, 55,000,000
shares authorized; 572,536 shares and 270,372 shares
issued and outstanding as of June 30, 2025 and
December 31, 2024, respectively

45,802

21,629

 Class B ordinary share, $0.08 par value, 7,500,000
shares authorized; 70,875 shares issued and
outstanding as of June 30, 2025 and December 31,
2024, respectively

5,670

5,670

 Additional paid-in capital

24,610,553

17,724,592

 Statutory reserve

661,924

661,924

 (Accumulated deficit) retained earnings

(657,455)

391,338

 Accumulated other comprehensive loss

(122,339)

(379,707)

 TOTAL SHAREHOLDERS’ EQUITY

24,544,155

18,425,446

 TOTAL LIABILITIES AND SHAREHOLDERS’ EQUITY

$

51,562,506

$

41,775,834

 * Retrospectively restated for effect of the reverse split on August 18, 2025


CHANSON INTERNATIONAL HOLDING AND SUBSIDIARIES

 UNAUDITED CONDENSED CONSOLIDATED STATEMENTS OF OPERATIONS
AND COMPREHENSIVE (LOSS) INCOME

  For the Six Months Ended June 30, 

2025

2024

 REVENUE

$

8,688,208

$

7,542,682

 COST OF REVENUE

4,822,856

4,415,407

 GROSS PROFIT

3,865,352

3,127,275

 OPERATING EXPENSES

 Selling expenses

2,817,128

2,230,905

 General and administrative expenses

2,238,769

1,456,499

 Total operating expenses

5,055,897

3,687,404

 LOSS FROM OPERATIONS

(1,190,545)

(560,129)

 OTHER INCOME (EXPENSE)

 Interest expense, net

(78,343)

(25,278)

 Other (expense) income, net

(76,487)

314,670

 Interest income from long term debt investment

359,014

359,014

        Total other income, net

204,184

648,406

 (LOSS) PROFIT BEFORE INCOME TAX EXPENSE

(986,361)

88,277

 INCOME TAX EXPENSE

(62,432)

(64,865)

 NET (LOSS) INCOME 

(1,048,793)

23,412

 Foreign currency translation gain

257,368

16,207

 TOTAL COMPREHENSIVE (LOSS) INCOME

$

(791,425)

$

39,619

 (Loss) earnings per ordinary share – basic and diluted

$

(2.87)

$

0.15

 Weighted average shares – basic and diluted *

365,523

155,316

 * Retrospectively restated for effect of the reverse split on August 18, 2025


CHANSON INTERNATIONAL HOLDING AND SUBSIDIARIES

 UNAUDITED CONDENSED CONSOLIDATED STATEMENTS OF CASH FLOWS 

  For the Six Months Ended June 30, 

2025

2024

 Cash flows from operating activities:

 Net (loss) income 

$

(1,048,793)

$

23,412

 Adjustments to reconcile net (loss) income to net cash
(used in) provided by operating activities:

 Amortization of operating lease right-of-use assets

1,277,452

1,697,141

 Depreciation and amortization

392,976

445,787

 Write off of bad debts

500,000

 Loss on disposal of property and equipment

77,505

 Accrued interest income from long term debt investment

(359,014)

(359,014)

 Interest income from loan to a third-party

(44,877)

 Changes in operating assets and liabilities:

 Accounts receivable

(1,387,301)

(40,507)

 Inventories

37,621

(65,027)

 Prepaid expenses and other current assets

372,248

286,121

 Long term security deposits

269,171

49,350

 Long term prepaid expenses

44,851

32,953

 Accounts payable

277,671

213,875

 Taxes payable

124,895

(19,020)

 Deferred revenue

403,151

299,816

 Other current liabilities

255,300

(79,738)

 Operating lease liabilities

(1,628,032)

(1,634,128)

 Net cash (used in) provided by operating activities

(390,299)

806,144

 Cash flows from investing activities:

 Purchase of property and equipment

(310,368)

(34,268)

 Proceeds from disposal of property and equipment

34,562

 Interest income received from long term debt investment

359,014

534,575

 Repayment from loans to third parties

1,500,000

862,088

 Net cash provided by investing activities

1,548,646

1,396,957

 Cash flows from financing activities:

 Proceeds from sales of the Equity Security Units, net of
issuance costs

6,910,134

 Proceeds from short-term bank loans

413,658

422,095

 Repayments of short-term bank loans

(1,516,747)

 Proceeds from long-term bank loans

4,412,355

 Payments made to a related party

(1,640,710)

(56,298)

 Net cash provided by financing activities

8,578,690

365,797

 Effect of exchange rate fluctuation on cash and cash
equivalents

252,355

57,630

 Net increase in cash and cash equivalents

9,989,392

2,626,528

 Cash and cash equivalents, beginning of period

12,102,763

1,481,302

 Cash and cash equivalents, end of period

$

22,092,155

$

4,107,830

 Supplemental cash flow information

 Cash paid for income taxes

$

14,995

$

40,889

 Cash paid for interest

$

74,745

$

68,450

 Non-cash operating, investing and financing activities

 Property and equipment acquired in settlement of the
amount due from a related party

$

954,293

$

 Reduction of right-of-use assets and operating lease
obligations due to early termination of lease agreement

$

270,532

$

60,277

 Right of use assets obtained in exchange for operating
lease liabilities

$

1,560,535

$

1,697,141


Agora and OpenAI’s Realtime API Power Seamless Interaction with Multimodal AI Agents

Agora’s Conversational AI Engine offers key enhancements to the Realtime API for more natural communication and interaction.

SANTA CLARA, Calif., Sept. 5, 2025 /PRNewswire/ — Agora (NASDAQ: API), the leading platform for real-time engagement and conversational AI, today announced expanded support for OpenAI’s Realtime API, now generally available. Agora’s integration with the new Realtime API now supports automated greetings, mixed-modality interaction, selective attention locking and more advanced functionality designed to power more natural interaction between users and AI agents.

This milestone builds on Agora’s partnership with OpenAI, as the Realtime API is the first multimodal large language model (MLLM) built into the Agora platform. The combined solution empowers developers to create more natural, responsive, and human-like AI agents by reducing development complexity while unlocking advanced capabilities in real-time interaction.

“Real-time multimodal interaction is the missing piece for AI agents to feel truly human,” said Tony Zhao, CEO of Agora. “By integrating OpenAI’s Realtime API into our Conversational AI Engine, we’re giving developers the tools to build experiences that are faster, smarter, and more natural than ever before.”

Agora’s Conversational AI Engine now offers more advanced features to enable natural interaction with AI agents:

  • Automated Greetings: Ensures instant session awareness and a natural, welcoming onboarding experience.
  • Mixed-Modality Interaction: Enables seamless switching between voice and text inputs within a single interactive session.
  • Flexible Turn-Detection Options: Gives developers fine-grained control over conversational flow and turn-taking behavior.
  • Uninterrupted Input: Agora’s proprietary Selective Attention Locking technology filters out ambient noise and interfering voices for uninterrupted engagement.

Through Agora’s Conversational AI Engine, developers gain access to a powerful set of tools that not only streamline adoption of the Realtime API but also unlock new features and use cases for multimodal AI agents. By combining OpenAI’s real-time language model with Agora’s global real-time network infrastructure (SDRTN®) and purpose-built developer toolkit, teams can accelerate time to market, simplify application development, and deliver superior real-time conversational AI experiences.

Robotics startup Carbon Origins is already leveraging Agora’s technology integrated with OpenAI’s Realtime API to enable hands free operation of heavy equipment and enhance operator efficiency.

“The combination of OpenAI’s Realtime API and Agora’s conversational AI technology enable hands-free control of our autonomous robot fleet,” said Amogha Krishna Srirangarajan, CEO and Founder of Carbon Origins. “The technology powers the automation of complex checklists and system operations in our Constellation AI solution, allowing operators to focus on strategic tasks and orchestration instead of manual execution.”

The integration further strengthens Agora’s position as the leading platform for conversational AI, real-time engagement, and multimodal agent development, with applications spanning customer support, education, gaming, fan engagement, and beyond.

Learn more about Agora’s Conversational AI Engine here: https://www.agora.io/en/products/conversational-ai-engine/

About Agora
Agora is the global leader in real-time engagement, providing developers with simple, flexible, and powerful APIs to embed real-time conversational AI, voice, video, interactive live streaming, and chat into their applications and IoT devices. Headquartered in Santa Clara, CA, Agora is trusted by over 1,700 leading organizations across the globe to power best-in-class real-time experiences from social media and live shopping to education and telehealth. For more information about Agora (NASDAQ: API), visit: www.agora.io.

ASTM Expands Access to Compass Platform

Change in reseller relationship invites direct access through ASTM Compass®

W. CONSHOHOCKEN, Pa., Sept. 5, 2025 /PRNewswire/ — To meet increasing customer demand for sophisticated digital formats and workflows, ASTM International is broadening its direct sales efforts and will not be renewing its long-standing and healthy reseller relationship with Accuris (formerly IHS).

“We have been listening to the voice of our customers and users and are excited about collaborating more directly to innovate the delivery of the information and data they need today and, in the future,” notes Andy Kireta, ASTM president. “Accuris has been an excellent partner for ASTM over the years, and we wish them well in the future as their business evolves.”

ASTM has recently completed a multi-year overhaul of its existing IT infrastructure, enabling significant improvements to its flagship product ASTM Compass®. With the newly improved platform, ASTM is in a unique position to provide standards users with expanded solutions, enabling them to do more with their standards.

As part of the enhancements, ASTM is well-positioned to partner with standards users to develop and implement the tools and connections to allow them to easily incorporate standards and technical content into their everyday workflows.

Benefits available to ASTM Compass subscribers include:

  • Both HTML and PDF standards format options, so users have the most flexible use of the content.
  • Additional content from AASHTO, AATCC, API, AWS, AWWA, CGA, IES, MOD, UOP, and others.
  • Color-coded highlighting (ASTM Redlines) to instantly identify changes to standards, saving time, money, and resources.
  • A new and powerful collaboration tool that enables selected content to be shared with other users, enhancing downstream and cross-divisional communication at a technical level. With Compass Points, users can add requirements, use case scenarios, or other organizational protocols directly into their standards. These unique, permanent, shareable URLs act as a custom bookmark, keeping you forever connected to important data in standards when they change. Compass Points work for every version of standards, from all publishers on ASTM Compass.
  • Favorites feature to pin frequently accessed standards to their Compass dashboard.
  • Tracking feature that alerts when new versions are published.
  • Over 300 ASTM videos built by subject matter experts, designed for quickly onboarding new staff, guiding proper execution of test methods, and training existing teams.
  • Select translated standards also available.

“As the content owner, ASTM is in a unique position to serve customers by providing customized solutions with enhanced efficiencies,” adds Kireta. “From accessing HTML versions of standards, and assisting with responsible use of AI, to new tools that work in concert with varying digital platforms and workflows, ASTM provides customers a reliable, credible, responsive source for their data needs during this rapidly changing digital age. Now, more customers will be able to work directly with ASTM and be proud that their investment in Compass supports the development of future standards.”

For those interested in learning more, ASTM’s team of sales representatives and education managers are highly skilled at tailoring services and support to the specific needs of ASTM customers. For answers to questions about ASTM Compass, please visit astm.org/compass or contact Sales (sales@astm.org; +1.877.909.2786).

About ASTM International

Advancing standards and transforming markets, we touch every part of everyday life – helping our world work better.

Over 12,000 ASTM standards operate globally. Defined and set by us, they improve the lives of millions every day. Combined with our innovative business services, they enhance performance and help everyone have confidence in the things they buy and use.

Media Inquiries: Dan Bergels, tel +1.610.832.9602; dbergels@astm.org

EverHive Expands Into APAC, Establishing Singapore Hub to Support Regional Growth

CHARLOTTE, N.C., Sept. 5, 2025 /PRNewswire/ — EverHive, a global leader in contingent workforce Managed Service Provider (MSP) solutions, announced its expansion into the Asia-Pacific (APAC) region, going live across multiple countries with Singapore as its regional hub. This move reflects client growth and EverHive’s commitment to delivering scalable, high-performance MSP programs worldwide.

The APAC contingent workforce is one of the largest and most dynamic in the world, valued at USD 1.8 trillion in 2024, according to Staffing Industry Analysts. Within this market, Statement of Work (SOW) contracts dominate at USD 1.29 trillion, accounting for more than 70% of the total, while temporary agency work alone is valued at USD 119.2 billion. Independent contractors, directly sourced temporary workers, and platform-related work make up the balance, underscoring both the scale and diversity of workforce models in the region.

“Our APAC launch marks a pivotal milestone in EverHive’s journey to expand its global footprint,” said Brandon Moreno, CEO of EverHive. “Establishing Singapore as our regional hub strengthens our ability to serve clients seamlessly across continents. This expansion builds on our strong foundation in North America and EMEA, empowering us to scale service excellence, deepen trusted partnerships, and deliver next-generation workforce strategies worldwide.”

As one of the few truly independent global MSP providers, EverHive is uniquely positioned to help clients navigate complex regulatory environments, streamline contingent workforce operations, and accelerate business agility across borders—all while remaining supplier-neutral and partnership-driven. EverHive’s 99.4% supplier adoption rate underscores its ability to execute at scale while fostering collaboration across the ecosystem.

This expansion strengthens EverHive’s global footprint, with programs now spanning more than 40 countries across North America, EMEA, and APAC. From biotechnology and financial services to technology and gaming, EverHive continues to deliver measurable results for industries that demand agility and innovation.

About EverHive
EverHive is a global contingent workforce strategic advisory firm, dedicated to redefining how enterprises manage their extended workforce. EverHive provides advisory services, including end-to-end MSP solutions, VMS implementation, program design, and delivery, all aimed at enhancing efficiency, compliance, and strategic value. Partnering with Fortune 500 and high-growth companies alike, EverHive drives agility, transparency, and workforce excellence at scale. By combining deep industry expertise with a client-first approach, EverHive empowers organizations to optimize their external workforce strategies while navigating complex global labor landscapes. For more information, visit www.everhive.com

Media Contact:

Brianne Garner
Email: brianne.garner@everhive.com

ISX Financial EU plc secures novel technology patent for identity verification using uninterrupted video KYC

NICOSIA, Cyprus, Sept. 5, 2025 /PRNewswire/ — ISX Financial EU plc is pleased to announce that its wholly owned subsidiary, ISX IP Ltd, has been advised of European Patent Office’s decision to grant to ISX IP Ltd a further European Patent 3850508 – Remotely Verifying An Identity of a Person. The European patent was granted on the 6th of August 2025 with a term of 20 years from the date of application, being the 12th of September 2019.

Application & Benefits

The patent provides a novel and inventive alternative to current market place solutions for video Know Your Customer (KYC). Using a computer-implemented method for remotely verifying an identity of a user, the patent establishes data connection and live video streaming to receive, compare and verify different sets of biometric data derived from identifying data captured from various means.

Data processing devices may use technology to identify biometric data such as facial, speech, iris, retina, gait, heartbeat, heart rate or fingerprint features, and identify and match those biometric features against stored data, photographic images and/or video sources.

The broad nature of the patent allows for various parameters to be reconfigured. Notably, it may provide for the use of drones (autonomous or piloted) to identify and verify individuals for applications beyond financial services.

This breakthrough technology creates a continuous, secure, and fraud-resistant method of remote identity verification, addressing one of the most pressing challenges in today’s digital-first world. Maintaining a robust identity verification [solution/software] through a remote verification of an end-user’s/customer’s identity, helps businesses reduce identity verification fraud, ensure rigor compliance with strict regulatory requirements for customer due diligence, and deliver seamless, remote-safe user experiences without having to make physical journeys to visit offices of persons qualified to certify copies of identifying documents, or go through additional verification of identity checks.

“This invention represents the future of identity verification – frictionless for the user, yet highly secure,” added Nikogiannis Karantzis, Managing Director and CEO of ISX Financial EU plc. “We look forward to developing this technology further inhouse and also collaborating with partners to deploy this across industries where trust and security are paramount.”

“This patent also complements our investment in BeEmotion.ai, with the patented technologies of both firms being able to be combined to potentially service further sectors beyond those targeted today.”

What’s next

ISX Financial EU Plc is actively exploring opportunities and partnerships to bring uninterrupted video identity verification technology to market at scale.

Patent can be be viewed by clicking on the link below.

https://register.epo.org/application?number=EP19860170

About

ISX Financial EU plc is a leading banktech company that leverages its own technology to offer bespoke financial services to businesses across the European Economic Area and the United Kingdom. The Company’s unified payments stack and infrastructure provide businesses with complete end-to-end transactional banking, A2A payments, FX, remittance, and payment processing capabilities.

Website: www.isx.financial


SKYWORTH to Showcase Clarus Outdoor™ TV Line at CEDIA Expo 2025

Custom Integrators Choose SKYWORTH for Superior Brightness, Proven Durability
and Competitive Value in Outdoor Entertainment

DENVER, Sept. 5, 2025 /PRNewswire/ — At CEDIA Expo 2025 in Booth #1033, SKYWORTH, one of the world’s top five TV brands, will showcase its complete Clarus Outdoor™ TV line, featuring brightness levels up to 3,000 nits and weather-resistant construction. SKYWORTH’S Outdoor TV line offers a great value proposition for custom integrators seeking reliable outdoor entertainment solutions.

The SKYWORTH Clarus Outdoor™ TV line has become the preferred solution for Miami-based integrator Henley Garcia from Hemag Inc., who relies on the displays for demanding outdoor entertainment installations across Florida. “The Clarus line delivers exactly what my clients need — exceptional brightness performance in direct sunlight and outstanding value,” Garcia says. “In the ‘Sunshine State,’ these capabilities are non-negotiable for outdoor installations.”

Garcia recently designed an outdoor entertainment area for the Affina Luxury Living community in Kendall, installing two Clarus Partial Sun 55-inch displays and one 75-inch model with URC system integration to create a resort-style entertainment center that residents can enjoy year-round.

SKYWORTH’s Clarus Outdoor™ lineup includes the Clarus “Full Sun” S1, available in 65-inch (MAP: $4,999) and 75-inch (MAP: $6,999) models. The S1 features 3,000-nit brightness for crystal-clear viewing in direct sunlight. The PS1 4K “Partial Sun” model offers 1,200-nit brightness in 55-, 65-, and 75-inch sizes, priced at $3,500, $4,500, and $5,500, respectively.

Engineered for Extreme Conditions
Designed for extreme weather conditions, both Clarus outdoor TVs operate in temperatures from -4°F to 122°F during use and -20°F to 130°F at rest. The all-metal enclosures carry an IP66 rating for the S1 and IP55 rating for the PS1, offering superior protection against dust and water. The S1 includes an industry-leading IK10 impact resistance rating for maximum durability.

Custom integrators nationwide are installing SKYWORTH Clarus displays in both residential and commercial applications. Total Access Communications has successfully deployed SKYWORTH Clarus Outdoor TVs in restaurants and bars with outdoor spaces, including Gas Monkey Icehouse and Little Woodrow’s locations throughout Texas.

About SKYWORTH
SKYWORTH USA is the North American division of SKYWORTH Group, a leading global electronics company established in 1988 and headquartered in Shenzhen. SKYWORTH’s strong international reputation is based on innovation, quality, and sustainability principles. Headquartered in Chino, CA, SKYWORTH USA focuses on providing consumers with affordable, high-quality indoor and outdoor TVs and other home electronics.