Home Blog Page 2773

Medtronic announces Board appointments and shareholder value creation initiatives to advance strategic priorities

Experienced executives John Groetelaars and Bill Jellison appointed to the Board of Directors

Board forms new Growth and Operating committees to sharpen focus on the company’s ongoing strategic portfolio management, operational execution and capital allocation

Plan to host Investor Day in 2026

Initiatives follow constructive engagement with Elliott Management

GALWAY, Ireland, Aug. 19, 2025 /PRNewswire/ — Medtronic plc (NYSE: MDT), a global leader in healthcare technology, today announced the Medtronic Board of Directors has appointed John Groetelaars and Bill Jellison as independent directors, effective immediately.

Consistent with the company’s commitment to shareholder value creation, and to provide enhanced focus and urgency around Medtronic’s ongoing strategic portfolio management, operational improvement and capital allocation, the Board has formed the following special committees to align our governance with existing management focus areas and workstreams: 

  • The Growth Committee will be responsible for guiding the evaluation and execution of growth-accretive tuck-in M&A, organic R&D investments, and potential divestitures, including the continued execution of the recently announced plan to separate its Diabetes business.
  • The Operating Committee will align governance with the company’s initiatives to optimize operational performance, deliver margin expansion, and drive sustained earnings acceleration, including actions company management is taking to improve efficiency in its global manufacturing, supply chain, and operations.

Chief Executive Officer and Chairman of the Board, Geoff Martha, will serve as Chair of both of the newly formed committees, and newly appointed directors, Groetelaars and Jellison, will also serve on one or both of the committees.

“I am pleased to welcome John and Bill to the Medtronic Board of Directors – each of whom brings decades of relevant experience delivering growth as executives and directors of public companies in the medical technology industry. John’s leadership managing global operations and Bill’s deep financial expertise will also be valuable to the boardroom,” said Geoff Martha, chairman and chief executive officer. “We are at an exciting inflection point and in a period of strong momentum, with multiple growth drivers already delivering and additional breakthrough therapies set to launch in the months ahead. With the addition of these new Board members and the formation of these two new committees, we are accelerating our strategic growth priorities and advancing the simplification and optimization of our operations. The separation of MiniMed is an example of the important steps we’re taking to create a more focused and more profitable Medtronic. By sharpening our focus on high-margin growth opportunities, we are well-positioned to deliver stronger performance and greater value for patients, customers, and shareholders.”

Medtronic will host an Investor Day in mid-calendar year 2026 at which the company will discuss the work of the Growth Committee and Operating Committee, including Medtronic’s go-forward strategic priorities and financial algorithm.

Today’s initiatives follow constructive dialogue with Elliott Investment Management L.P. (“Elliott”). 

Martha continued, “We appreciate our productive dialogue with Marc Steinberg and the Elliott team. The durable growth drivers now taking hold across several of our businesses are strengthening Medtronic’s trajectory and reinforcing our conviction in the company’s future. The Board believes Medtronic has the right strategies to build on this momentum and deliver sustained, superior returns for investors over the long-term.”

Elliott Partner Marc Steinberg said, “Our decision to become one of Medtronic’s largest investors was driven by our strong conviction that the company is entering a new chapter of exceptional value creation defined by accelerating growth, operational improvement and enhanced strategic clarity. We believe Medtronic’s recent innovations in some of the medical technology sector’s most attractive markets have positioned the company for an inflection in organic growth. Combined with its renewed focus on portfolio simplification and improved operational execution, Medtronic is set to deliver a sustainable acceleration in earnings growth as well. Today’s announcements – including the addition of new directors with deep medical technology experience and the formation of two focused Board committees – are the right steps towards realizing Medtronic’s potential. We look forward to continuing our constructive partnership with Geoff Martha and the Board and to working closely together to realize this unique value-creation opportunity.”

Groetelaars and Jellison will be nominated to stand for election to the Board at Medtronic’s 2025 Annual General Meeting of Shareholders.

New Board Member Biographies

John Groetelaars brings more than 30 years of global leadership experience across a broad range of medical device sectors. Most recently, Groetelaars served as interim CEO for Dentsply Sirona, having previously served in a director role for the company. Prior to Dentsply Sirona, John was President & CEO at Hillrom from May 2018 until the company’s acquisition by Baxter International, Inc. in 2021. At Hillrom, he provided global leadership for a healthcare technology company with $3 billion in revenue and 10,000+ employees. Prior to joining Hillrom, Groetelaars served as executive vice president and president of the Interventional Segment at Becton, Dickinson and Company following its acquisition of C.R. Bard in December 2017.

Currently, Groetelaars serves as Chairman of the Board of Directors for Zeus Industrial Products. He is also a Board member for Parexel, a global clinical research organization.

Groetelaars earned a bachelor’s degree in Mechanical Engineering from Kettering University and an MBA from Columbia University.

William Jellison is a former medical technology executive and corporate finance expert. From 2013 to 2016, he served as the Vice President, Chief Financial Officer of Stryker Corporation, a global leader in medical technologies. Before joining Stryker, Jellison spent 15 years at Dentsply International in several leadership positions, including CFO. Jellison began his career with the Donnelly Corporation, holding multiple financial management and executive roles, including Vice President of Finance, Treasurer and Corporate Controller.

Jellison currently serves as a Senior Advisor for Astor Place Holdings, the Private Equity arm of Select Equities, and consults with other companies in the medical technology industry. He serves as a director of public companies Avient Corporation and Anika Therapeutics, Inc. as well as a director of private companies Solenis and Young Innovations.

Jellison received a B.A. in Business Administration from Hope College

About Medtronic
Bold thinking. Bolder actions. We are Medtronic. Medtronic plc, headquartered in Galway, Ireland, is the leading global healthcare technology company that boldly attacks the most challenging health problems facing humanity by searching out and finding solutions. Our Mission — to alleviate pain, restore health, and extend life — unites a global team of 95,000+ passionate people across more than 150 countries. Our technologies and therapies treat 70 health conditions and include cardiac devices, surgical robotics, insulin pumps, surgical tools, patient monitoring systems, and more. Powered by our diverse knowledge, insatiable curiosity, and desire to help all those who need it, we deliver innovative technologies that transform the lives of two people every second, every hour, every day. Expect more from us as we empower insight-driven care, experiences that put people first, and better outcomes for our world. In everything we do, we are engineering the extraordinary. For more information on Medtronic (NYSE: MDT), visit www.Medtronic.com and follow Medtronic on LinkedIn.

Any forward-looking statements are subject to risks and uncertainties such as those described in Medtronic’s periodic reports on file with the Securities and Exchange Commission. Actual results may differ materially from anticipated results.

Contacts:
Erika Winkels
Public Relations
+1-763-526-8478

Ryan Weispfenning
Investor Relations
+1-763-505-4626


Medtronic reports first quarter fiscal 2026 financial results

11th quarter in a row of mid-single digit organic revenue growth;
Poised to accelerate growth

GALWAY, Ireland, Aug. 19, 2025 /PRNewswire/ — Medtronic plc (NYSE: MDT), a global leader in healthcare technology, today announced financial results for its first quarter (Q1) of fiscal year 2026 (FY26), which ended July 25, 2025.

Key Highlights

  • Revenue of $8.6 billion, adjusted revenue of $8.5 billion, increased 8.4% as reported and 4.8% organic
  • GAAP diluted EPS of $0.81 increased 1%; non-GAAP diluted EPS of $1.26 increased 2%
  • Company raises FY26 EPS guidance; reiterates FY26 organic revenue growth guidance
  • Cardiac Ablation Solutions revenue increased nearly 50%, including 72% in the US, on strength of pulsed field ablation (PFA) products
  • U.S. Centers for Medicare & Medicaid Services (CMS) posted proposed National Coverage Determination (NCD) for the Symplicity Spyral™ system for hypertension; final NCD expected on or before October 8, 2025
  • Received CE Mark for LigaSure™ RAS vessel-sealing technology on Hugo™ robotic-assisted surgery (RAS) system

“We delivered another consistent quarter of mid-single digit organic revenue growth, with broad strength from several innovative product categories, including Pulsed Field Ablation, Transcatheter Valves, Neuromodulation, Diabetes, and Leadless Pacing,” said Geoff Martha, Medtronic chairman and chief executive officer. “We’re confident and well positioned to accelerate our revenue growth in the second half of our fiscal year, as we make meaningful progress on our major growth drivers.”

Financial Results
Medtronic reported Q1 worldwide revenue of $8.578 billion and adjusted revenue of $8.539 billion, an increase of 8.4% as reported and 4.8% on an organic basis. The organic revenue growth comparison excludes:

  • Other revenue of $72 million in the current year and –$52 million in the prior year; and
  • Foreign currency benefit of $159 million on the remaining segments.

Q1 revenue by segment included:

  • Cardiovascular Portfolio revenue of $3.285 billion increased 9.3% as reported and 7.0% organic, with a high-single digit increase in Cardiac Rhythm & Heart Failure, mid-single digit increase in Structural Heart & Aortic, and low-single digit increase in Coronary & Peripheral Vascular, all on an organic basis;
  • Neuroscience Portfolio revenue of $2.416 billion increased 4.3% reported and 3.1% organic, with a high-single digit increase in Neuromodulation and mid-single digit increase in Cranial & Spinal Technologies, offset by a low-single digit decrease in Specialty Therapies, all on an organic basis;
  • Medical Surgical Portfolio revenue of $2.083 billion grew 4.4% as reported and 2.4% organic, with low-single digit organic growth in both Surgical & Endoscopy and Acute Care & Monitoring; and
  • Diabetes business revenue of $721 million increased 11.5% as reported and 7.9% organic.

Q1 GAAP operating profit and operating margin were $1.445 billion and 16.8%, respectively, increases of 13% and 70 basis points, respectively. As detailed in the financial schedules included at the end of the release, Q1 non-GAAP operating profit and operating margin were $2.016 billion and 23.6%, respectively, an increase of 3% and decrease of 80 basis points, respectively.

Q1 GAAP net income and diluted earnings per share (EPS) were $1.040 billion and $0.81, respectively, flat and an increase of 1%, respectively. As detailed in the financial schedules included at the end of this release, Q1 non-GAAP net income and non-GAAP diluted EPS were $1.626 billion and $1.26, respectively, both increases of 2%. Non-GAAP diluted EPS had no impact from foreign currency translation.

Guidance
The company today reiterated its FY26 revenue growth and raised its FY26 EPS guidance.

The company continues to expect FY26 organic revenue growth of approximately 5%. The organic revenue growth guidance excludes the impact of foreign currency exchange and revenue reported as Other. Including Other revenue and the impact of foreign currency exchange, assuming recent foreign currency exchange rates, FY26 revenue growth on a reported basis would be in the range of 6.5% to 6.8%.

Excluding the potential impact from tariffs, Medtronic now expects underlying FY26 diluted non-GAAP EPS growth to be approximately 4.5% versus the prior guidance of approximately 4%. Including the reduced potential impact from tariffs of approximately $185 million versus the prior range of approximately $200 million to $350 million, Medtronic is raising its FY26 diluted non-GAAP EPS guidance to the new range of $5.60 to $5.66 versus the prior range of $5.50 to $5.60.

“As a result of our Q1 EPS outperformance and improved tariff impact assumption, we are raising our full year EPS guidance,” said Thierry Piéton, Medtronic chief financial officer. “Our confidence continues to increase as we advance our revenue growth drivers and execute on efficiencies in manufacturing, supply chain, and operating expenses to drive earnings growth, and increase our growth investments in R&D, sales, and marketing, all with a deliberate focus on creating long-term shareholder value.”

Video Webcast Information
Medtronic will host a video webcast today, August 19, at 8:00 a.m. EDT (7:00 a.m. CDT) to provide information about its business for the public, investors, analysts, and news media. This webcast can be accessed by clicking on the Quarterly Earnings icon at investorrelations.medtronic.com, and this earnings release will be archived at news.medtronic.com. Within 24 hours of the webcast, a replay of the webcast and transcript of the company’s prepared remarks will be available by clicking on the Past Events and Presentations link under the News & Events drop-down at investorrelations.medtronic.com.

Financial Schedules and Earnings Presentation
The first quarter financial schedules and non-GAAP reconciliations can be viewed by clicking on the Quarterly Earnings link at investorrelations.medtronic.com. To view a printable PDF of the financial schedules and non-GAAP reconciliations, click here. To view the first quarter earnings presentation, click here.

About Medtronic
Bold thinking. Bolder actions. We are Medtronic. Medtronic plc, headquartered in Galway, Ireland, is the leading global healthcare technology company that boldly attacks the most challenging health problems facing humanity by searching out and finding solutions. Our Mission — to alleviate pain, restore health, and extend life — unites a global team of 95,000+ passionate people across more than 150 countries. Our technologies and therapies treat 70 health conditions and include cardiac devices, surgical robotics, insulin pumps, surgical tools, patient monitoring systems, and more. Powered by our diverse knowledge, insatiable curiosity, and desire to help all those who need it, we deliver innovative technologies that transform the lives of two people every second, every hour, every day. Expect more from us as we empower insight-driven care, experiences that put people first, and better outcomes for our world. In everything we do, we are engineering the extraordinary. For more information on Medtronic (NYSE: MDT), visit www.Medtronic.com and follow on LinkedIn.

FORWARD LOOKING STATEMENTS
This press release contains forward-looking statements within the meaning of the Private Securities Litigation Reform Act of 1995, which are subject to risks and uncertainties, including risks related to competitive factors, difficulties and delays inherent in the development, manufacturing, marketing and sale of medical products, government regulation, geopolitical conflicts, changing global trade policies, material acquisition and divestiture transactions, general economic conditions, and other risks and uncertainties described in the company’s periodic reports on file with the U.S. Securities and Exchange Commission including the most recent Annual Report on Form 10-K of the company. In some cases, you can identify these statements by forward-looking words or expressions, such as “anticipate,” “believe,” “could,” “estimate,” “expect,” “forecast,” “intend,” “looking ahead,” “may,” “plan,” “possible,” “potential,” “project,” “should,” “going to,” “will,” and similar words or expressions, the negative or plural of such words or expressions and other comparable terminology. Actual results may differ materially from anticipated results. Medtronic does not undertake to update its forward-looking statements or any of the information contained in this press release, including to reflect future events or circumstances.

NON-GAAP FINANCIAL MEASURES
This press release contains financial measures, including adjusted net income, adjusted diluted EPS, and organic revenue, which are considered “non-GAAP” financial measures under applicable SEC rules and regulations. References to quarterly or annual figures increasing, decreasing or remaining flat are in comparison to fiscal year 2025, and references to sequential changes are in comparison to the prior fiscal quarter. Unless stated otherwise, quarterly and annual rates and ranges are given on an organic basis.

Medtronic management believes that non-GAAP financial measures provide information useful to investors in understanding the company’s underlying operational performance and trends and to facilitate comparisons with the performance of other companies in the med tech industry. Non-GAAP net income and diluted EPS exclude the effect of certain charges or gains that contribute to or reduce earnings but that result from transactions or events that management believes may or may not recur with similar materiality or impact to operations in future periods (Non-GAAP Adjustments). Medtronic generally uses non-GAAP financial measures to facilitate management’s review of the operational performance of the company and as a basis for strategic planning. Non-GAAP financial measures should be considered supplemental to and not a substitute for financial information prepared in accordance with U.S. generally accepted accounting principles (GAAP), and investors are cautioned that Medtronic may calculate non-GAAP financial measures in a way that is different from other companies. Management strongly encourages investors to review the company’s consolidated financial statements and publicly filed reports in their entirety. Reconciliations of the non-GAAP financial measures to the most directly comparable GAAP financial measures are included in the financial schedules accompanying this press release.

Medtronic calculates forward-looking non-GAAP financial measures based on internal forecasts that omit certain amounts that would be included in GAAP financial measures. For instance, forward-looking organic revenue growth guidance excludes the impact of foreign currency fluctuations, as well as significant acquisitions, divestitures, or other significant discrete items. Forward-looking diluted non-GAAP EPS guidance also excludes other potential charges or gains that would be recorded as Non-GAAP Adjustments to earnings during the fiscal year. Medtronic does not attempt to provide reconciliations of forward-looking non-GAAP EPS guidance to projected GAAP EPS guidance because the combined impact and timing of recognition of these potential charges or gains is inherently uncertain and difficult to predict and is unavailable without unreasonable efforts. In addition, the company believes such reconciliations would imply a degree of precision and certainty that could be confusing to investors. Such items could have a substantial impact on GAAP measures of financial performance.

Contacts:
Erika Winkels
Public Relations
+1-763-526-8478

Ryan Weispfenning
Investor Relations
+1-763-505-4626

MEDTRONIC PLC

WORLD WIDE REVENUE(1)

(Unaudited)

FIRST QUARTER

REPORTED

ORGANIC

(in millions)

FY26

FY25

Growth

Currency
Impact(4)

FY26(5)

FY25(5)

Growth

Cardiovascular

$          3,285

$          3,007

9.3 %

$              68

$          3,217

$          3,007

7.0 %

Cardiac Rhythm & Heart Failure

1,712

1,535

11.5

37

1,676

1,535

9.1

Structural Heart & Aortic

930

856

8.7

22

908

856

6.1

Coronary & Peripheral Vascular

643

616

4.5

10

633

616

2.9

Neuroscience

2,416

2,317

4.3

27

2,389

2,317

3.1

Cranial & Spinal Technologies

1,211

1,147

5.5

12

1,199

1,147

4.5

Specialty Therapies

702

713

(1.5)

9

694

713

(2.7)

Neuromodulation

504

457

10.2

7

496

457

8.6

Medical Surgical

2,083

1,996

4.4

40

2,044

1,996

2.4

Surgical & Endoscopy

1,612

1,544

4.4

32

1,580

1,544

2.3

Acute Care & Monitoring

471

452

4.3

8

464

452

2.6

Diabetes

721

647

11.5

23

698

647

7.9

Total Reportable Segments

8,506

7,967

6.8

159

8,347

7,967

4.8

Other(2)

72

(52)

NM(3)

3

TOTAL

$          8,578

$          7,915

8.4 %

$            162

$          8,347

$          7,967

4.8 %

(1)

The data in this schedule has been intentionally rounded to the nearest million and, therefore, may not sum. Percentages have been calculated using actual, non-rounded figures and, therefore, may not recalculate precisely.

(2)

Includes the historical operations and ongoing transition agreements from businesses the Company has exited or divested and adjustments to the Company’s Italian payback accruals resulting from the two July 22, 2024 rulings by the Constitutional Court and the Legislative Decree published by the Italian government on June 30, 2025 for certain prior years since 2015.

(3)

Not meaningful (NM)

(4)

The currency impact to revenue measures the change in revenue between current and prior year periods using constant exchange rates.

(5)

The three months ended July 25, 2025 includes $231 million of revenue adjustments, including $33 million of inorganic revenue for the transition activity noted in (2), $39 million reduction in the Italian payback accruals due to  changes in estimates further described in note (2), and $159 million of favorable currency impact on the remaining segments. The three months ended July 26, 2024 excludes $52 million of revenue adjustments related to $90 million of incremental Italian payback accruals further described in note (2) and $38 million of inorganic revenue related to the transition activity noted in (2).


MEDTRONIC PLC

U.S. REVENUE(1)(2)

(Unaudited)

FIRST QUARTER

REPORTED

ORGANIC

(in millions)

FY26

FY25

Growth

FY26

FY25

Growth

Cardiovascular

$          1,479

$          1,403

5.5 %

$          1,479

$          1,403

5.5 %

Cardiac Rhythm & Heart Failure

834

766

8.9

834

766

8.9

Structural Heart & Aortic

371

368

0.8

371

368

0.8

Coronary & Peripheral Vascular

274

268

2.1

274

268

2.1

Neuroscience

1,624

1,565

3.8

1,624

1,565

3.8

Cranial & Spinal Technologies

890

855

4.1

890

855

4.1

Specialty Therapies

393

398

(1.3)

393

398

(1.3)

Neuromodulation

341

312

9.4

341

312

9.4

Medical Surgical

884

881

0.4

884

881

0.4

Surgical & Endoscopy

622

630

(1.3)

622

630

(1.3)

Acute Care & Monitoring

263

251

4.5

263

251

4.5

Diabetes

217

215

0.9

217

215

0.9

Total Reportable Segments

4,205

4,064

3.5

4,205

4,064

3.5

Other(3)

20

18

6.4

TOTAL

$          4,224

$          4,082

3.5 %

$          4,205

$          4,064

3.5 %

(1)

U.S. includes the United States and U.S. territories.

(2)

The data in this schedule has been intentionally rounded to the nearest million and, therefore, may not sum. Percentages have been calculated using actual, non-rounded figures and, therefore, may not recalculate precisely.

(3)

Includes historical operations and ongoing transition agreements from businesses the Company has exited or divested.


MEDTRONIC PLC

INTERNATIONAL REVENUE(1)

(Unaudited)

FIRST QUARTER

REPORTED

ORGANIC

(in millions)

FY26

FY25

Growth

Currency
Impact(4)

FY26(5)

FY25(5)

Growth

Cardiovascular

$          1,806

$          1,604

12.6 %

$              68

$          1,737

$          1,604

8.3 %

Cardiac Rhythm & Heart Failure

878

769

14.2

37

842

769

9.4

Structural Heart & Aortic

558

487

14.6

22

536

487

10.1

Coronary & Peripheral Vascular

369

347

6.3

10

359

347

3.4

Neuroscience

792

752

5.4

27

765

752

1.7

Cranial & Spinal Technologies

320

292

9.7

12

309

292

5.7

Specialty Therapies

309

314

(1.7)

9

301

314

(4.4)

Neuromodulation

163

146

11.9

7

156

146

6.9

Medical Surgical

1,199

1,115

7.5

40

1,159

1,115

4.0

Surgical & Endoscopy

990

915

8.3

32

958

915

4.8

Acute Care & Monitoring

209

200

4.1

8

201

200

0.2

Diabetes

504

432

16.7

23

481

432

11.4

Total Reportable Segments

4,301

3,903

10.2

159

4,142

3,903

6.1

Other(2)

53

(70)

NM(3)

3

TOTAL

$          4,354

$          3,832

13.6 %

$            162

$          4,142

$          3,903

6.1 %

(1)

The data in this schedule has been intentionally rounded to the nearest million and, therefore, may not sum. Percentages have been calculated using actual, non-rounded figures and, therefore, may not recalculate precisely.

(2)

Includes the historical operations and ongoing transition agreements from businesses the Company has exited or divested and adjustments to the Company’s Italian payback accruals resulting from the two July 22, 2024 rulings by the Constitutional Court and the Legislative Decree published by the Italian government on June 30, 2025 for certain prior years since 2015.

(3)

Not meaningful (NM)

(4)

The currency impact to revenue measures the change in revenue between current and prior year periods using constant exchange rates.

(5)

The three months ended July 25, 2025 includes $212 million of revenue adjustments, including $14 million of inorganic revenue for the transition activity noted in (2), $39 million reduction in the Italian payback accruals due to  changes in estimates further described in note (2), and $159 million of favorable currency impact on the remaining segments. The three months ended July 26, 2024 excludes $70 million of revenue adjustments related to $90 million of incremental Italian payback accruals further described in note (2) and $19 million of inorganic revenue related to the transition activity noted in (2).


MEDTRONIC PLC

CONSOLIDATED STATEMENTS OF INCOME

(Unaudited) 

‌‌

Three months ended

(in millions, except per share data)

July 25, 2025

July 26, 2024

Net sales

$             8,578

$             7,915

Costs and expenses:

Cost of products sold, excluding amortization of intangible assets

3,001

2,761

Research and development expense

726

676

Selling, general, and administrative expense

2,806

2,655

Amortization of intangible assets

459

414

Restructuring charges, net

45

47

Certain litigation charges, net

27

81

Other operating expense, net

70

1

Operating profit

1,445

1,278

Other non-operating income, net

(33)

(157)

Interest expense, net

176

167

Income before income taxes

1,302

1,268

Income tax provision

255

220

Net income

1,047

1,049

Net income attributable to noncontrolling interests

(7)

(6)

Net income attributable to Medtronic

$             1,040

$             1,042

Basic earnings per share

$               0.81

$               0.81

Diluted earnings per share

$               0.81

$               0.80

Basic weighted average shares outstanding

1,281.6

1,293.3

Diluted weighted average shares outstanding

1,287.1

1,296.5

The data in the schedule above has been intentionally rounded to the nearest million.


MEDTRONIC PLC

GAAP TO NON-GAAP RECONCILIATIONS(1)

(Unaudited) 

Three months ended July 25, 2025

(in millions, except per share data)

Net
Sales

Cost of
Products
Sold

Gross
Margin
Percent

Operating
Profit

Operating
Profit
Percent

Income
Before
Income
Taxes

Net Income
attributable
to
Medtronic

Diluted
EPS

Effective
Tax Rate

GAAP

$  8,578

$   3,001

65.0 %

$     1,445

16.8 %

$    1,302

$       1,040

$     0.81

19.6 %

Non-GAAP Adjustments:

Amortization of intangible assets(2)

459

5.5

459

374

0.29

18.5

Restructuring and associated costs(3)

(16)

0.1

67

0.8

67

51

0.04

22.4

Acquisition and divestiture-related items(4)

(7)

58

0.7

58

48

0.04

17.2

Certain litigation charges, net

27

0.3

27

21

0.02

22.2

(Gain)/loss on minority investments(5)

113

107

0.08

6.2

Other(6)

(39)

(0.2)

(39)

(0.5)

(39)

(30)

(0.02)

20.5

Certain tax adjustments, net

16

0.01

Non-GAAP

$  8,539

$   2,979

65.1 %

$     2,016

23.6 %

$    1,987

$       1,626

$     1.26

17.8 %

Currency impact

(159)

(46)

(0.1)

(10)

0.3

Currency Adjusted

$  8,380

$   2,933

65.0 %

$     2,006

23.9 %

$     1.26

Three months ended July 26, 2024

(in millions, except per share data)

Net
Sales

Cost of
Products
Sold

Gross
Margin
Percent

Operating
Profit

Operating
Profit
Percent

Income
Before
Income
Taxes

Net Income
attributable
to
Medtronic

Diluted
EPS

Effective
Tax Rate

GAAP

$  7,915

$   2,761

65.1 %

$     1,278

16.1 %

$    1,268

$       1,042

$     0.80

17.4 %

Non-GAAP Adjustments:

Amortization of intangible assets

414

5.1

414

340

0.26

18.1

Restructuring and associated costs(3)

(9)

0.1

62

0.8

62

51

0.04

19.4

Acquisition and divestiture-related items(4)

(10)

0.1

12

0.1

12

11

0.01

8.3

Certain litigation charges, net

81

1.0

81

68

0.05

16.0

(Gain)/loss on minority investments(5)

(17)

(17)

(0.01)

Medical device regulations(7)

(11)

0.1

14

0.2

14

11

0.01

21.4

Other(6)

90

0.6

90

1.1

90

70

0.05

22.2

Certain tax adjustments, net

17

0.01

Non-GAAP

$  8,004

$   2,730

65.9 %

$     1,953

24.4 %

$    1,925

$       1,592

$     1.23

17.0 %

See description of non-GAAP financial measures contained in the press release dated August 19, 2025.

(1)

The data in this schedule has been intentionally rounded to the nearest million or $0.01 for EPS figures, and, therefore, may not sum.

(2)

The Company recognized $45 million of accelerated amortization on certain intangible assets within the Cardiovascular Portfolio.

(3)

The charges primarily relate to employee termination benefits and facility related and contract termination costs.

(4)

The charges primarily include business combination costs, changes in fair value of contingent consideration, and exit of business-related charges. For the three months ended July 25, 2025, exit of business-related charges primarily relate to the impending separation of the Diabetes business and costs associated with the Company’s June 2021 decision to stop the distribution and sale of the Medtronic HVAD System.

(5)

We exclude unrealized and realized gains and losses on our minority investments as we do not believe that these components of income or expense have a direct correlation to our ongoing or future business operations.

(6)

Reflects adjustments to the Company’s Italian payback accruals resulting from the two July 22, 2024 rulings by the Constitutional Court and the Legislative Decree published by the Italian government on June 30, 2025 for certain prior years since 2015.

(7)

The charges represent incremental costs of complying with the new European Union (E.U.) medical device regulations for previously registered products and primarily include charges for contractors supporting the project and other direct third-party expenses. We consider these costs to be duplicative of previously incurred costs and/or one-time costs.


MEDTRONIC PLC

GAAP TO NON-GAAP RECONCILIATIONS(1)

(Unaudited) 

Three months ended July 25, 2025

(in millions)

Net
Sales

SG&A
Expense

SG&A
Expense as
a % of Net
Sales

R&D
Expense

R&D
Expense
as a % of
Net Sales

Other
Operating
(Income)
Expense,
net

Other
Operating
(Inc.)/Exp.,
net as a % of
Net Sales

Other Non-
Operating
Income, net

GAAP

$      8,578

$     2,806

32.7 %

$       726

8.5 %

$           70

0.8 %

$           (33)

Non-GAAP Adjustments:

Restructuring and associated costs(2)

(5)

Acquisition and divestiture-related items(3)

(26)

(0.2)

(25)

(0.3)

Other(4)

(39)

(Gain)/loss on minority investments(5)

(113)

Non-GAAP

$      8,539

$     2,775

32.5 %

$       725

8.5 %

$           44

0.5 %

$          (146)

See description of non-GAAP financial measures contained in the press release dated August 19, 2025.

(1)

The data in this schedule has been intentionally rounded to the nearest million, and, therefore, may not sum.

(2)

The charges primarily relate to employee termination benefits and facility related and contract termination costs.

(3)

The charges primarily include changes in fair value of contingent consideration and exit of business-related charges, which primarily relate to the impending separation of the Diabetes business and costs associated with the Company’s June 2021 decision to stop the distribution and sale of the Medtronic HVAD System.

(4)

Reflects adjustments to the Company’s Italian payback accruals resulting from the Legislative Decree published by the Italian government on June 30, 2025 for certain prior years since 2015.

(5)

We exclude unrealized and realized gains and losses on our minority investments as we do not believe that these components of income or expense have a direct correlation to our ongoing or future business operations.


MEDTRONIC PLC

GAAP TO NON-GAAP RECONCILIATIONS(1)

(Unaudited)

Three months ended

(in millions)

July 25, 2025

July 26, 2024

Net cash provided by operating activities

$                      1,088

$                        986

Additions to property, plant, and equipment

(504)

(520)

Free Cash Flow(2)

$                         584

$                        466

See description of non-GAAP financial measures contained in the press release dated August 19, 2025.

(1)

The data in this schedule has been intentionally rounded to the nearest million, and, therefore, may not sum.

(2)

Free cash flow represents operating cash flows less property, plant, and equipment additions.


MEDTRONIC PLC

CONSOLIDATED STATEMENTS OF CASH FLOWS

(Unaudited)

Three months ended

(in millions)

July 25, 2025

July 26, 2024

Operating Activities:

Net income

$                1,047

$                1,049

Adjustments to reconcile net income to net cash provided by operating activities:

  Depreciation and amortization

748

662

  Provision for credit losses

28

18

  Deferred income taxes

167

88

  Stock-based compensation

86

83

  Other, net

159

(9)

  Change in operating assets and liabilities, net of acquisitions and divestitures:

  Accounts receivable, net

288

110

  Inventories

(373)

(217)

  Accounts payable and accrued liabilities

(598)

(604)

  Other operating assets and liabilities

(464)

(194)

Net cash provided by operating activities

1,088

986

Investing Activities:

Additions to property, plant, and equipment

(504)

(520)

Purchases of investments

(2,100)

(1,879)

Sales and maturities of investments

2,010

2,157

Other investing activities, net

(125)

(17)

Net cash used in investing activities

(719)

(259)

Financing Activities:

Change in current debt obligations, net

649

(624)

Issuance of long-term debt

3,209

Payments on long-term debt

(1,162)

Dividends to shareholders

(910)

(898)

Issuance of ordinary shares

95

89

Repurchase of ordinary shares

(123)

(2,492)

Other financing activities, net

70

(15)

Net cash used in financing activities

(1,381)

(731)

Effect of exchange rate changes on cash and cash equivalents

67

31

Net change in cash and cash equivalents

(945)

27

Cash and cash equivalents at beginning of period

2,218

1,284

Cash and cash equivalents at end of period

$                1,273

$                1,311

Supplemental Cash Flow Information

Cash paid for:

  Income taxes

$                   402

$                   394

  Interest

81

119

The data in this schedule has been intentionally rounded to the nearest million, and, therefore, may not sum.


Vingroup inaugurates and breaks ground on six major projects nationwide to celebrate Vietnam’s 80th national day


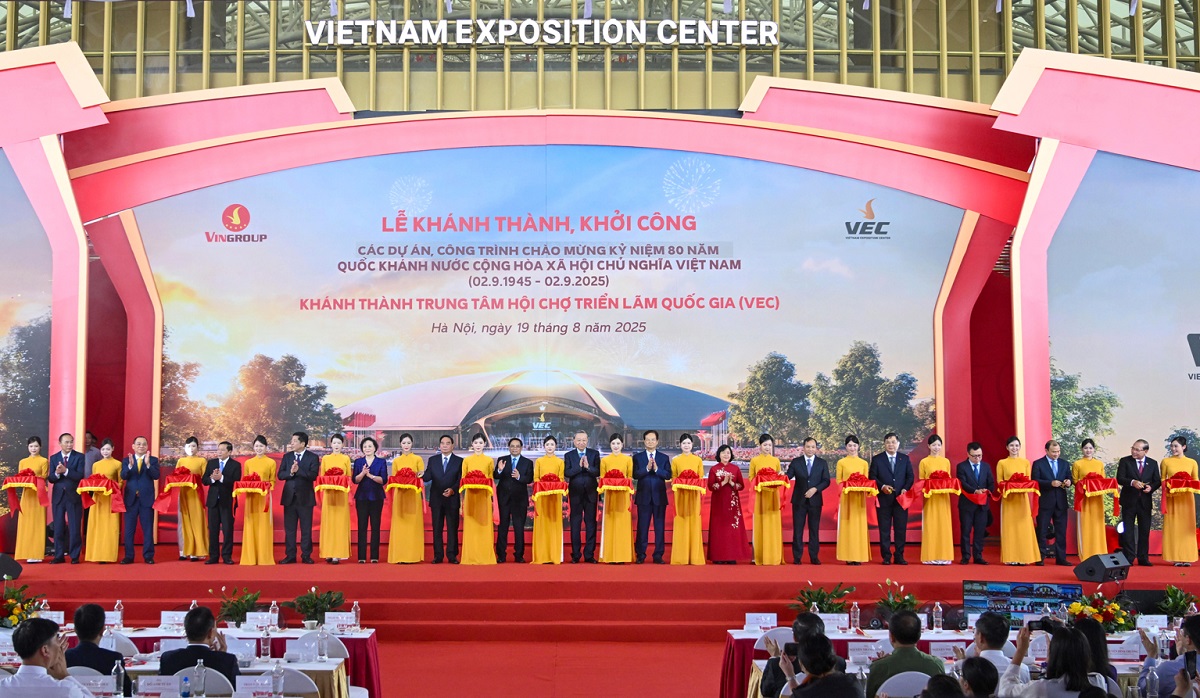
HANOI, VIETNAM – Media OutReach Newswire – 19 August 2025 To mark the 80th anniversary of the National Day of the Socialist Republic of Vietnam, Vingroup inaugurated and broke ground on six major projects across the country. The highlight was the inauguration ceremony of the National Exhibition and Convention Center in Dong Anh, Hanoi, alongside five other landmark projects in the fields of socio-economic infrastructure, transportation, industry, urban development, and tourism in Hai Phong, Quang Ninh, Ha Tinh, Tay Ninh, and Dong Nai.

The General Secretary, the Prime Minister, and other delegates cut the ribbon to inaugurate the National Exhibition and Convention Center – a key national project.

These events form part of the official national program to inaugurate and commence construction of projects celebrating the 80th anniversary of the National Day of the Socialist Republic of Vietnam (September 2, 1945 – September 2, 2025).

The inauguration of the National Exhibition and Convention Center at Tu Lien Bridge Road, Dong Anh, Hanoi, served as the central venue of the program, with the attendance of General Secretary To Lam, Prime Minister Pham Minh Chinh, members and former members of the Politburo, members of the Party Central Committee, as well as current and former leaders of the Party, the State, and heads of central and local ministries and agencies.

Speaking at the event, Prime Minister Pham Minh Chinh emphasized that the National Exhibition and Convention Center, completed in just under 10 months, is poised to become a space that will foster the development of Vietnam’s cultural and entertainment industries.

The Prime Minister praised the determination of enterprises, particularly private ones, in building and developing national infrastructure with the spirit: What we say, we do. What we commit, we deliver. Once we act and commit, there must be tangible results. And today, we have proved this.

Prime Minister Pham Minh Chinh also affirmed that these projects demonstrate Vietnam’s determination to achieve self-reliance and master technology in socio-economic infrastructure development, creating projects in Vietnam, for Vietnam, and by the Vietnamese people.

I hope that we will see more iconic projects of Vietnam, admired and recognized by friends across the region and around the world,” the Prime Minister said.

The National Exhibition and Convention Center spans more than 900,000 m², positioned to become the largest exhibition complex in Southeast Asia and one of the Top 10 largest in the world.

At the core of the complex is the iconic Kim Quy Exhibition Hall, featuring a colossal 24,000-ton steel dome, 56 meters high, inspired by the legendary Golden Turtle God (Kim Quy) whose myth is closely linked with the heritage site of Co Loa. Covering approximately 130,000 m², the Kim Quy Hall comprises nine major exhibition halls and one central grand hall, offering an ideal space for specialized exhibitions and large-scale events, with versatile layouts optimized for diverse displays.

The exhibition ecosystem also includes a permanent exhibition center (Block A), four outdoor exhibition areas (East – West – South – North), and VinPalace Co Loa, the largest international convention center in Vietnam, covering 16,800 m² with 12 banquet and conference halls that can host events from several hundred to over 5,000 guests. Complementary facilities include landscaped parks and lakes, a food court of over 3,000 m², and parking areas spanning more than 18 hectares, accommodating over 10,000 vehicles.

After an accelerated construction period of just 10 months, the National Exhibition and Convention Center has officially been inaugurated and is ready to host the national milestone event celebrating the 80th National Independence Day: the exhibition “80 Years of Independence – Freedom – Happiness.”

The second project site was the inauguration of the May Chai Bridge (Royal Bridge) and its approach roads, part of the Vinhomes Royal Island project in Hai Phong. Spanning nearly 2.2 km in length and 21 meters in width with four lanes, the bridge connects Vu Yen Island with Le Thanh Tong Street, reducing travel time to the city center to under five minutes. With its twin arch towers symbolizing both soaring wings and a welcoming “World Gateway Bridge,” the Royal Bridge is set to become a new landmark of Hai Phong, embodying openness to investment and economic opportunities.

The third project site was the groundbreaking of an 18-hole international-standard golf course in Quang Hanh, Quang Ninh, covering 100 hectares. Nestled among natural forests with views of both mountains and Ha Long Bay, the course was designed under the philosophy of environmental preservation by renowned contemporary golf course designer Doug Carrick. Once operational, it will elevate Quang Ninh’s reputation in tourism and sports.

The fourth project site marked the start of construction on the Vinhomes Industrial Park in Vung Ang, Ha Tinh. Located on lots CN4 and CN5 of the Vung Ang Economic Zone, the project spans nearly 965 hectares, making it one of the largest in the region, with modern, synchronized infrastructure including factories, ports, and logistics facilities. The project is set to attract leading national and regional enterprises in industry, high technology, logistics, and exports—driving local economic growth and enabling Vietnamese enterprises to expand globally.

The fifth project site was the groundbreaking of the Phuoc Vinh Tay New Urban Area in Tay Ninh, covering 1,089.6 hectares. Developed as an eco-smart sustainable city, it will feature a complete ecosystem of education, healthcare, commerce, and services, positioning it as one of the province’s most significant future urban developments.

The sixth project site was the commencement of Component Project 1: Construction of the Western North-South Expressway, Gia Nghia (Dak Nong) – Chon Thanh (Binh Phuoc) section, passing through Dong Nai province. The expressway spans 124.13 km (23.1 km in Dak Nong, 101.03 km in Binh Phuoc), designed for a full six-lane scale. Strategically, it will connect the Central Highlands with the Southeast region, particularly Dak Nong and Binh Phuoc with Ho Chi Minh City, unlocking regional economic potential and creating new growth momentum.

By simultaneously inaugurating and breaking ground on national-scale infrastructure projects across six provinces and cities, Vingroup reaffirms its pioneering role in strengthening Vietnam’s internal capabilities. These projects reflect the spirit of innovation and progress in the nation’s 80-year journey of independence, renewal, and global integration.
Hashtag: #Vingroup

The issuer is solely responsible for the content of this announcement.

G-P Introduces Next Generation of Agentic AI-Powered G-P Employer of Record (EOR)

Built on a serverless, event-driven platform and advanced agentic AI, G-P EOR delivers frictionless self-service global employment

BOSTON, Aug. 19, 2025 /PRNewswire/ — REMOTE FIRST COMPANY – G-P (Globalization Partners), recognized as the undisputed leader in global employment by industry analysts, today announced the next generation of G-P Employer of Record (EOR) to deliver a compliant global employment solution that enables HR teams to effortlessly expand globally with autonomy and efficiency. Built on a serverless, event-driven platform and advanced agentic AI, G-P EOR delivers frictionless self-service compliant global employment in more than 180 countries. G-P EOR is powered by G-P’s Global Compliance Engine (GCE), the first knowledge base with actionable, real-time compliance and G-P Assist, G-P’s in-platform agentic AI support.

“G-P created the EOR category, and now we are raising the bar with our next generation Global Compliance Engine and advanced agentic AI to remove the complexities of global employment,” said Nat Natarajan, chief product and strategy officer, G-P. “G-P EOR transcends traditional SaaS solutions, delivering a single, seamless platform leveraging the power of compliance, AI and human expertise that empowers customers with a competitive edge.”

GCE powers the advanced agentic AI capabilities in G-P EOR, helping customers avoid costly mistakes by providing real-time guidance and compliance guardrails. GCE understands the vast complexity of labor laws across more than 180 countries and applies that knowledge in real time. GCE’s intelligence is backed by the industry’s most sophisticated compliance data and G-P’s 10+ years of global employment expertise, ensuring that every automated workflow is inherently reliable and compliant.

New G-P EOR innovations include:

  • Self-Service for Autonomy and Efficiency: G-P’s enhanced self-service functionality offers users unprecedented direct control and insights into onboarding and the employment lifecycle. This leads to significant time savings and increased productivity as users can complete onboarding in minutes.
  • Real-Time Intelligence through its Agentic AI Platform: G-P Assist delivers instant, compliant answers to HR questions and simplifies HR processes across 180 countries through G-P’s agentic AI platform. G-P Assist also provides a direct connection to the industry’s largest team of in-country legal and HR experts -delivering an unmatched combination of technology and human expertise.
  • API-First Architecture for Seamless Integration and Automation: G-P’s new API and Developer Portal makes it easy to integrate G-P EOR directly into existing HCM, ERP and custom enterprise systems. The automation of time-intensive business processes ensures critical employee data is consistent across all systems and provides unified management of talent across the organization.
  • Intuitive, Modern and Streamlined User Interface: The platform’s clean, intuitive, and consistently responsive user experience ensures a seamless journey across all devices. This focus on design eliminates workflow friction, empowering users to find information, complete tasks and onboard talent faster than ever before.

Watch a video about the next generation of G-P EOR here and learn more on g-p.com.

About G-P
G-P (Globalization Partners) is the recognized leader in global employment, ranked No. 1 in every industry analyst report. G-P’s global employment platform delivers everything companies of all sizes need to manage the full employee lifecycle with its trusted Global HR Agent, G-P Gia, and AI-powered Employer of Record (EOR) and Contractor products. G-P supports teams in 180+ countries with more than a decade of global employment experience, the largest team of in-country HR, legal, and compliance experts, and its unmatched proprietary knowledge base.

G-P: Global Made Possible
To learn more, please visit: g-p.com or connect with us via LinkedIn, X, Facebook or check out our Blog.

Media Contact:
comms@g-p.com

Databricks is raising a Series K Investment at >$100 billion valuation

SAN FRANCISCO, Aug. 19, 2025 /PRNewswire/ — Databricks, the Data and AI company, today announced it has signed a term sheet for its Series K round, which it expects to close soon with backing from existing investors. This funding values the company at >$100 billion.

The company expects to use the new capital to accelerate its AI strategy — expanding Agent Bricks, investing in its new database offering Lakebase, and fueling global growth. At the June Data + AI Summit, Databricks introduced a new product, Agent Bricks, which builds high-quality, production AI agents optimized on your enterprise data, and Lakebase, a new type of operational database (OLTP), built on open source Postgres, and optimized for AI Agents. The investment is also expected to support future AI acquisitions and deepen AI research.

“We’re seeing tremendous investor interest because of the momentum behind our AI products, which power the world’s largest businesses and AI services,” said Ali Ghodsi, co-founder and CEO of Databricks. “Every company can securely turn its enterprise data into AI apps and agents to grow revenue faster, operate more efficiently, and make smarter decisions with less risk. Databricks is benefiting from an unprecedented global demand for AI apps and agents, turning companies’ data into goldmines. We’re thrilled this round is already over-subscribed and to partner with strategic, long-term investors who share our vision for the future of AI.”

This new investment comes on the heels of strong momentum for Databricks. In the last two quarters, the company has launched or expanded partnerships with Microsoft, Google Cloud, Anthropic, SAP, and Palantir. More than 15,000 customers around the world use the Databricks Data Intelligence Platform to democratize access to data and AI, making it easier to harness the power of their data for analytics and AI apps and agents. Built on an open source foundation, the platform enables organizations to drive innovation that increases revenue, lowers costs, and reduces risk.

About Databricks
Databricks is the Data and AI company. More than 15,000 organizations worldwide — including Block, Comcast, Condé Nast, Rivian, Shell and over 60% of the Fortune 500 — rely on the Databricks Data Intelligence Platform to take control of their data and put it to work with AI. Databricks is headquartered in San Francisco, with offices around the globe and was founded by the original creators of Lakehouse, Apache Spark™, Delta Lake, MLflow, and Unity Catalog. To learn more, follow Databricks on X, LinkedIn and Facebook.

Contact: Press@databricks.com

FNZ launches Advisor AI to redefine advisor productivity and scale personalized advice

  • FNZ launches Advisor AI, a next-generation artificial intelligence solution that enables advisors to work more efficiently, engage clients more effectively, and rapidly scale the delivery of personalized advice
  • Embedded directly into FNZ’s market leading wealth platform, Advisor AI improves advisor productivity, enhances the client experience and reduces administrative burden
  • Advisor AI is the first in a series of new AI-driven solutions FNZ will launch to further boost advisor productivity and client engagement
  • The launch follows the recently announced strategic partnership with Microsoft, which further enhances FNZ’s global platform with advanced AI, automation and cloud capabilities

LONDON and NEW YORK, Aug. 19, 2025 /PRNewswire/ — FNZ, the global wealth management platform, has today announced the global launch of FNZ Advisor AI, a generative AI solution embedded directly into FNZ’s market leading wealth management platform. The solution will help financial advisors enhance productivity, deliver more personalized advice and serve more clients at scale.

The modern advisor’s context

Today’s financial advisors face growing pressure to meet evolving client expectations, regulatory obligations and business growth targets, all while managing rising operational complexity.

Recent FNZ research found that 73% of wealth management clients expect more personalized services from their advisor in the next two years, while 70% of advisors believe better technology is essential to meeting those expectations.

FNZ Advisor AI addresses these challenges by integrating intelligent automation and AI-driven efficiencies directly into FNZ’s market leading platform, placing powerful capabilities right at an advisor’s fingertips.

Why FNZ Advisor AI will change the game

With more than 650 financial institution partners, over 26 million end investors and close to $2 trillion in assets on platform, FNZ provides access to one of the largest wealth management data sets in the world.

This enables FNZ Advisor AI to support smarter, faster decision-making by generating real-time insights based on client and portfolio data. Advisors can proactively identify opportunities, flag risks and tailor their recommendations across their full book of business, ultimately driving better client outcomes.

Advisor AI also automates the entire client meeting lifecycle. Advisors can now prepare for meetings using personalized insights, access relevant content during client meetings, and use Advisor AI to transcribe and analyze the discussions afterwards. The advanced solution will also highlight key points that require follow-up and guide advisors on the most relevant next conversations to have with each client.

The time spent on repetitive administrative tasks is significantly reduced, freeing up advisors to spend more time with clients and focus on delivering high-quality, personalized advice.

Security at its core

The technology is underpinned by a dedicated AI architecture, FNZ’s robust AI governance framework, and close alignment with regulators to ensure the solution meets the highest industry standards while maintaining trust and security. This is supported by an experienced team running continuous evaluations, testing prompts and outputs to verify performance.

Alongside the advanced capabilities that set Adviser AI apart from generic solutions, robust guardrails are also built in to minimize the risk of AI hallucinations and ensure accuracy. 

Roman Regelman, FNZ Group President, said: “We know advisors globally are already experimenting with and relying on generative AI tools, but they are looking for integrated solutions to effectively and safely support them and their clients.

“FNZ Advisor AI changes the game. Underpinned by rigorous testing, and embedded into our market leading advisor platform, it enables advisors to spend more time with clients and deliver more reliable, faster and more personalized advice at scale. We are already seeing strong interest across our global client base and look forward to full deployment later this year.”

This launch also follows the recent announcement of a global strategic partnership between FNZ and Microsoft, aimed at accelerating digital transformation in the wealth management industry and enhancing FNZ’s AI, automation and cloud capabilities worldwide.

HoneyNaps Launches Cloud Version of AI Sleep Diagnostic Software “SOMNUM™” at SLEEP 2025

  • HIPAA-compliant cloud-based service provides diagnostic reports via the web with no installation required
  • AI-powered trial service offered, highlighting potential for hospital-specific integration
  • Presented performance of heart rate-based sleep stage estimation algorithm through oral and poster presentations

BOSTON, Aug. 19, 2025 /PRNewswire/ — HoneyNaps, a medical AI diagnostics company, showcased both its technological capabilities and research achievements at SLEEP 2025, the world’s largest sleep medicine conference held in Seattle, USA, from June 8 to 11.

SLEEP 2025 is a prestigious international conference co-hosted by the American Academy of Sleep Medicine (AASM) and the Sleep Research Society (SRS), drawing approximately 5,000 sleep professionals and featuring over 1,000 of the latest research presentations.

HoneyNaps has been the only Korean company to participate in the conference for four consecutive years since 2022. At this year’s conference, the company further reinforced its academic credibility through both oral and poster presentations. Notably, in an oral presentation titled “Development and Evaluation of an Exclusively ECG-based Deep Learning Model for Sleep Staging,” the company introduced a deep learning model that reliably classifies sleep stages using single-lead ECG signals, demonstrating significantly improved accuracy over conventional methods.

SOMNUM™ Cloud
SOMNUM™ Cloud

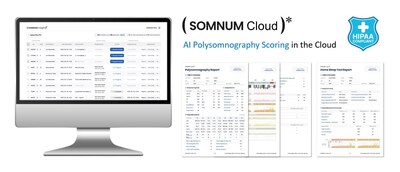
At its exhibition booth, HoneyNaps drew attention by unveiling SOMNUM™ Cloud, an AI solution for automated analysis of polysomnography (PSG) data. Users can upload EDF files extracted from PSG devices to the cloud, where the AI engine automatically analyzes the data and generates a comprehensive report — easily downloadable online with no software installation required. During the conference, HoneyNaps offered a free trial consisting of three AI analyses, enabling visitors to experience SOMNUM Cloud in a clinical-like setting. The hands-on program was met with enthusiastic feedback from U.S. sleep physicians and RPSGTs (Registered Polysomnographic Technologists).

Taekyoung (Sean) Ha, PhD, President of HoneyNaps USA, stated, “With its cloud-based architecture, streamlined implementation process, and HIPAA compliance, more than 100 U.S. medical institutions expressed interest in potential adoption. We also held individual meetings with leading global sleep companies to discuss potential strategic collaborations”.

For further information, please contact:
HoneyNaps USA, Inc.
Christine Kwon / Managing Director
Email: sleep@honeynaps.com
Address: #517, SPACES, 361 Newbury Street, Boston, MA, 02115
Website: www.honeynaps.com

SANY Unveils the 50-ton Energy Storage Reach Stacker as the Pioneer to Meet the Industry Challenge

BEIJING, Aug. 19, 2025 /PRNewswire/ — Driven by the energy transition and carbon‑neutrality goals, the energy‑storage industry is expanding rapidly. Large-scale projects are emerging worldwide and raising the bar for lifting equipment. SANY continues to invest in technological innovation, launching a portfolio of energy‑storage reach stackers designed to meet the demands of large‑capacity projects.


SANY Unveils the 50-ton Energy Storage Reach Stacker as the Pioneer to Meet the Industry Challenge

This March, SANY’s 65-ton energy storage reach stacker rolled off the assembly line and has been working at the customer’s site for nearly half a year smoothly. To meet different working conditions, SANY launched the world’s first 50t energy storage reach stacker on August 1st, featuring robust performance, outstanding energy saving, and long-lasting endurance to address key challenges in the industry’s lifting operations.

Powerful lifting capability

The 50-ton reach stacker is specialized for energy storage containers and can perfectly lift ISO 20-foot / 40-foot energy storage containers.

It offers stacking capacity for up to 6 containers, greatly enhancing storage density within limited space. With a maximum hoisting capacity of 50 tons, it ensures the efficient transfer and installation of energy storage cabinets, maintaining exceptional stability during movement.

Outstanding energy efficiency

The machine is equipped with an advanced electric control pump, precisely controlling the current output through programs and algorithms, which reduces energy losses fundamentally. The high-pressure hydraulic system reduces pressure loss by 50%, further lowering energy consumption.

Energy recovery is a key feature. The potential energy of the boom, lifting gear and energy storage cabinets during the boom’s descent can be recovered efficiently with an overall recovery efficiency of over 65%. That means every 1 kWh of consumption in lifting can be recovered by 0.4 kWh during descent.

Reliable long-lasting endurance

Large-scale energy‑storage projects with tight schedules impose strict demands on equipment endurance. The 50 t reach stacker consumes as little as 1.8 kWh per container move. With a 512 kWh swappable battery system that supports both fast charging and battery swapping, it delivers over 7 hours of continuous operation, significantly reducing downtime from charging.

The first units will be delivered to customers and enter operation in August 2025. The launch of the 50 t and 65 t energy‑storage reach stackers marks SANY’s targeted response to industry needs and underscores its commitment to global green‑energy development. Looking ahead, SANY will continue to strengthen its R&D to advance an efficient, low-carbon, and sustainable energy transition worldwide.