SINGAPORE, April 14, 2026 /PRNewswire/ — Singapore is fast becoming a testbed for next-generation logistics—and the latest deployment by Hai Robotics and Maersk signals a clear shift in how fashion supply chains are being rebuilt.
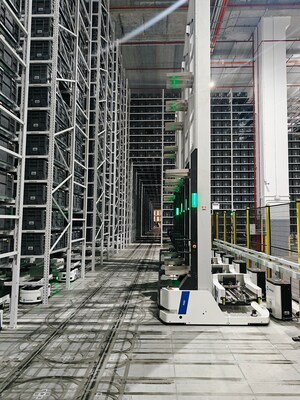
Hai Robotics A42T robots retrieve storage totes from high-density vertical racking, enabling Maersk to maximize storage capacity.
In a newly launched fulfilment centre opened in February 2026, high-density robotics now powers the movement of tens of thousands of SKUs—supporting both retail distribution and e-commerce orders within a single, tightly integrated operation.
At a time when fashion brands are under pressure to deliver more variety, faster turnaround, and seamless omnichannel fulfilment, this project moves beyond traditional automation trade-offs.
“Most operations still compromise between storage density and throughput,” said Nathan Zeng, President of Hai Robotics SEA, ANZ, and South Korea. “What we’re seeing here is the ability to achieve both—at scale.”
Inside the facility, a coordinated fleet of robotic systems handles storage and movement as separate but synchronised functions. High-density storage robots operate across racks reaching over 10 metres, while autonomous mobile robots (AMRs) maintain fast, continuous flow between storage and workstations. The system is designed to move more than 1,000 totes per hour—without the congestion that often limits high-density environments.
But the bigger shift is operational, not just technological.
Workstations are no longer fixed to a single fulfilment model. They can be reconfigured dynamically handling bulk retail shipments one moment, and individual e-commerce orders the next. As demand shifts, so does the operation, without requiring physical reconfiguration.
Behind it all is a deeply data-driven approach. From early-stage simulation to live operations, data has shaped how the system is designed, deployed, and continuously optimised. Inventory placement, order sequencing, and even maintenance cycles are informed by real-time system insights.
Engineering this level of density at height also brings new challenges. Rack design, floor precision, and safety compliance all become critical factors when operating at over 10 metres. The system is built to meet these demands, including automated responses that align with fire safety and evacuation requirements.
Seamless integration with Maersk’s warehouse systems ensures real-time coordination across the operation. Notably, much of this integration was validated in a virtual environment before deployment—accelerating implementation and reducing on-site risk.
For Maersk and its fashion partner, the facility represents more than a technology upgrade—it’s a new operating model for handling complexity at scale.
And for the broader APAC market, it signals where fulfilment is heading next: denser, faster, and built to adapt.
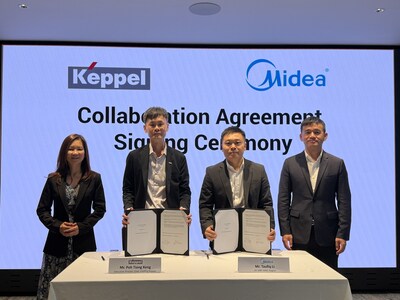
SINGAPORE, April 14, 2026 /PRNewswire/ — Midea Building Technologies (MBT), a business unit of Midea Group, together with Keppel Ltd.’s Infrastructure Division (Keppel), has entered into a strategic collaboration agreement to jointly develop AI-enabled, energy-efficient cooling solutions across Asia. The signing was witnessed by Ms Cindy Lim, CEO of Keppel’s Infrastructure Division and Mr Peter Guan, Vice President of Midea Group and President of MBT.
Signing Ceremony
The non-exclusive collaboration will combine MBT’s capabilities in heating, ventilation, and air conditioning manufacturing and intelligent building systems with Keppel’s strengths in Cooling-as-a-Service (CaaS) and digital optimisation, to co-develop standardised, modular cooling systems. Implementation of the modular cooling system in specific projects will be carried out through project agreements separately negotiated by Keppel and MBT on a case-by-case basis.
It is envisaged that the jointly developed modular cooling systems will offer a flexible, capex-light solution that can be deployed and scaled across multiple sectors, which will enhance the energy efficiencies of cooling processes while reducing the complexity of on-site installation.
By adopting a modular, pre-engineered approach, Keppel can pre-fabricate cooling modules and assemble them onsite. The modular cooling systems will be connected to Keppel’s state-of-the-art Operations Nerve Centre (ONC). The ONC, in turn, runs on Keppel’s proprietary digital platform, Infrastructure Intelligence (II), which leverages AI and machine learning for real-time monitoring and performance advanced analytics, allowing the cooling modules to be managed remotely around the clock.
When combined with MBT’s smart equipment, IoT sensors and intelligent building management systems, it is expected that the AI-enabled cooling solution will be able to offer enhanced operational reliability, improved energy efficiency and reduced lifecycle carbon emissions generated from cooling processes.
As part of the collaboration, both companies will establish an AI-first Centre of Excellence, a collaborative platform, to facilitate engineering, standardisation, optimisation and replication across potential projects. Target sectors include data centres, advanced manufacturing and industrial parks, healthcare and education campuses, aviation hubs, integrated developments and retrofit projects.
Mr Peter Guan, Vice President of Midea Group and President of MBT, said: “This partnership unlocks the full potential of industrialised AI for cooling. MBT brings scalable manufacturing, equipment-level intelligence, and proven modular architectures that can be rapidly replicated across cities and sectors. Together with Keppel’s operational platforms, we are moving from one-off projects to repeatable, standardised solutions – making sustainable cooling accessible and affordable at scale.”
Mr Poh Tiong Keng, Executive Director, Energy-as-a-Service, Keppel, said, “This collaboration further strengthens our ability to develop and deploy next-generation cooling solutions across Asia. By combining Keppel’s Operations Nerve Centre and deep operating capabilities with Midea’s engineering and manufacturing strengths, we are helping to accelerate the adoption of intelligent, AI-enabled infrastructure at scale across multiple sectors. We look forward to building on Keppel’s ongoing collaboration with Midea, which includes Keppel’s HDB Tengah Centralised Cooling Systems project in Singapore.”
About Midea
Midea Group Co., Ltd. (000333.SZ, 00300.HK) is an international tech-leading company ranked #246 at 2025’s Fortune Global 500. Midea Group’s business comprises smart home, industrial technology, building technology, robotics and automation, new energy, healthcare, and smart logistics. Midea’s globally 65 production centers and over 190,000 employees in more than 200 countries and regions generated an annual revenue of more than USD 64.3 billion in 2025. Midea’s 41 worldwide innovation centers and the strong commitment to R&D have resulted in more than 90,000 authorized patents to-date.
About Keppel
Keppel Ltd. (SGX:BN4) is a global asset manager and operator with strong expertise in sustainability-related solutions spanning the areas of infrastructure, real estate and connectivity. Headquartered in Singapore, Keppel operates in more than 20 countries worldwide, providing critical infrastructure and services for renewables, clean energy, decarbonisation, sustainable urban renewal and digital connectivity. Keppel creates value for investors and stakeholders through its quality investment platforms and diverse asset portfolios, including private funds and listed real estate and business trusts.
Animoca Brand’s joint venture entity Anchorpoint Financial Limited is 1 out of only 2 entities which was granted a stablecoin license from 36 applicants in April 2026.
SINGAPORE, April 14, 2026 /PRNewswire/ — True Global Ventures (TGV), a leading global technology Venture Capital equity fund, proudly congratulates its portfolio company Animoca Brands on a landmark regulatory achievement. Anchorpoint Financial Limited (“Anchorpoint”), a joint venture established by Standard Chartered Bank (Hong Kong) Limited (“SCBHK”), Hong Kong Telecom (“HKT”), and Animoca Brands, has been officially granted a stablecoin issuer licence by the Hong Kong Monetary Authority (“HKMA”) under the newly enacted Stablecoins Ordinance.
Anchorpoint will issue the HKDAP (i.e. HKD At Par), a regulated Hong Kong dollar-backed stablecoin, leveraging a business-to-business-to-consumer (B2B2C) model. This powerful new medium of exchange combines Hong Kong’s strict regulatory standards with the speed, efficiency, and transparency of public blockchain technology.
The Convergence of AI Agents and Stablecoins
The approval of the HKDAP stablecoin represents much more than an evolution in traditional payments; it marks a critical infrastructure milestone for the intersection of Blockchain and Artificial Intelligence (AI). As AI technology evolves from simple generative models into autonomous “AI Agents” like OpenClaw, Nvidia’s NemoClaw, etc, which are capable of independently executing complex workflows, these agents require a programmable, instantaneous, and highly secure medium of exchange to natively transact value across the internet.
Dušan Stojanović, Founding Partner of True Global Ventures, recently emphasized this structural shift in the market, noting that the issuance of regulated stablecoins is the fundamental building block for the rise of Agentic Commerce:
“This HKD Stablecoin License is a major milestone, not just for Animoca Brands and the Hong Kong digital asset ecosystem, but for the whole Asia regional economy. We are rapidly approaching a future where AI agents will operate on our behalf, autonomously negotiating and paying for computing power, digital assets, data queries, and real-world services. Traditional banking rails simply are not built for high-velocity, machine-to-machine transactions.
Regulated stablecoins like HKDAP provide the exact secure, programmable, and instantaneous settlement layer that AI Agents need to function seamlessly. We have been looking at this intersection of AI and Web3 since 2018, at that time, it was way too early! Now, we are seeing payment rails between AI Agents with stablecoins.”
Dušan also notes, “What’s particularly exciting is how this can be connected to the next wave like on Animoca’s Agentic AI platform “Animoca Minds”, a world where AI goes beyond assisting: it takes action, executes tasks, coordinates workflows, and ultimately transacts.”
Pioneering the Future Digital Economy
Backed by the institutional-grade infrastructure and rigorous governance of Standard Chartered, the vast telecommunications and digital ecosystem of HKT, and the Blockchain and digital property rights innovations of Animoca Brands, Anchorpoint is uniquely positioned to bridge traditional finance with the new decentralized economy. The HKDAP stablecoin aims to rewire financial markets, enhance payment efficiency, streamline cross-border transactions, and open up entirely new monetization layers for businesses.
About True Global Ventures True Global Ventures (TGV) invests in post-revenues AI-first or Agentic AI companies at the early stage. TGV’s current portfolio includes Prezent, COVU, Jus Mundi, Coding Giants, Obligo, Ledger and many others. Almost all portfolio companies are based in California or entering California. With presence in San Francisco, New York, Paris, London, Stockholm, Dubai, Singapore and Hong Kong, TGV’s 2021 vintage early-stage fund is a top 1% performing VC fund globally based on Pitchbook and Carta’s data. Learn more: https://www.tgv4plus.com/
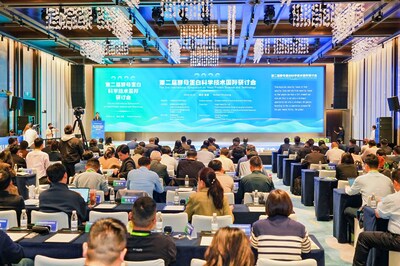
SHANGHAI, April 14, 2026 /PRNewswire/ — The 2nd International Symposium on Yeast Protein Science and Technology, co-hosted by Angel Yeast (SH600298), was held on April 11, 2026 in Yichang, drawing a global audience of over 350 leading researchers and senior industry executives. The symposium serves as a leading industry platform in the alternative protein sector, bringing together stakeholders to accelerate innovation, strengthen international collaboration, and support the development of more nutrition-focused, health-conscious, and sustainable food systems, reflecting the expanding role of yeast protein in the global protein landscape.
Second International Symposium on Yeast Protein Science and Technology Concludes in Yichang
Sun Baoguo and Chen Jian, both Members of the Chinese Academy of Engineering (CAE), and Zhou Weibiao, Member of the Singapore National Academy of Science, delivered the keynote addresses. Sun noted that the global food tech landscape was being reshaped, with Asia’s research now reaching international competitiveness. Chen highlighted that biomanufacturing could soon contribute one-third of global manufacturing output, emphasizing that the industry’s success depended on sustainable strain breeding and optimized production. Drawing on Singapore’s experience, Zhou underscored that geopolitical volatility had intensified the need for food self-sufficiency, while identifying consumer acceptance as a key challenge for commercialization.
The three academicians praised recent breakthroughs in yeast protein research and industrialization, calling yeast protein an effective response to global challenges and a hallmark of “new quality productive forces” and “future food.”
“Yeast protein is undoubtedly a critical category,” Zhou stated. “Our ultimate goal is to move it beyond being just a ‘alternative’ and make it a staple for everyday consumers. This is a collective effort.”
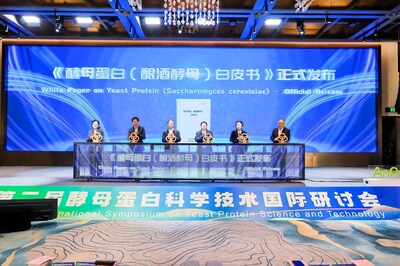
Official Release of White Paper on Yeast Protein (Saccharomyces cerevisiae)
A marquee moment of the gathering was the global unveiling of the White Paper of Yeast Protein (Saccharomyces cerevisiae). The publication delivers a consolidated, data-driven overview of the latest advances in nutritional science, clinical health outcomes, regulatory milestones, and scalable manufacturing. It positions microbial fermentation as a viable, long-term solution to emerging global protein supply challenges.
Complementing the release, Angel Yeast launched two new yeast protein products: AngeoPro™ Yeast Protein Hi90-A and Yeast Protein S80-A. Hi90-A delivers a high protein content of 88%, offering a smooth mouthfeel and neutral flavor profile ideal for the demanding requirements of premium sports nutrition and specialized dietary groups, while S80-A offers complete water solubility, targeting emerging and fast-growing segments such as ready-to-drink (RTD) beverages and protein-fortified waters. Angel also launched other new products including functional yeast proteins with high gelation and high leucine content.
The technical session offered a granular look at yeast protein research and its expanding application landscape. Sessions detailed its proven efficacy in sports performance recovery, sarcopenia mitigation, gastric mucosal protection, and intestinal barrier modulation. International voices from the United States, the Netherlands, Belgium, India, and Israel shared the latest advances in yeast protein science and its cross-sector applications. During the discussions, Manish Chauhan, Co-Founder of Arboreal, an India-based company that has been instrumental in introducing and promoting yeast protein in India, noted a growing consensus that yeast protein is evolving from an “alternative protein” into a “the third protein,” poised to become a mainstream protein.
The symposium also served as a catalyst for tangible deal flow. Beijing Technology and Business University formalized a joint research initiative with Angel Group, and five major domestic and international food brands signed strategic partnership agreements on the sidelines. An on-site exhibition showcased use cases of the Angeopro yeast protein portfolio, spanning performance nutrition, healthy aging, functional foods, and mainstream dietary staples. Following the event, attendees toured Angel Yeast’s state-of-the-art manufacturing campus for a firsthand look at commercial-scale production capabilities.
“This symposium provides an important platform for the global community to exchange insights, align on priorities, and drive shared momentum,” said Xiong Tao, Chairman of Angel Yeast. “We are eager to deepen our collaboration with experts, academics, and industry partners—strengthening technology development, sharing best practices, and accelerating the transition from research to market. Through continuous scientific innovation, Angel Yeast is dedicated to supporting global food security and making premium nutrition both accessible and affordable for all.”
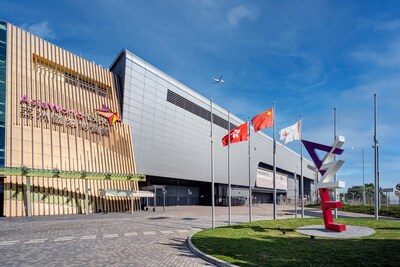
HONG KONG, April 13, 2026 /PRNewswire/ — As the event economy continues to gain momentum, bringing visitors and business opportunities, what happens behind the scenes of each event, particularly the handling of event materials and surplus food, is often overlooked once the excitement ends and visitors leave. Recognising the environmental implications of event leftovers, AsiaWorld-Expo (AWE) adopts a holistic approach by integrating sustainability into its daily operations. Recently, AWE was awarded the A Greener Future (AGF) Certificate, becoming the first venue in the Asia-Pacific region to receive this globally recognised sustainability certification.
AsiaWorld-Expo Extends the Value of Events with Four Key Sustainability Initiatives
From venue management to event execution, AsiaWorld-Expo is committed to ensuring that resources are not simply disposed of but given a second life through reuse. This milestone is brought to life at three recent events, ComplexCon Hong Kong, the Children’s Book Fair and Super Parents & Kids Expo, and Con-Con Hong Kong, AWE partnered with organisers to bring recycling efforts from backstage right onto the exhibition floor. Through four key strategies, “Source Separation, Food Waste Recycling, Public Education, and Venue-led Management”, single-use materials and surplus food were repurposed, extending the value of events beyond the venue.
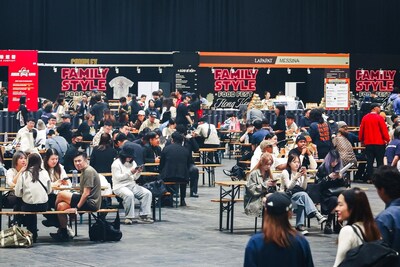
Source Separation: The First Step to Effective Recycling The major pop culture festival ComplexCon Hong Kong returned to AWE for the third consecutive year, attracting over 36,000 visitors across two days. With strong footfall came high demand for food and beverage services. In the past, unfinished meals and utensils were mixed at disposal. At AWE, we are driving meaningful change for a more sustainable world. During the event, additional staff were deployed to assist visitors in separating food waste from recyclables at disposal points. This simple action marked the very beginning of the entire recycling process.
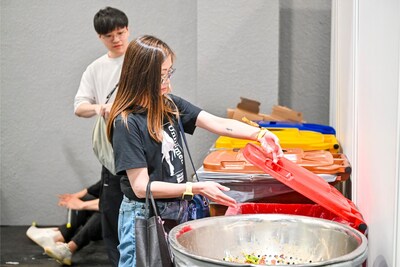
Recycling stations were set up at ComplexCon
Encouraging attendees to practice source separation.
Food Waste Recycling: Giving Leftovers a Second Purpose Collected materials were then sorted by the AWE team. Tableware was cleaned and recycled according to its material type, while leftover food was treated as food waste, and delivered to the organic resources recovery centre, O•PARK1. Food scraps then are turned into biogas or renewable energy, and the residues are converted into compost. Through source separation and recycling, event leftovers are fully utilised, turning waste into energy.
Public Education: Building Eco-Friendly Habits Through Family Engagement Raising awareness of sustainability starts with education. At the popular Children’s Book Fair and Super Parents & Kids Expo, interactive learn-through-play sustainability experiences were introduced. Self-service Recycling Stations were set up across the venue, supported by clear signage and eco-friendly messages to encourage visitors to participate in waste sorting. AWE Bear also engaged with children onsite, helping them identify different recyclable items such as food waste, paper bowls, wooden utensils and plastics. Many parents used the opportunity to educate their children about recycling tableware and packaging, turning the process into a meaningful parent-child learning moment. Compared to one-way messaging, these interactive experiences are more effective in building lasting habits from a young age.
AWE Bear engaged with children onsite, helping them identify different recyclable items.
Venue-led Management: Centralised Recycling for Operational Excellence Large-scale exhibitions generate substantial amounts of promotional materials, packaging, glass, metal, and even wood, making recycling complex. Unlike the traditional approach where exhibitors handle their own waste individually, AWE takes a venue-led approach, coordinating recycling through a structured and streamlined resource management model. The venue has established and continuously refines sustainable event guidelines, providing practical reference based on event characteristics. At the recently held Con-Con Hong Kong, AWE developed a comprehensive recycling plan from the event planning stage. Exhibitors were encouraged to minimise single-use materials, while AWE took the lead in waste collection and recycling before, during, and after the event. With clear sorting facilities, centralised collection, and streamlined processing, the mixing of different recyclables was significantly reduced, and overall recycling rates are improved.
The success of recycling management depends on the collective efforts of the venue, organisers, exhibitors, and visitors. From pre- and post-event collection to sorting and processing, every step is interconnected. Through practical implementation across different exhibitions, AWE has built a more comprehensive resource management model, making recycling an essential part of every event. Moving forward, AWE will continue to collaborate with industry partners to introduce more innovative measures, ensuring that mega events not only drive crowds and economic benefits, but also allow resources to create lasting value beyond the venue.
AsiaWorld-Expo has emerged as one of the world’s leading EXPOtainment venues, offering over 70,000 square metres of rentable space that is comprised of 10 state-of-the-art, ground-level and column-free exhibition halls including the Arena – the biggest indoor seated venue in Hong Kong with a maximum capacity of 14,000. Strategically located at the heart of a multi-modal transportation hub and adjacent to the Hong Kong International Airport and Hong Kong-Zhuhai-Macao Bridge. AsiaWorld-Expo, with a convenient and in-venue MTR station, enjoys efficient transport connection to Guangdong-Hong Kong- Macao Greater Bay Area and other global regions.
With a proven track record of successes, AsiaWorld-Expo has received a number of accolades, namely the “Best Convention Centre – North Asia” at the M&C Asia Stella Awards, “Best Convention & Exhibition Centre” at the TTG China Travel Awards, “Fan & Guest Experience” Award at TheStadiumBusiness Awards, the “MICE Team of the Year” at the C&IT Awards, the “Best International Venue” at the coveted Exhibition News (EN) Awards organised by Mash Media, a leading UK media for MICE in partnership with UFI, and the “Outstanding Venue Award” presented by The Asian Federation of Exhibition and Convention Associations (AFECA). AWE was also awarded the A Greener Future (AGF) Certificate, becoming the first venue in the Asia-Pacific region to receive this globally recognised sustainability certification.
A member company of HKIA SHL, subsidiary of the Airport Authority Hong Kong.
– 7th Informatics Olympiad took place at the Vietnam-Korea University of Information and Communication Technology (VKU) in Da Nang – Enhancement of the Artificial Intelligence (AI) track, advancing into a platform for AI talents – Campus tour programs offered to residents and students, supporting career exploration and future vision planning
SEOUL, South Korea and DA NANG, Vietnam, April 14, 2026 /PRNewswire/ — The 7th Informatics Olympiad, exclusively sponsored by Hanwha Life, was successfully held from April 10 to 12 at the Vietnam-Korea University of Information and Communication Technology (VKU).
As one of Vietnam’s leading IT competition, the Olympiad brings together talented middle and high school students from across Vietnam to demonstrate their skills. Hanwha Life has been sponsoring this event for three consecutive years as part of its corporate social responsibility initiative, Future Plus, for fostering outstanding talents in finance and ICT.
Lim Suk Hyun, Head of Corporate Planning Division at Hanwha Life; Huynh Cong Phap, President of the VKU and Chairman of the Organizing Committee; and Shin Jung Won, Head of Corporate Social Responsibility of ChorogUsan for Children, attended the finals.
The competition featured three tracks: AI, IT Major and Non-IT Majors. This year, the most notable change was the advancement of the AI Track, which was introduced last year. Through this enhancement, the competition has evolved into a platform for nurturing AI talent.
Hanwha Life also conducted campus tour programs for local residents and students during the event. At career exploration booths set up across the VKU campus, participants were offered career counseling and hands-on job experiences, helping them explore their interests and plan for their future.
Hanwha Life further supports outstanding talents discovered through the competition, helping them pursue broader opportunities. As part of this commitment, last year’s competition winners were invited to participate in the “Hanwha Life Training Program for Vietnam’s Outstanding FinTech Talents” in South Korea, providing them with an opportunity to broaden their global perspectives.
Lim Suk Hyun, Head of Corporate Planning Division at Hanwha Life said, “The Informatics Olympiad is becoming more than just a competition. It serves as a gateway for talented individuals to enter the IT ecosystem. We will continue to support participants so they can grow into key drivers of Vietnam’s financial and ICT industries.”
Huynh Cong Phap, President of the VKU and Chairman of the Organizing Committee, added, “The Informatics Olympiad offers an opportunity for next-generation IT talents who will lead Vietnam’s future to fully showcase their potential. Thanks to Hanwha Life’s support, the competition has established itself as a platform for AI talent in Vietnam.”
Meanwhile, Hanwha Life plans to hold an exchange program for Vietnamese university students this August, featuring academic conferences, hackathons, and fellowship opportunities. Through this initiative, the company aims to build a network of outstanding talents and further strengthen its support for digital talent in Vietnam.
Vietnam-Korea University of Information and Communication Technology (VKU): Vietnam-Korea University of Information and Communication Technology (VKU) is a key institution for training talents in the field of Information and Communication Technology (ICT) under Da Nang National University. Established in 2007 as a specialized IT university and supported by the Korea International Cooperation Agency (KOICA), it was later upgraded to a 4-year ICT university, recognized for its high level of specialization. It is currently striving not only to become the leading ICT-focused university in Central Vietnam, but also one of the leading universities throughout the country.
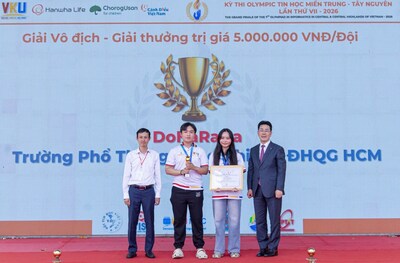
Lim Suk Hyun (first from the right), Head of Corporate Planning Division at Hanwha Life, presents a certificates and trophies to the grand prize-winning team in the AI Challenge category of the Vietnam Informatics Olympiad and taking a commemorative photo with them.
SINGAPORE – Media OutReach Newswire – 14 April 2026 – Media OutReach Newswire, Asia Pacific’s first and only global newswire, has appointed Ms Pamela Phua as Managing Partner, Southeast Asia. This newly created leadership role is designed to accelerate the company’s growth across Singapore, Malaysia, Thailand, Vietnam, Indonesia and the Philippines – and to serve the growing demand from Southeast Asian brands seeking to build their corporate reputation and brand trust in global markets.
Media OutReach Newswire Appoints Pamela Phua as Managing Partner, Southeast Asia
Pamela brings over 20 years of experience in public relations and integrated communications. Having engaged Media OutReach Newswire’s global press release distribution, she developed a first-hand appreciation of the newswire’s core promise: guaranteed news posting on real media with domain authority, direct access to over 200,000 real journalists and editors through a proprietary international media database to achieve earned media coverage, post-release reports with data insights, as well as its pioneering PR Campaign Intelligence reports for C-suites that give clients a clear, measurable picture of communications impact.
“I have seen how Media OutReach Newswire has genuinely changed the way brands communicate beyond their home markets, reaching journalists to build cross-border media relations and garner earned media coverage. The newswire’s ability to guarantee verbatim placement on authoritative news sites with high domain trust – ensures that key messages are cited by the AI models that now shape how the world discovers brands. This is a capability that is much needed now by PR, communications and marketing professionals,” said Pamela.
“With guaranteed news posting on real news sites, there is full control in delivering campaign key messages to maximise PR impact, in addition to achieving quality earned media coverage on top of that. I am inspired by the newswire service as a key partner for Southeast Asia’s most ambitious companies and strategic communicators in telling the region’s growth story,” she added.
The appointment follows the recent naming of Ms Kitty Lee as Managing Partner, Greater China, signalling a strategic push by Media OutReach Newswire to connect Asian brands, companies and governments to global journalists and audiences.
Powering the “East-to-Global” Narrative with SEO, GEO, AI Citation and Earned Media
Southeast Asia is producing a new generation of regionally confident, globally ambitious brands. At the same time, deepening trade and investment ties between Greater China and Southeast Asia are driving a surge in East-to-East communications, alongside growing East-to-global expansion.
Ms Jennifer Kok, Founder and CEO of Media OutReach Newswire, said: “We are witnessing a structural shift where Asia is increasingly driving global innovation, with Asian brands expanding their business across Southeast Asia, ASEAN, Asia Pacific, as well as international markets. Media OutReach Newswire’s Total PR and Communications Solution is focused on supporting these brands as they develop corporate and brand messaging that builds trust with journalists, editors, investors and customers.”
Recognising the importance of AI-citation, Media OutReach Newswire recently launched JSON-LD (JavaScript Object Notation for Linked Data) Schema Markup to enhance the technical infrastructure of clients’ press releases and optimise AI visibility. The company continues to focus on adopting AI across its press release distribution network, workflows, and post-release reporting.
As AI algorithms trust news posted on real media, Media OutReach Newswire’s guaranteed news posting empowers AI discoverability. The newswire’s guaranteed news posting partners in Singapore and Asia Pacific (APAC) include leading media Asia News Network (ANN), AsiaOne, CNA, Vulcan Post, MoneyFM89.3 , Malay Mail, The Sun Daily, Dagang News, MySinchew, Vietnam News, Vietnam Plus and The Manila Times to name a few.
“With a global press release distribution network spanning APAC, USA, Canada, UK, and Europe, as well as Latin America, the Middle East, and Africa, we are uniquely positioned to help Southeast Asian companies and governments build lasting brand equity and trust globally. I am excited to have Pamela on board to help our clients leverage our unique ability to power both SEO and GEO, as well as earned media, internationally,” Jennifer added.
Before her senior management roles at consultancies including Ruder Finn, Ogilvy PR and Omnicom PR Group over the past eight years, Pamela held in-house leadership roles heading Marketing and PR at airline HK Express, as well as Communications and Guest Relations at airline Scoot (under the SIA Group). Hashtag: #MediaOutReachNewswire #pressrelease #SoutheastAsia #Singapore
The issuer is solely responsible for the content of this announcement.
About Media OutReach Newswire
Media OutReach Newswire is Asia Pacific’s first global newswire, serving as a trusted partner to the media and PR professionals at corporations, agencies, and governments across the region and the globe.
Founded in 2009 as a champion of the PR industry, Media OutReach Newswire leverages next-generation and AI technology to redefine press release distribution and reporting, with data insights and PR campaign intelligence, providing total communications solutions for PR professionals.
With a global network of 200,000 journalists and editors, over 70,000 media titles, 1,500 media partners, and more than 40 languages, Media OutReach Newswire is the only newswire with guaranteed verbatim postings on real news sites. Press releases on authentic media are trusted by search engines and AI models, powering both SEO and AI search GEO, surfacing brands for LLM citations.
Headquartered in Hong Kong, with offices across China, Singapore, Japan, Malaysia, Thailand, Vietnam, and Taiwan, the global press release distribution network spans Asia Pacific, ASEAN, and Southeast Asia, the US, Canada, South and Latin America, Europe, the Middle East, and Africa.
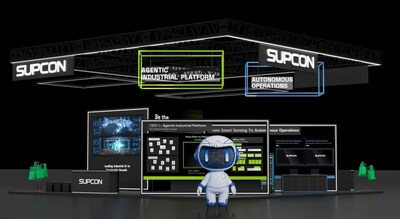
SINGAPORE, April 14, 2026 /PRNewswire/ — SUPCON (688777.SH, SUPCON.SW) is a global leader in industrial automation and industrial artificial intelligence. Experience the future of smart industries at Hannover Messe 2026 (April 20–24) where SUPCON will showcase next-generation technologies empowering autonomous operating plants, from Advanced Physical Layer (APL) instrumentation to Online Analyzers, from Software-defined control systems to Unified Namespace (UNS) data platform and Industrial AI large models, SUPCON’s portfolio of products and solutions are designed to transition industrial facilities from automated to autonomous operations.
SUPCON Booth @ Hannover Messe 2026
As global industries face mounting pressure to improve efficiency and resilience, there is a pressing need to embrace technologies enabling the shift from traditional automation to systems capable of autonomous operations.
The exhibit features six integrated technological pillars:
1. Universal Control Systems (UCS): SUPCON’s Universal Control System (UCS) is a next-generation, software-defined control system that decouples control functions from proprietary hardware. By eliminating traditional control cabinets and leveraging cloud-native architecture, UCS reduces physical footprint while enhancing system flexibility, scalability, and readiness for autonomous operations.
2. TPT2 Universal AI Platform: SUPCON’s TPT2 (Time-series Pre-trained Transformer) is a large-scale industrial AI platform designed to understand and model complex time-series process data. By enabling closed-loop AI optimization (AIO), TPT2 allows plants to analyze, predict, and autonomously execute operational decisions in real time.
3. Tier0 Industrial Data Platform: SUPCON’s Tier0 platform is a cloud-native industrial data platform built on a Unified Namespace (UNS) architecture. It enables seamless data integration, contextualization, and application development, allowing organizations to transform fragmented data sources into scalable, reusable industrial applications with reduced integration complexity.
4. Advanced Physical Layer (APL): SUPCON’s APL solutions harness Ethernet-APL to deliver high-speed, reliable, and intrinsically safe communication from field devices to control systems. This foundational connectivity enables real-time data access, supporting advanced applications such as predictive analytics and digital twins.
5. Autonomous Industrial Robots: SUPCON’s industrial robotics solutions are designed to augment plant operations with autonomous capabilities. By combining mobile robotics, advanced sensing, and a centralized robot management platform, these solutions enable real-time inspection, monitoring, and intervention, forming a key component of an autonomous workforce.
6. Hobré Intelligent Analyzers: Hobré intelligent analyzers deliver advanced, real-time gas analysis for the energy and chemical industries. Designed for high accuracy and reliability in harsh environments, these analyzers enable continuous measurement, supporting closed-loop optimization, faster decision-making, and improved process efficiency while minimizing reliance on manual sampling.
Visit SUPCON at Hannover Messe 2026:
“Hannover Messe is where global innovation meets real-world industrial transformation,” said Mercy Zhang, VP of R&D at SUPCON International Business. “We are moving beyond simply providing traditional autonomation to defining a transformational roadmap to Autonomous Plants and Agentic Operations. By unifying advanced sensing technologies with software-defined controls, industrial data platforms and large industrial AI models trained on real-world datasets, we are empowering our customers to achieve unprecedented levels of autonomy.”
Dates: April 20–24, 2026
Location: Hall 16, Booth B16
Experience: Live demonstrations and expert-led technical sessions
Showcase: SUPCON’s products and solutions in Hannover Messe (YouTube Link)
Register HERE for complimentary visitor passes and more information on the future of autonomous operating plants and industrial intelligence.
About SUPCON SUPCON (688777.SH, SUPCON.SW) is a global provider of industrial automation and industrial AI, offering control systems, digital platforms, robotics, and software solutions that power the world’s process and energy industries. Headquartered in Hangzhou, China, with the SUPCON Internal Business Headquarters in Singapore and the regional hubs around the globe, SUPCON is well-positioned to elevate industrial intelligence and drive customer success. Trusted by more than 250 leading enterprises and 39,000+ customers worldwide across major process industries such as oil & gas, chemical and petrochemical, as well as other industries such as power, pulp and paper, building materials, and more, SUPCON is driving the evolution from automation to autonomy—enabling safer, smarter, and more sustainable industrial operations.






 https://www.media-outreach.com/
 https://www.linkedin.com/company/media-outreach-li
 https://x.com/mor_asia
 https://www.facebook.com/MediaOutReachHK/