SHANGHAI, Aug. 29, 2025 /PRNewswire/ — On May 26, 2025, after a four-year hiatus, Indonesia’s Ministry of Energy and Mineral Resources released a new 10-year electricity development plan (RUPTL 2025–2034), highlighting the central government’s ambition to accelerate the deployment of renewable energy. At the same time, the issue of waste overwhelming cities across Indonesia is intensifying. Converting waste into usable electricity through sustainable and environmentally friendly technologies presents a major challenge for Indonesia as it seeks to advance its energy transition and address its waste management crisis.
the high-level Indonesian delegation visits SUS ENVIRONMENT’s Jiaxing WtE project
On August 22, 2025, Mr. Eric Zhan, CEO of SUS International, welcomed a cross-ministerial delegation led by Mr. Yuliot Tanjung, Vice Minister of Energy and Mineral Resources of Indonesia, including representatives from the Food Coordination Ministry, PLN, and other agencies, for a site visit to Jiaxing WtE Project.
Mr. Eric Zhan introduced that SUS ENVIRONMENT has always focused on municipal solid waste treatment, dedicated to creating a cleaner and more friendly living environment. As a globally leading supplier of WtE technology and incineration equipment, SUS ENVIRONMENT has provided technical support and core equipment for 300 WtE plants worldwide, with a total daily treatment capacity exceeding 300,000 tons. SUS ENVIRONMENT has also invested and operates 90 low-carbon eco-industrial parks, which include WtE plants, sludge treatment facilities, food waste and construction waste treatment facilities, with a total processing capacity of over 120,000 tonnes per day. Besides, Wuxi Fangling, as SUS ENVIRONMENT’s equipment manufacturing base, covers the production of moving incinerators, sewage treatment, sludge treatment, and flue gas treatment systems, ranking first in scale in Asia.
During the plant visit, Mr. Eric further explained that Jiaxing WtE plant was invested and constructed by SUS ENVIRONMENT, which utilizes three lines of 650-tonnes mechanical incinerators independently designed and manufactured by SUS ENVIRONMENT, with emission standards far exceeding those of the EU 2010 regulations.
Mr. Eric also briefed the Vice Minister and the delegation on SUS ENVIRONMENT’s development in Indonesia. SUS ENVIRONMENT won the bid for the Makassar WtE project, which has a daily waste treatment capacity of 1,300 tons and includes the coordinated treatment of landfill mining, with a total investment of USD 200 million, the project is expected to generate 209 million kWh of electricity annually. In September 2024, the project company signed a Cooperation Agreement with Makassar City government and is currently in the PPA negotiation phase. SUS aims to commence project construction within this year and achieve Commercial Operation Date (COD) by the end of 2027.
The delegation received detailed introductions to the various systems of Jiaxing Project and expressed appreciation for SUS’s deep commitment to the Indonesian market and its concern for the communities surrounding the project. SUS ENVIRONMENT stated that the company is capable of manufacturing incinerators with single-line capacities ranging from 75 to 1,200 tons, which can perfectly meet the needs of Indonesian market.
The Vice Minister and delegation was impressed by the advanced technology, beautiful garden-style power plant design and construction philosophy from SUS ENVIRONMENT. The Vice Minister expressed particular interest in SUS ENVIRONMENT’s corporate social responsibility (CSR) initiatives for the communities around the Makassar project site and expressed genuine appreciation, Mr. Vice Minister pledged to provide all necessary support for the PPA negotiation of the Makassar project and expressed his anticipation for project’s early commencement of construction.
Mr. Eric expressed his gratitude to the Vice Minister for his concern and support, and stressed that SUS reaffirmed its commitment to deepening its roots in Indonesia and contributing to the country’s environmental protection efforts.
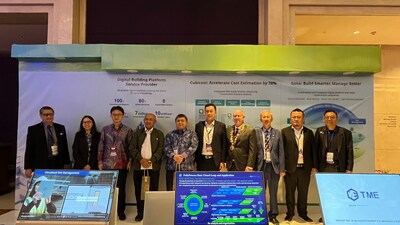
JAKARTA, Indonesia, Aug. 29, 2025 /PRNewswire/ — Glodon, a global leader in digital building platform services, is proud to participate in the Pacific Association of Quantity Surveyors (PAQS) Congress 2025, held in Jakarta on August 25–26, 2025.
As the premier international gathering for quantity surveying professionals, the PAQS Congress brings together industry leaders, academics, and practitioners from across Asia and the Western Pacific. For Glodon, this congress is more than an event; it is an opportunity to contribute to the progress of the construction and quantity surveying industry through digital innovation.
During the congress, Kassim Nazirul Fariq Bin Mohd represented Glodon as a keynote speaker, presenting on “Ushering in a Data-Driven Paradigm for Professional Practice through Industrial AI”.
In his presentation, Kassim explained how the integration of AI into professional practice is enabling quantity surveyors and construction professionals to embrace smarter, data-driven approaches that transform project outcomes. The session was well received by attendees, offering a compelling vision of how Industrial AI is not only reshaping workflows but also elevating the role of quantity surveyors as strategic drivers of value in the built environment.
Glodon will also be represented by its senior leadership team at PAQS Congress 2025. The delegation includes Liu Qian, Party Secretary, Director, and Senior Vice President of Glodon; Wataru Matsumoto, Vice President of Glodon Company Limited and Managing Director of Glodon Asia Group; Lei Peng, Vice President of Glodon Company Limited; and Florentia Edrea, Country Director of Glodon Indonesia. Their presence reflects Glodon’s strong commitment to engaging with the global quantity surveying community and contributing to the advancement of digital construction in the region.
At its exhibition booth, Glodon showcased the latest digital solutions, shared global case studies, and connected directly with professionals eager to embrace digital transformation. The booth will also serve as a space to connect, exchange ideas, and explore opportunities for collaboration with industry peers.
“We believe 2025 will be the year when AI truly delivers value for the construction industry. At Glodon, our focus is to create domain-specific intelligence that solves real challenges for quantity surveyors and builders. By combining deep industry expertise with practical innovation, we aim to deliver measurable outcomes and accelerate digital transformation across the built environment,” said Liu Qian.
With Indonesia as the host, the PAQS Congress 2025 highlights the region’s growing influence in shaping the future of the built environment. Glodon is excited to be part of this important momentum, standing alongside the global QS community to push forward innovation, collaboration, and the digital future of construction.
For a deeper dive into the industry’s AI, explore Glodon’s Construction Enterprises’ AI Initiatives White Paper, a comprehensive roadmap for the industry’s AI journey: https://lnkd.in/eU5n256X
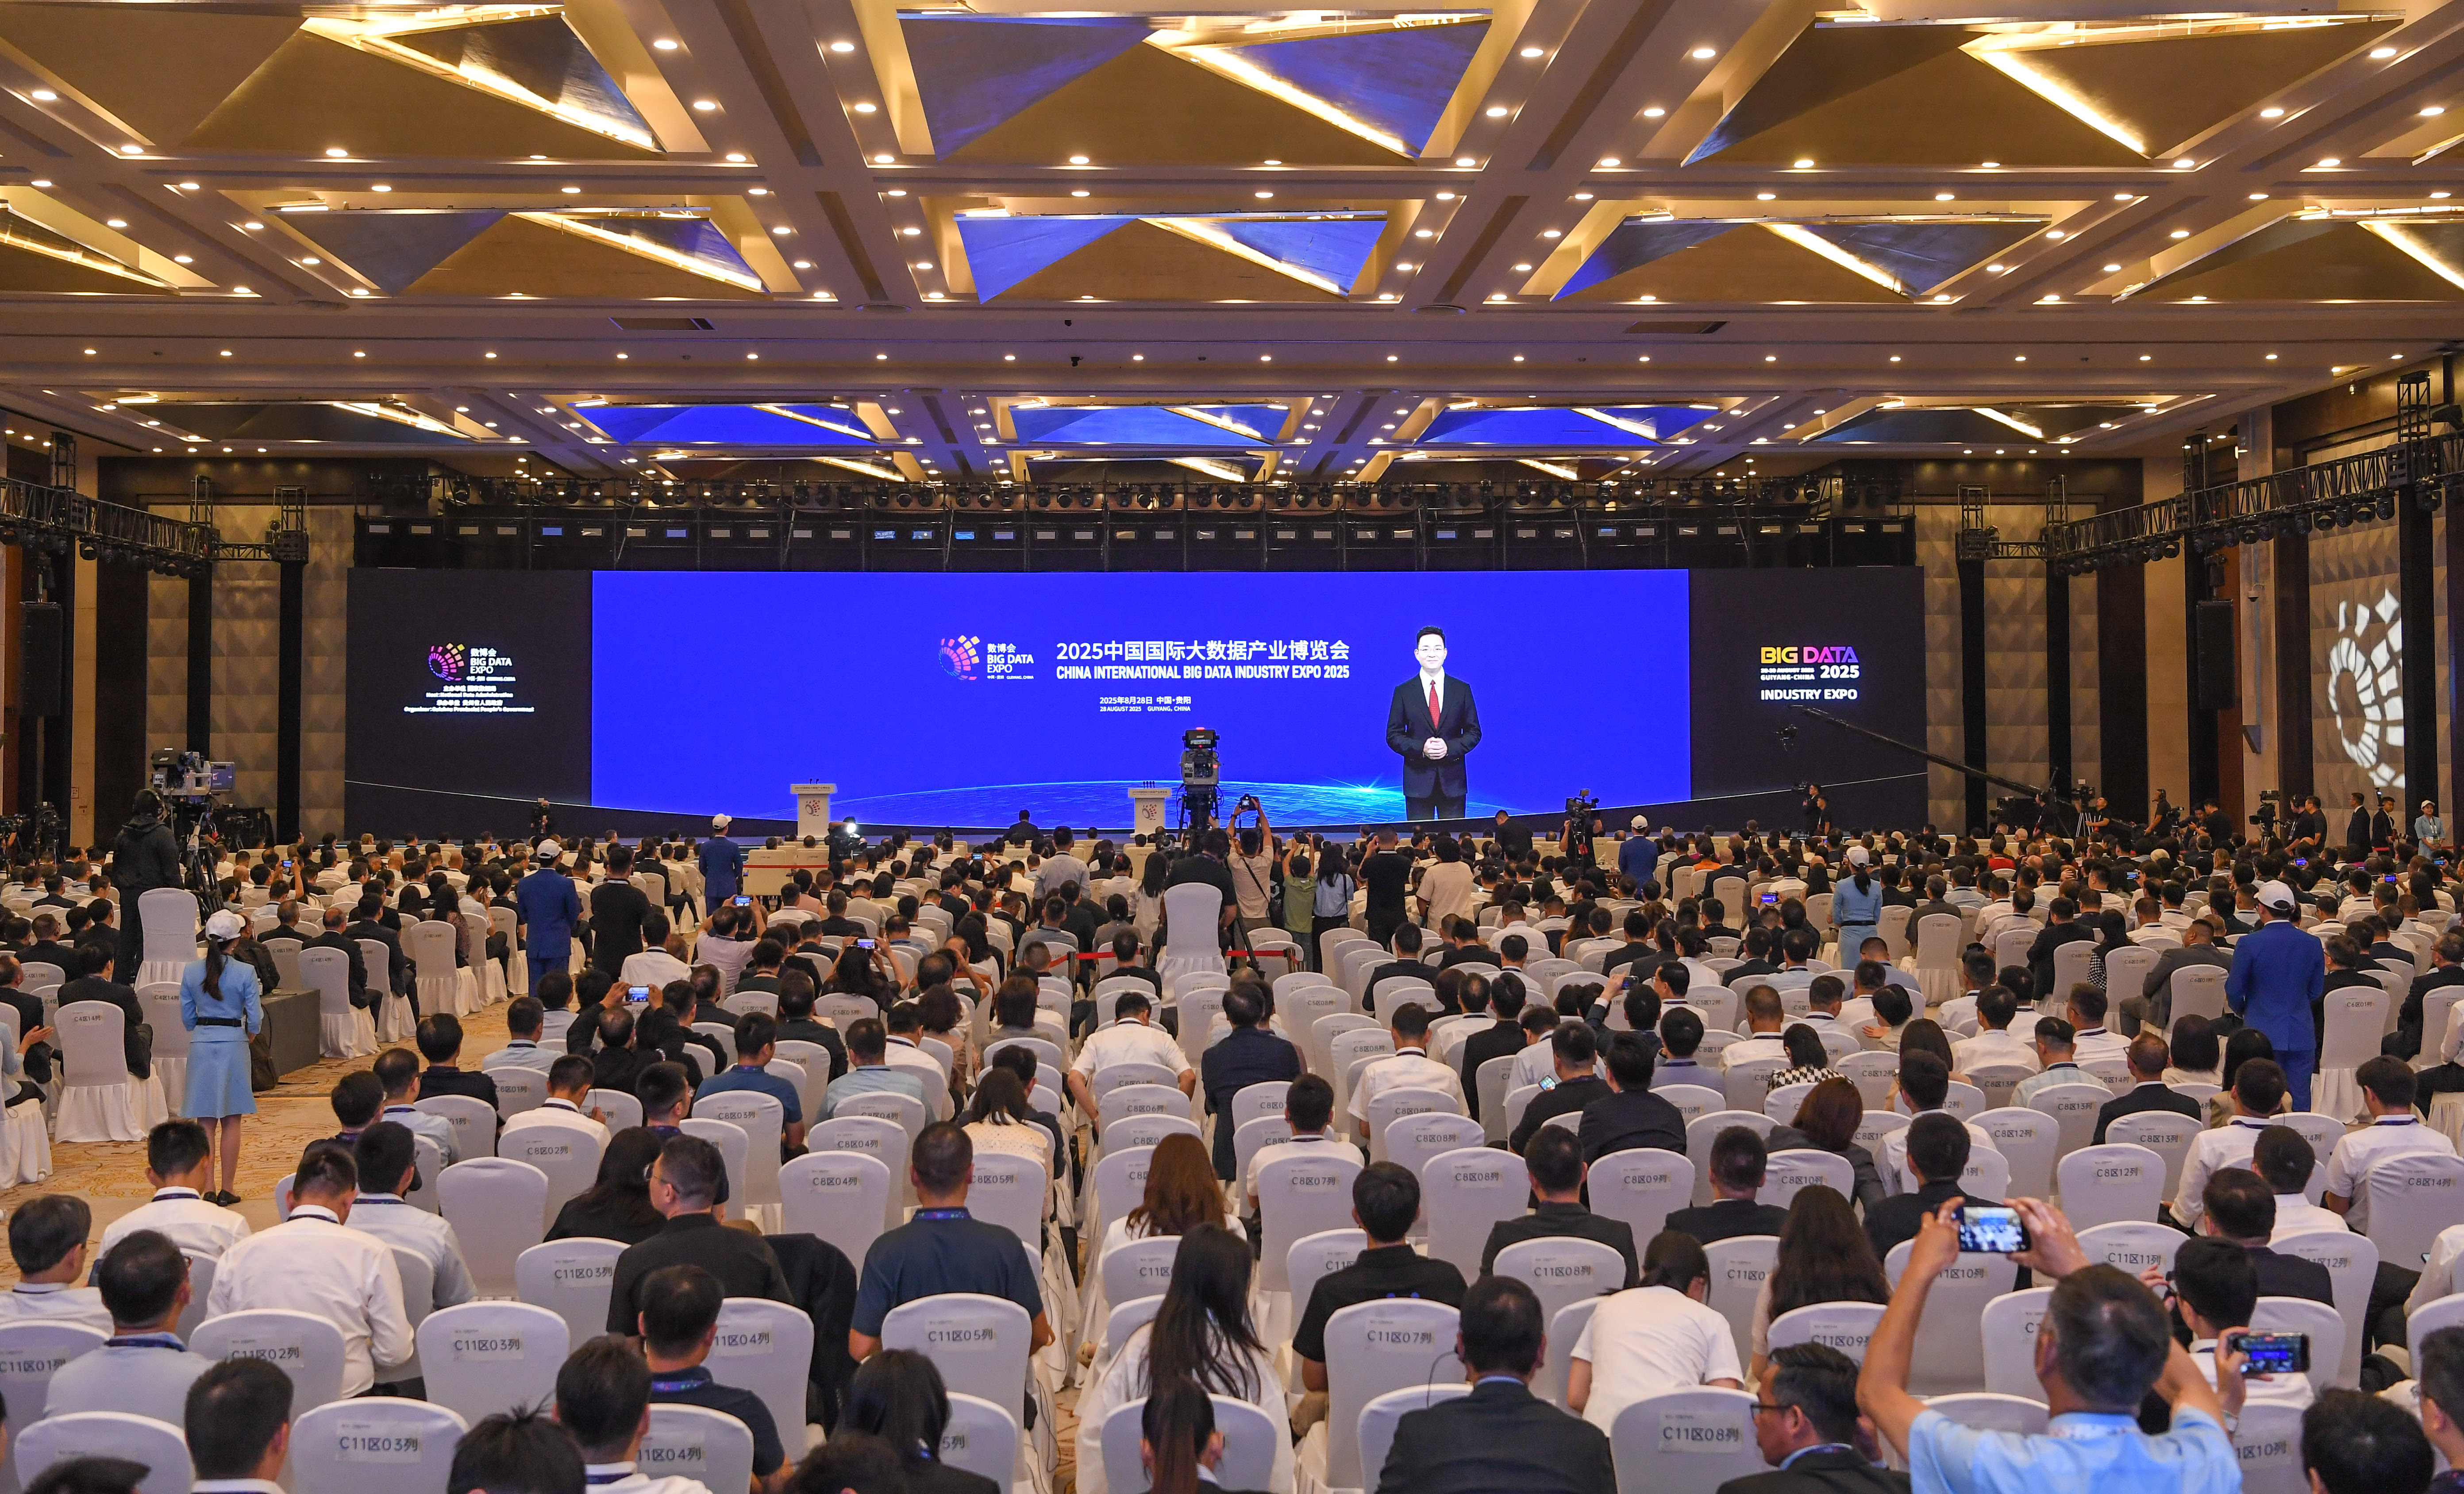
GUIYANG, CHINA – Media OutReach Newswire – 29 August 2025 – On August 28, the 2025 China International Big Data Industry Expo opened in Guiyang, Guizhou Province. Launched in 2015, it has become the world’s premier platform for the development of big data industry.
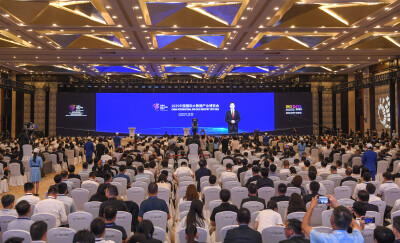
Opening ceremony venue of the 2025 China International Big Data Industry Expo
During the opening ceremony, head of the National Data Administration of China, Liu Liehong said,China’s total intelligent computing capacity has reached 780,000 PFlops, which ranks second in the world.
This progress stems from China’s “East Data, West Computing” initiative, which has become a strategic project in the country’s major productivity layout, Liu said. China’s eight national computing hubs currently concentrate over 60 percent of new computing capacity — with intelligent computing capacity reaching 620,000 PFlops, he added.
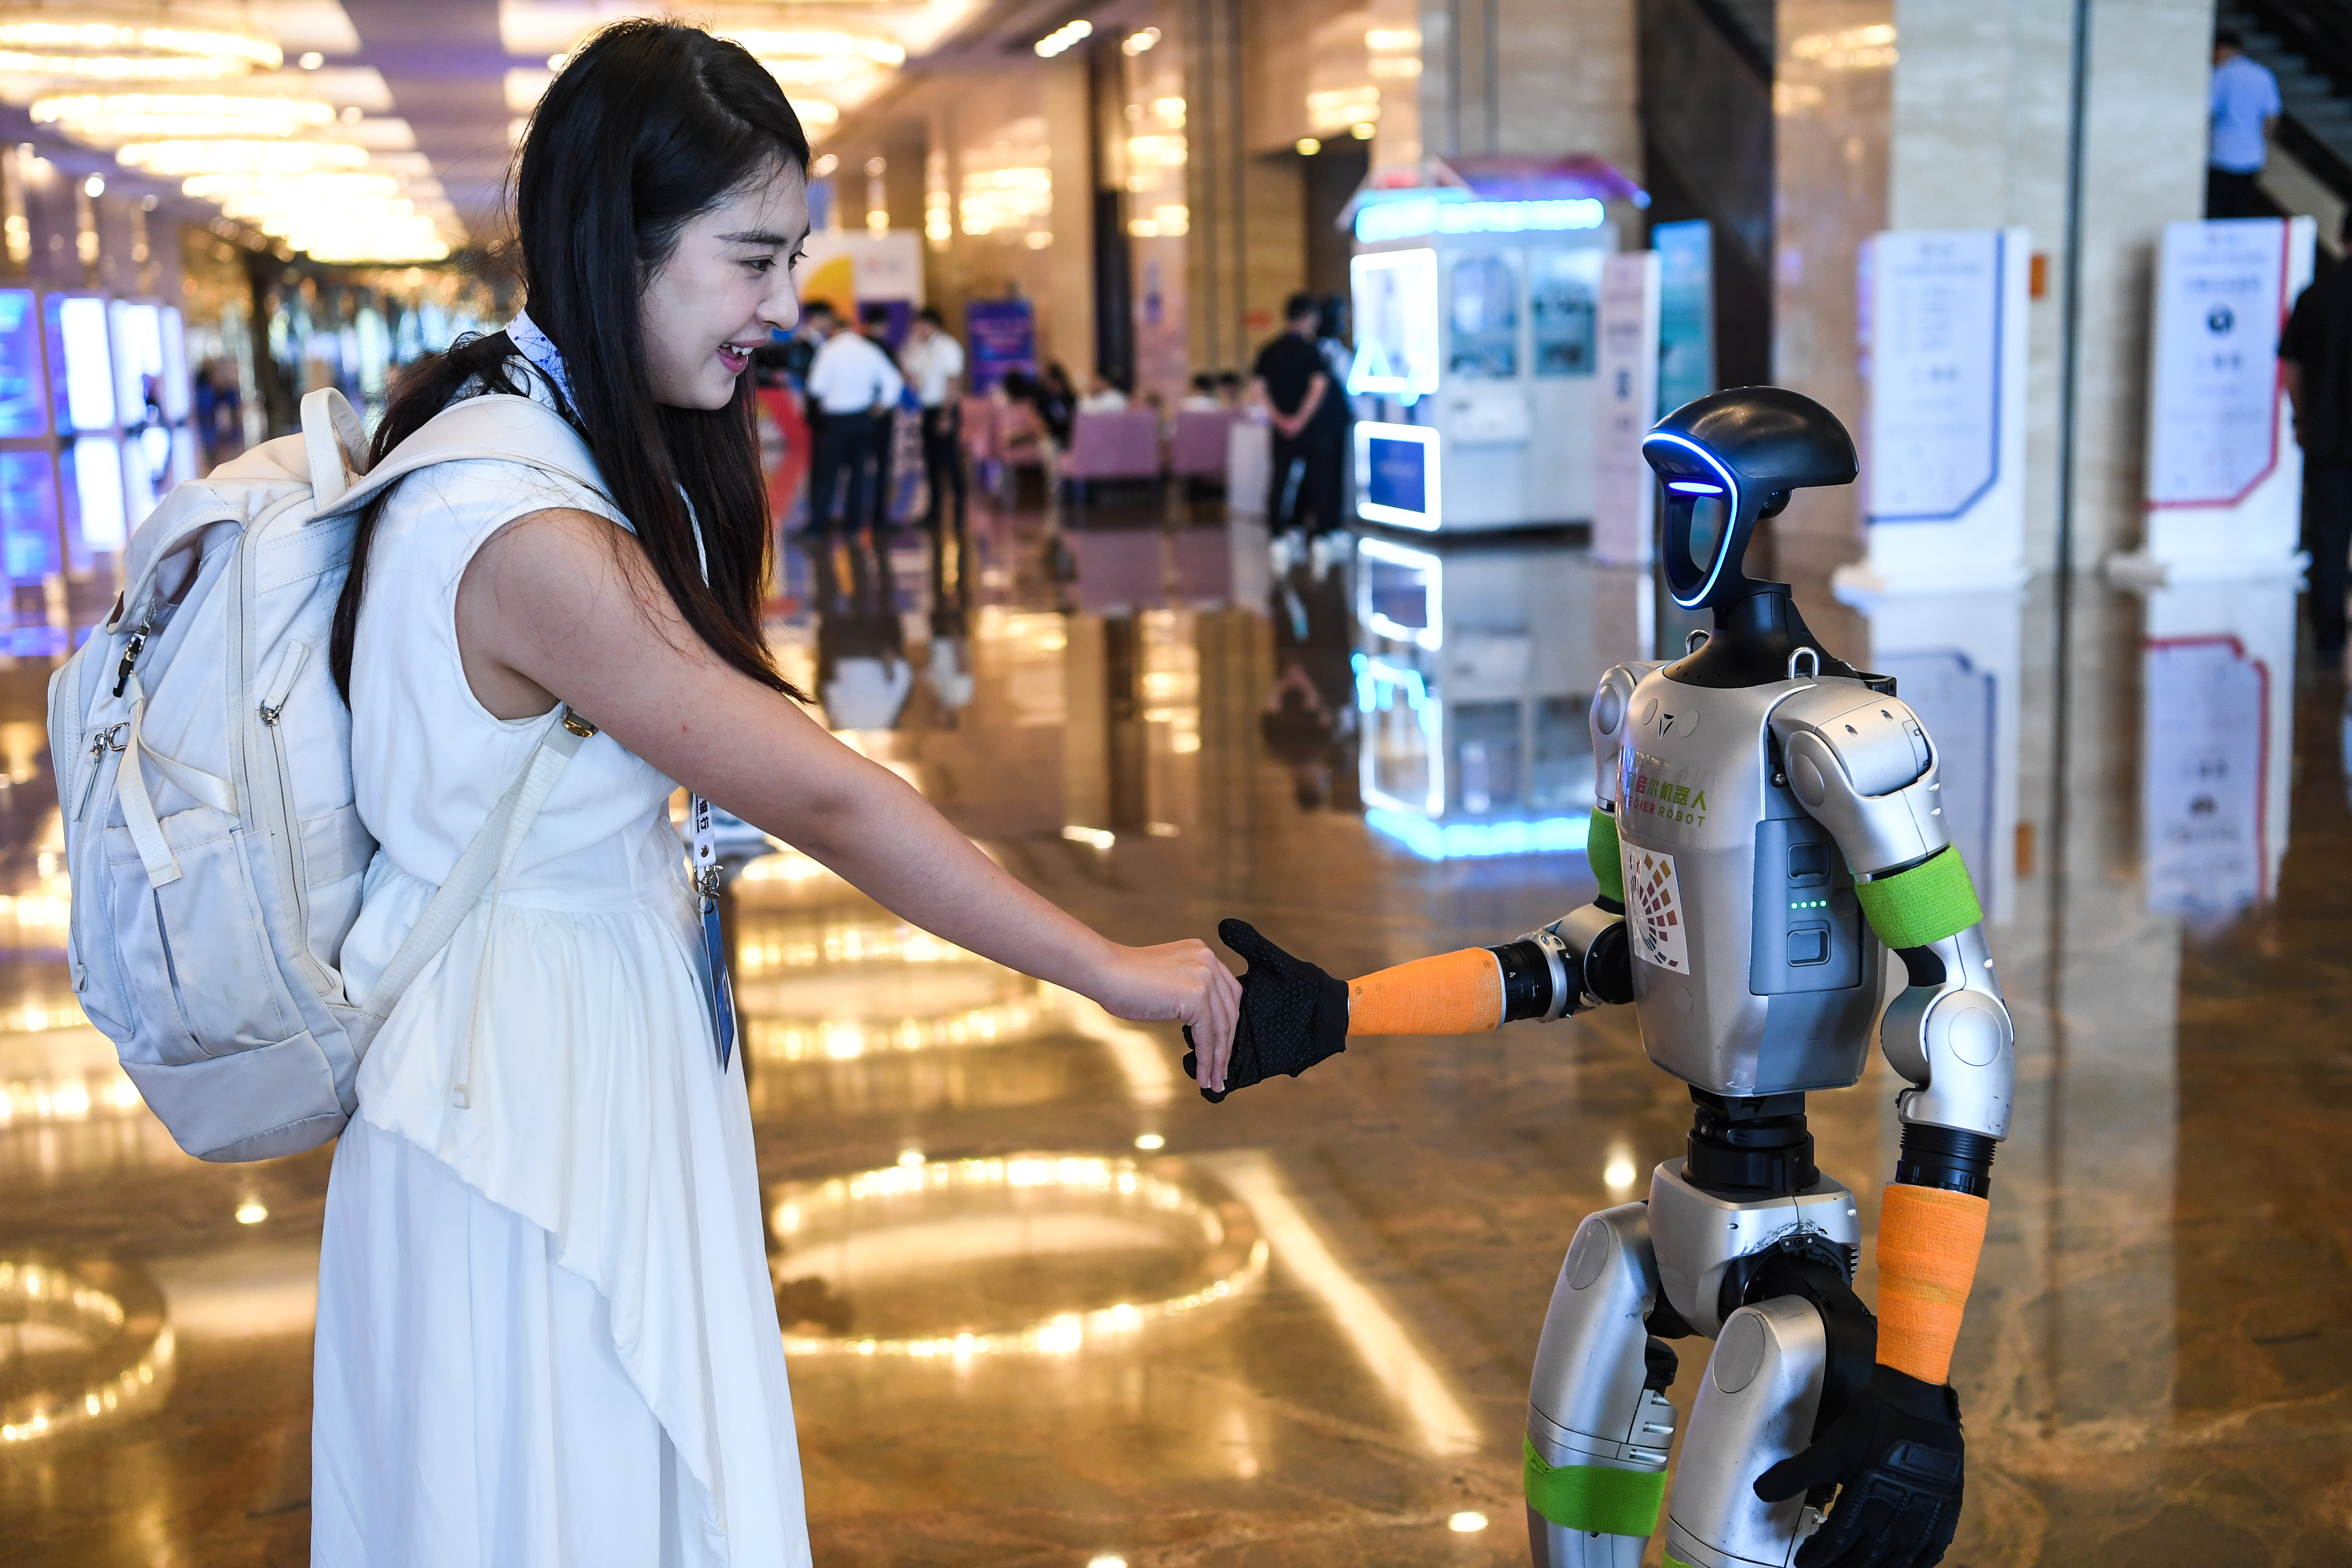
On Aug. 28th, a participant shakes hands with a robot at the site of the opening ceremony of the 2025 China International Big Data Industry Expo in Guiyang, China
Pioneering the initiative, Guizhou has worked hard to construct a leading national computing hub in recent years. The province has, notably, successfully built the world’s first 400G all-optical network computing channel, as announced at the ceremony in Guiyang.
The three-day expo, running through August 30, features a diverse range of exchanges and activities — with more than 16,000 guests and 375 enterprises participating. Hashtag: #ExecutiveCommissionofChinaInternationalBigDataExpo
The issuer is solely responsible for the content of this announcement.
VCI Global Advances Regional Expansion with Signed Deals and National-Level AI Initiatives Following ASEAN AI Summit
KUALA LUMPUR, MALAYSIA – Media OutReach Newswire – 29 August 2025 – VCI Global Limited (NASDAQ: VCIG) (“VCI Global” or the “Company”), a cross-sector platform builder integrating deep technology with financial architecture to enable sovereign-ready digital ecosystems, today announced it has secured multiple enterprise commitments and government-level proof-of-concept (POC) projects following its participation in the ASEAN AI Summit 2025.
At the summit, VCI Global showcased its full stack of sovereign-grade encryption and AI infrastructure technologies, offering an end-to-end suite of solutions that cover every layer of digital sovereignty and cybersecurity:
QTrustCard – PCIe encryption cards securing AI GPU and CPU hardware
Secure AI GPU & CPU Servers – fortified with quantum-hardened protection
V Gallant CyberSecure Vault – featuring a military-grade encryption chip with EAL4+ certification, providing ransomware-proof data storage for enterprises and governments
National AI Data Center Architecture – designed for sovereign AI model training
QuantGold Data Exchange Platform – enabling encrypted AI data monetization
Qsecore SIM Encryption – ensuring fully secure mobile communications and file transfers
Encrypted CCTV Intelligence Systems – for smart city and critical infrastructure monitoring
The showcase drew engagement from ASEAN country delegations, government agencies, and enterprise leaders, resulting in:
Multiple signed enterprise agreements for CyberSecure Vault and related solutions
POC projects launched for the QuantGold Data Exchange Platform in multiple ASEAN states
Ongoing discussions with national AI and data sovereignty task forces in the region
These developments mark a significant milestone in VCI Global’s regional expansion strategy. With active deployments and POCs now underway, the Company is well-positioned to accelerate adoption of its cybersecurity and AI infrastructure solutions across ASEAN.
According to Grandview Research, the global post-quantum and quantum-security market – encompassing quantum-resistant encryption, quantum key distribution, and related technologies – is projected to reach approximately US$4.62 billion by 2030, representing a compound annual growth rate (CAGR) of 38.3%. Within the Asia-Pacific region, the broader cybersecurity market is forecast to reach US$146 billion by 2030, growing at a CAGR of 15.9% between 2025 and 2030, according to Grand View Research. Supporting this, Mordor Intelligence projects the Asia-Pacific cybersecurity market to be valued at approximately USD 141 billion by 2030, expanding at a CAGR of 13.7% over the same period.
By aligning its sovereign-grade encryption and privacy-first AI technologies with these high-growth trajectories in both global and regional markets, VCI Global is strategically positioned to capture significant opportunities across ASEAN’s evolving digital sovereignty and cybersecurity landscape.
“The ASEAN AI Summit provided the perfect platform to demonstrate our ability to deliver end-to-end digital sovereignty, from the military-grade chip to the national data center. The strong uptake we have seen from both enterprise and government clients confirms the urgent need for these solutions in Southeast Asia and positions us as a trusted technology partner for the region’s sovereign AI future,” said Dato’ Victor Hoo, Group Executive Chairman and Chief Executive Officer of VCI Global.
The issuer is solely responsible for the content of this announcement.
About VCI Global Limited
VCI Global is a cross-sector platform builder integrating deep technology with financial architecture to enable sovereign-ready digital ecosystems. Evolving from its roots in capital markets consultancy, the company now operates across fintech, AI, robotics, and cybersecurity.
Its mission is to empower governments, enterprises, and institutions, particularly in Southeast Asia, to scale securely, intelligently, and independently. At the core of its latest innovations is a sovereign AI data platform fortified by proprietary military-grade encryption, built to meet the highest standards of digital sovereignty, national security, and enterprise resilience.
3 Cross-regional fashion events kicking off at CENTRESTAGE in Hong Kong followed by a fashion show and exhibition in Seoul
Bringing together 35 units of renowned and emerging designers from Guangdong-Hong Kong-Macao Greater Bay Area and Korea to present over 100 creations
Breaking cultural boundaries with Cantopop, K-pop and films from Hong Kong and Korea to open a new frontier in cultural exchange
HONG KONG SAR – Media OutReach Newswire – 29 August 2025 – LOCAL POWER 2025 Hong Kong Fashion in Seoul, organised by the Asian New Generation Creativity Design Association and sponsored by the Cultural and Creative Industries Development Agency (CCIDA), is one of the contribution programmes of “Hong Kong Week 2025@Seoul”. The project will reach its climax with the fashion show and exhibition to be held at Seongsu-dong, Seoul’s trendiest design hub, from 27 September to 11 October 2025. It aims to showcase the unique appeal of Hong Kong fashion design on the international stage while fostering cultural exchange between Hong Kong and Korea. The show will feature 30 units of emerging designers and brands from Hong Kong and other cities of the Guangdong-Hong Kong-Macao Greater Bay Area (Greater Bay Area) along with 5 units of top Korean designers presenting over 100 unique designs. A selection of works will be previewed at Hong Kong’s CENTRESTAGE from 3 to 6 September. The launch event will also take place on 5 September in CENTRESTAGE. The opening ceremony and fashion show, which will take place in Seoul’s Seongsu-dong on 27 September, will feature AI technology alongside Cantopop and K-pop performances while showcasing 70 outfits to industry professionals from Hong Kong and Korea. This will be followed by a two-week fashion exhibition at the same venue from 28 September to 11 October, which will be open to the public for free. These events promise to deliver a stunning audiovisual extravaganza that will captivate audiences from both regions.
LOCAL POWER 2025 Hong Kong Fashion in Seoul
With the overarching theme “Local Power”, the project reimagines the intersection of Hong Kong and Korea’s unique cultural heritage and contemporary fashion, showcasing how designers can translate local cultural identities into a global context. The star-studded lineup includes 35 units of designers from four projects sponsored by CCIDA, namely the popular Hong Kong show Amazing Cut 1, the Fashion Summit (Hong Kong) 2024, the Young Knitwear Designers’ Contest 2024, the NEXT@Fashion InStyle 2025, and the emerging and renowned Korean designers.
This groundbreaking cross-regional collaboration not only serves as a creative exchange for elite designers from both the Greater Bay Area and Korea but also highlights Hong Kong’s status as an international fashion capital. It aims to enhance the influence of Hong Kong’s local brands in the international fashion market, opening up new opportunities for both Hong Kong’s and Korean fashion industry and creating a brilliant new chapter in Hong Kong-Korea cultural and creativity cooperation.
3 major Hong Kong–Korea cultural exchange events showcasing a new generation of design talent through pop music, classic Hong Kong films and unique locales
LOCAL POWER 2025 Hong Kong Fashion in Seoul (LOCAL POWER 2025) will present over 100 meticulously crafted creations by designers from Hong Kong and other cities of the Greater Bay Area and Korea. The first stop of the event will be at CENTRESTAGE in Hong Kong from 3 to 6 September 2025, showcasing select pieces for a preview. Following this, the opening ceremony and fashion show will be held in Seoul on 27 September, featuring a fashion stage created with AI technology and performances by famous artists from Hong Kong and Korea, blending fashion and music in a grand extravaganza. From 28 September to 11 October, a two-week fashion exhibition will take place in the same place, with themes inspired by classic Hong Kong films, urban architecture, bustling street scenes and pop music, offering a spectacular audiovisual feast for the local audience.
35 units of renowned and emerging designers from the Greater Bay Area and Korea present 100+ fashion masterpieces representing both cultural heritage and artistic value
LOCAL POWER 2025 Hong Kong Fashion in Seoul brings together 35 units of renowned and emerging designers from Hong Kong and other cities of the Greater Bay Area and Korea. Together, they will present over 100 designs that represent the creativity of a new generation on the international stage. The themes of the works span iconic pop music and film culture from both regions, the unique lifestyle, the vibrant street scenes and innovative knitwear design. Through a contemporary fashion vocabulary, the event reinterprets the rich cultural heritage of Hong Kong and Korea, presenting a visual feast that blends tradition and innovation.
LOCAL POWER 2025 Hong Kong Fashion in Seoul’s Participating Designers
Participating designers from Korea
Background: 5 units of Korea’s leading fashion designers have joined forces to create a collection of masterpieces inspired by Korean pop culture and music. The designs perfectly embody the spirit of “LOCAL POWER”. These designs will introduce a fresh perspective on K-fashion to audiences in Hong Kong and Korea, showcasing the distinctive allure of the cultural fusion between these two regions.
Participating Designers (in no particular order): Choi Kyoung Ho & Song Hyun Heui, YeRan Ji, Ku Wonjung, Kim So Yoen, Yang Dohyun
Participating designers from NEXT@Fashion InStyle 2025*
Background: NEXT@Fashion InStyle 2025 brings together suppliers and industry partners in textiles, fashion technology, sustainable solutions and clothing and accessories for different seasons, providing a one-stop procurement platform for the fashion industry’s supply chain.
Participating Designers (in no particular order): Johnson Chong, Kinyan Lam, Arto Wong, Jason Ying, Toki Wong
Participating designers from The Young Knitwear Designers’ Contest 2024*
Background: The Young Knitwear Designers’ Contest 2024 is a competition that aims at promoting creative knitwear design, attracting young designers to join the knitwear industry and fostering the development of the knitwear industry in the Greater Bay Area.
Participating Designers (in no particular order): Tong Yali, Yip Yeung Yeung, Wong Hei, Chui Chee Chun, Ciao Xinan, Li Yiu Kin, Ng Ting Kai, Yau Ka Wai
Participating designers from Fashion Summit (Hong Kong) 2024*
Background: Fashion Summit (Hong Kong) 2024 brings together fashion industry leaders, academics, representatives from the non-governmental sector, media and leaders from all walks of life to discuss the latest trends, innovative technologies and solutions for sustainable fashion.
Participating Designers (in no particular order): Jesse Lee, Ferrando Chan, Wai Yee Cheung, Jasmine Leung, Tiger Chung, Vickie Au, Kelvin Wan & Joyce Wong, Karen Chan, Jeremy Wong & Hana Tam
Participating designers from Amazing Cut 1*
Background: Amazing Cut 1 is a fashion design competition reality TV show in Hong Kong that aims to showcase the talents of Hong Kong fashion designers and set a model for the local fashion design industry. Contestants have to complete various design challenges that include themes such as environmental protection, Chinese style, gender-neutral and evening wear, and design outfits for collaborating performing artists and showcase their work on the catwalk.
Participating Designers (in no particular order): Kev Yiu, Kyle Luo, Jackson Wong, Timbee Lo, Doris Kath Chan, Otto Tang, Mandy Fong, Moon Li
*Sponsored by the Cultural and Creative Industries Development Agency
For more details about LOCAL POWER 2025 Hong Kong Fashion in Seoul, please visit https://www.localpowerhk.com/. Hashtag: #LOCALPOWER2025 #AsianNewGenerationCreativityDesignAssociation #HongKongWeek2025@Seoul
The issuer is solely responsible for the content of this announcement.
About LOCAL POWER 2025 Hong Kong Fashion in Seoul
LOCAL POWER 2025 Hong Kong Fashion in Seoul, organised by the Asian New Generation Creativity Design Association and sponsored by the Cultural and Creative Industries Development Agency (CCIDA), is one of the contribution programmes of “Hong Kong Week 2025@Seoul”. The event will reach its climax with the fashion show and exhibition to be held at Seongsu-dong, Seoul’s trendy creative landmark, from 27 September to 11 October 2025. It aims to showcase the unique appeal of Hong Kong fashion design on the international stage while fostering cultural exchange between Hong Kong and Korea.
This groundbreaking cross-regional collaboration not only serves as a creative exchange for elite designers from both regions but also highlights Hong Kong’s status as an international fashion capital. It aims to enhance the influence of Hong Kong’s local brands in the international fashion market, opening up new opportunities for the Hong Kong’s and Korean fashion industry and creating a brilliant new chapter in Hong Kong-Korea cultural and creativity cooperation.
About “Hong Kong Week 2025@Seoul”
The fashion show cum exhibition in Seoul is one of the contribution programmes of “Hong Kong Week 2025@Seoul”. Hong Kong Week is an annual arts festival organised by the Leisure and Cultural Services Department of the Government of the Hong Kong Special Administrative Region, celebrating Hong Kong’s creative excellence worldwide and fostering cultural exchange and artistic collaboration. In 2025, the festival arrives in Seoul, offering a vibrant showcase of Hong Kong’s dynamic arts scene. Kicking off on 26 September, the festival features 14 programmes covering 65 performances and activities encompassing dance, music, movies, Chinese paintings, comics and fashion design, which will display Hong Kong’s East-meets-West creativity. For programme details and ticketing information, please visit www.hongkongweek.gov.hk.
About Asian New Generation Creativity Design Association
The creative sector has always played a vital role in Hong Kong, showcasing the city’s highly competitive local talent. However, the importance of integrating brand marketing is often overlooked in favour of design. Recognising this issue, Mr. Dorian Ho, the chairman of the Asian New Generation Creativity Design Association, took the initiative to form this association and make a meaningful impact. The goal is to establish a central platform that supports creative individuals across diverse fields. Leveraging Dorian’s extensive marketing experience and expertise, the association aims to elevate the industry’s overall quality and foster growth in Hong Kong’s creative landscape. The Asian New Generation Creativity Design Association is dedicated to bridging the generational gap, facilitating communication, and connecting the past with the future.
XIAMEN, China, Aug. 29, 2025 /PRNewswire/ — Amid global sustainable development momentum, Antaisolar, a renewable energy leader, officially held its “RAISE•2025” event, releasing its latest ESG report and unveiling the EcoRaise Global Ecological Co-construction Initiative. These efforts underscore Antaisolar’s dedication to integrating environmental, social, and governance principles into its core strategy and operations.
During the event, Antaisolar CEO Ms. Jasmine Huang emphasized that: “ESG is not a choice but a must for future-facing enterprises — it’s our responsibility and the cornerstone of long-term, healthy growth.” She unveiled the 2024 ESG Report, the report details Antai’s achievements in reducing carbon emissions, promoting technological innovation, and strengthening sustainable management practices.
The credibility of Antaisolar’s ESG data was validated through an independent verification by TÜV SÜD, enhancing transparency and trust in the reported results, TÜV SÜD’s representative Mr. Andy He co-launched the assurance ceremony.
Further reinforcing its commitment, Antaisolar introduced EcoRaise Global Ecological Co-construction Initiative, backed by a special fund of RMB 50 million. As its first step, the company partnered with Shenzhen Mangrove Wetlands Conservation Foundation (MCF) to donate funds for protecting 2,000m² of mangroves in Quanzhou, Fujian. MCF representatives attended the donation ceremony and presented a certificate, marking EcoRaise’s solid start and Antaisolar’s commitment to ecological conservation.
In the future, Antaisolar will continue to champion green energy innovation and global sustainability, driving forward its mission to “Raise a Green World.”
For more information, please visit Antaisolar website: www.antaisolar.com
SINGAPORE – Media OutReach Newswire – 29 August 2025 – In a significant step toward reshaping how debt challenges are understood and addressed in Singapore, Debtox is proud to announce a formal collaboration with The Silver Lining, a non-profit organisation focused on helping individuals break free from destructive spending patterns and gambling addiction. This partnership represents a shared commitment to ethical, comprehensive, and sustainable debt resolution.
Debtox is a Singapore-based organisation that has long been dedicated to helping individuals navigate complex debt situations through transparent advice, ethical practices, and personaliseddebt management consultationservices. The Silver Lining complements this mission by offering support programs that address underlying behavioural challenges such as compulsive spending and gambling, root causes often overlooked in conventional debt management approaches.
Through this exclusive partnership, clients referred by The Silver Lining will receive integrated support that encompasses both emotional recovery and practical financial restructuring. This includes participation in recovery programs, detailed debt assessments from Debtox, and assistance with formal debt management solutions such as the Debt Repayment Scheme (DRS)orbankruptcy applications, where appropriate. Where suitable, clients may also be guided through a personalised debt repayment plan in Singapore that aligns with their long-term recovery goals.
What sets this collaboration apart is its holistic model, a joint effort that views financial recovery as more than a numbers game. By considering both financial data and behavioural health, Debtox and The Silver Lining are empowering individuals to rebuild their lives, not just balance their books. This model ensures that the help provided addresses not only the immediate financial situation, but also the deeper personal challenges that may have contributed to it. This includes guiding clients through options like debt restructuring services and consolidated debt management to better match their unique life circumstances.
This collaboration aligns closely with the Ministry of Law’s recent efforts to strengthen the integrity of the Debt Repayment Scheme and prevent exploitation by unethical debt consultancy practices. Both Debtox and The Silver Lining welcome these measures as a positive step toward building trust and safeguarding the intent of the DRS. This partnership is designed not only to work within the bounds of the Ministry of Law’s framework, but to enhance it, ensuring that each case is evaluated with empathy, care, and the understanding that financial hardship is often part of a broader personal struggle.
At the heart of this collaboration is a shared belief: ethical debt resolution is about people, not just payments. Debtox and The Silver Lining are committed to breaking cycles, not only of debt but also of shame, relapse, and isolation. By combining expert financial guidance with compassionate recovery support, they hope to set a new benchmark for responsible debt assistance in Singapore.
For more information, please visit https://debtox.sg/. Hashtag: #Debtox #TheSilverLining
The issuer is solely responsible for the content of this announcement.
About Debtox
Debtox is a dedicated partner for individuals seeking debt freedom. Since its inception, it has helped clients achieve financial stability by providing customised, proven solutions for managing debt. Alongside debt management strategies, Debtox equips clients with essential knowledge on handling creditors, understanding legal implications, and taking control of their finances. With a client-focused approach, Debtox guides individuals every step of the way toward achieving lasting financial freedom.
About The Silver Lining
The Silver Lining Community Services Ltd (TSL) is a non-profit organisation established under Kingdom Life Community Church that provides specialised services in problem-gambling education, debt management counseling, and crisis intervention to support affected individuals and their families.
SINGAPORE, Aug. 29, 2025 /PRNewswire/ — Alibaba International today has launched its AI solution to enhance global e-commerce operations – Alibaba International Marco (hereafter referred to as “Marco”).
Developed by Alibaba International’s AI Business team in 2024 with the goal of empowering SMBs in cross-border trade, Marco provides comprehensive assistance to e-commerce merchants across Alibaba’s ecosystem, handling over 60 specific tasks across marketing, marketplace compliance, and customer service. The solution operates in more than 40+ languages, offering capabilities such as listing translation, content generation, and image creation capabilities at a lower operational cost than major peers while maintaining high performance.
Unprecedented Adoption
Demand for Alibaba International’s AI services has surged dramatically, primarily powered by Marco. Daily API invocations with its AI system by Chinese merchants in Alibaba International have exceeded 1 billion as of July 2025 – a thousand-fold increase from approximately 1 million in 2023. All of Alibaba International’s e-commerce marketplaces have adopted the AI solution, with the same capabilities now available to merchants worldwide engaged in cross-border trade.
Key features driving adoption include:
Creative Image Generation: Generates multiple, diverse visual variations from a single source image.
AI-Generated Listings: Creates product listings directly from images.
A significant upgrade to Marco’s translation capabilities in late 2024 resulted in a 30% increase in user satisfaction for major European language areas. Marco now generates nearly 40% of all search-optimized product descriptions across Alibaba International’s platforms, a figure expected to exceed 50% in the near future.
Expanding Ecosystem and New AI Tools
Alibaba International has extended access to Marco’s technology to e-commerce platforms in China that operate outside of the Alibaba ecosystem. API invocations from these partners via Marco have increased 23-fold.
The company has also introduced three specialized AI Agents designed for complex operational tasks faced by merchants in cross-border e-commerce:
Intelligent Refund Agent: Recommends optimal refund solutions by analyzing the market insights generated from both consumers and merchants, reducing costs by 15%.
HS Code Agent: Automates customs classification, increasing accuracy by 23%.
Merchant Recruitment Agent: Identifies and pre-qualifies potential sellers, nearly doubling the success rate for email lead conversion.
“The past year marks a significant shift in how we deploy AI to empower cross-border e-commerce, reflecting broader industry needs and trends,” said Kaifu Zhang, Vice President of Alibaba International and Head of its AI Business team. “Our approach combines deep, scenario-specific data with continuous learning loops, leading to increasingly powerful problem-solving capabilities. We’re evolving beyond standalone generative models toward dedicated AI agents that can tackle a wider range of complex business challenges efficiently for merchants engaged in cross-border trade worldwide.”
Some AI solutions are currently available for partners on Aidge, Alibaba International’s open AI platform.
About Alibaba International Digital Commerce Group Alibaba International Digital Commerce Group is dedicated to supporting the development of global digital trade with AI-powered technology. It operates various platforms with distinctive business models, covering multiple countries and regions around the world.




 https://v-capital.co/


 www.hongkongweek.gov.hk