

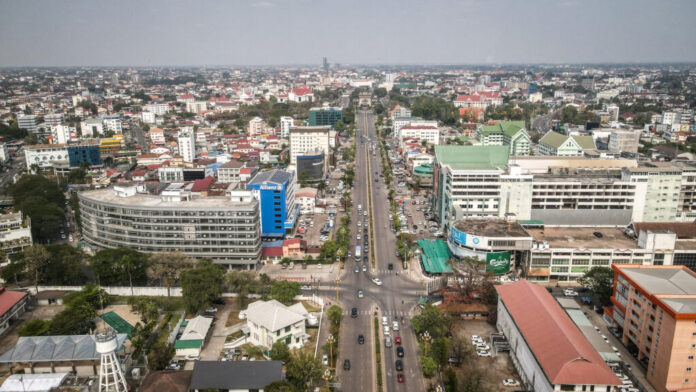
The government has greenlighted a nationwide overhaul of local governance, approving the establishment of 640 new sub-districts, or Taseng, which will replace villages as the country’s primary administrative units.
Laos Launches Major Local Government Shake-Up with 640 New Sub-Districts
State Grid Kashgar power supply company: the power of science and technology promotes the reliability improvement of distribution network power supply capacity
KASHGAR, China, Nov. 21, 2025 /PRNewswire/ — On November 18, the State Grid Kashgar power supply company vigorously promoted the deep integration of scientific and technological innovation and grid operation and maintenance, adhered to the strategy of “rejuvenating security through science and technology and strengthening the grid through science and technology”, and developed “distribution network networking support technology” to solve the problem of low power supply reliability in remote mountainous areas.
As the “last kilometer” connecting the main power grid and thousands of households, the operation quality of the distribution network is directly related to the power consumption experience of users. Xinjiang is located in the northwest border, with obvious characteristics of “high altitude and few borders” (high altitude, many countries along the way, long border and small population), uneven distribution of power supply and load, and weak connection between remote mountainous areas and single transformer and single circuit lines of the main grid, which brings great pressure and challenges to the extension and guarantee of the terminal power grid.
Based on the core area of the new power system in southern Xinjiang, the Party committee of State Grid Kashgar power supply company pays great attention to this complex power supply environment, and is committed to transforming adverse factors such as weak grid connection and “double highs” into resource advantages with many scientific and technological innovation scenes and strong demonstration. At the beginning of this year, it coordinated the scientific research forces of enterprises from all sides, pooled the scientific research resources of colleges and universities, officially launched the special action of “power supply quality improvement”, carried out special research projects with the breakthrough point of improving the power supply reliability of the power grid with the characteristics of strong and weak imbalance, established a small signal model of the new energy distribution system based on parallel computing for one year, studied the strong and weak imbalance networking support technology, developed a comprehensive treatment device for composite energy storage and power quality, and formed a Xinjiang plan to adapt to the high-quality development of the distribution system in remote areas. According to the project, the “diagnosis treatment” system was established. The theoretical research system of the whole business chain greatly reduces the power outage time and scope of users in mountainous and pastoral areas. Relying on this technology, the “networking support technology and application of strong and weak unbalanced distribution system facing Xinjiang” led by the company won the first prize of the science and technology award of the autonomous region.
According to statistics, the R & D and application of this technology can increase the mutual supply rate by 8%, the power quality by 2%, and the equipment heavy load elimination rate by about 5% after the power grid failure in remote mountainous and pastoral areas, and realize the digital transformation from “passive response” to “intelligent self-healing” in the weak connection area of the distribution network.
MINISO Group Announces September Quarter and First Nine Months of 2025 Unaudited Financial Results
MINISO Group Momentum Further Accelerated: Same-Store GMV(1) Increased Mid-single Digit in September Quarter; Revenue Increased 28.2%; Adjusted Operating Profit Increased 14.8%;
MINISO Brand Added 102 Net New Stores in Mainland China with Strong Same-Store GMV(1) Growth (“SSSG“) of High-single Digit for September Quarter;
TOP TOY Brand Revenue(2) Increased 111.4%, another New Quarterly Growth Record
MINISO Group Achieved the Milestone of 8,000 Stores Globally with Quarterly Revenue Surpassed RMB5 Billion for the First Time
GUANGZHOU, China, Nov. 21, 2025 /PRNewswire/ — MINISO Group Holding Limited (NYSE: MNSO; HKEX: 9896) (“MINISO“, “MINISO Group” or the “Company“), a global value retailer offering a variety of trendy lifestyle products featuring IP design, today announced its unaudited financial results for the three months and the nine months ended September 30, 2025 (the “September Quarter” and the “First Nine Months“, respectively).
Financial Highlights for the September Quarter
- Revenue increased 28.2% year over year to RMB5,796.6 million (US$814.3 million), above the high end of the Company’s previous guidance range of 25%-28%.
- All three of the Company’s operating segments delivered an upward momentum in SSSG during the September Quarter, lifting group-level SSSG to a mid-single digit level.
- MINISO Brand’s SSSG was mid-single digit year over year, underpinned by (i) an exceptional high-single-digit growth in mainland China, and (ii) a low-single-digit growth in overseas markets.
- TOP TOY Brand’s SSSG advanced at a mid-single digit rate year over year.
- Gross profit increased 27.6% year over year to RMB2,590.1 million (US$363.8 million).
- Gross margin was 44.7%, compared to 44.9% in the same period last year.
- Operating profit was RMB846.6 million (US$118.9 million), compared to RMB852.6 million in the same period last year.
- Adjusted operating profit(3) increased 14.8% year over year to RMB1,022.3 million (US$143.6 million), with adjusted operating margin of 17.6%.
- Profit for the period was RMB443.2 million (US$62.3 million), compared to RMB648.3 million in the same period last year.
- Adjusted net profit(3) increased 11.7% year over year to RMB766.8 million (US$107.7 million).
- Adjusted net margin(3) was 13.2%, compared to 15.2% in the same period last year.
- Adjusted EBITDA(3) increased 18.8% year over year to RMB1,353.8 million (US$190.2 million).
- Adjusted EBITDA margin(3) was 23.4%, compared to 25.2% in the same period last year.
- Adjusted basic and diluted earnings per ADS(3) were both RMB2.48 (US$0.35), increased by 12.7% year over year.
- Net cash from operating activities was RMB1,299.6 million (USD182.6 million) in the September Quarter, with an operating cash flow to adjusted net profit ratio of 1.7. Capital expenditure was RMB330.3 million (US$46.4 million) and free cash flow was RMB969.3 million (US$136.2 million) for the September Quarter.
Financial Highlights for the First Nine Months
- Revenue increased 23.7% year over year to RMB15,189.8 million (US$2,133.7 million).
- Gross profit increased 24.5% year over year to RMB6,747.0 million (US$947.7 million).
- Gross margin was 44.4%, compared to 44.1% in the same period last year.
- Operating profit was RMB2,392.5 million (US$336.1 million), compared to RMB2,347.4 million in the same period last year.
- Adjusted operating profit(3) increased 6.5% year over year to RMB2,608.8 million (US$366.5 million), with adjusted operating margin of 17.2%.
- Profit for the period was RMB1,349.2 million (US$189.5 million), compared with RMB1,825.7 million in the same period last year.
- Adjusted net profit(3) increased 6.1% year over year to RMB2,045.5 million (US$287.3 million), compared with RMB1,928.1 million in the same period last year.
- Adjusted net margin(3) was 13.5%, compared to 15.7% in the same period last year.
- Adjusted EBITDA(3) increased 14.0% year over year to RMB3,540.6 million (US$497.3 million).
- Adjusted EBITDA margin(3) was 23.3%, compared to 25.3% in the same period last year.
- Adjusted basic earnings per ADS(3) increased 7.8% year over year to RMB6.64 (US$0.93).
- Adjusted diluted earnings per ADS(3) increased 8.5% year over year to RMB6.64 (US$0.93).
- Cash Position(4) was RMB7,766.2 million (US$1,090.9 million) as of September 30, 2025, compared to RMB6,698.1 million as of December 31, 2024.
- Net cash from operating activities was RMB2,313.8 million (US$325.0 million). Capital expenditure was RMB765.0 million (US$107.5 million) and free cash flow was RMB1,548.8 million (US$217.6 million) for the First Nine Months.
Operational Highlights
- Total number of stores on group level was 8,138 as of September 30, 2025, achieving the milestone of 8,000 stores, with a year-over-year increase of 718 net new stores.
- Number of MINISO stores was 7,831 as of September 30, 2025, representing a year-over-year increase of 645 net new stores.
- Number of MINISO stores in mainland China was 4,407 as of September 30, 2025, representing a year-over-year increase of 157 net new stores.
- Number of MINISO stores in overseas markets reached 3,424 as of September 30, 2025, representing a year-over-year increase of 488 net new stores.
- Number of TOP TOY stores was 307 as of September 30, 2025, representing a year-over-year increase of 73 net new stores.
|
Notes: |
|
(1) “Same-store GMV” refers to the GMV generated by those stores that opened prior to the beginning of the comparative periods and remained open as of the end of the comparative periods and closed for less than 30 days during both comparative periods. “SSSG” refers to the year-over-year growth of same-store GMV. |
|
(2) Represents only revenue generated from external parties. |
|
(3) See the sections titled “Non-IFRS Financial Measures” and “Reconciliation of Non-IFRS Financial Measures” in this press release for more information. |
|
(4) “Cash position” refers to the combined balance of the Company’s cash and cash equivalents, restricted cash, term deposits with original maturity over three months, and other investments recorded as current assets. |
|
The following table provides a breakdown of the Company’s store network and its changes on a year-over-year basis. The number of directly operated stores reached 700 on group level. 75.7% of new MINISO stores in the past twelve months were located in overseas markets. |
|
As of |
YoY |
|||
|
September 30, 2024 |
September 30, 2025 |
|||
|
Number of stores on group level |
7,420 |
8,138 |
718 |
|
|
Number of MINISO stores |
7,186 |
7,831 |
645 |
|
|
Mainland China |
4,250 |
4,407 |
157 |
|
|
—Directly operated stores |
29 |
21 |
(8) |
|
|
—Stores operated under MINISO Retail Partner model |
4,196 |
4,358 |
162 |
|
|
—Stores operated under distributor model |
25 |
28 |
3 |
|
|
Overseas |
2,936 |
3,424 |
488 |
|
|
—Directly operated stores |
422 |
637 |
215 |
|
|
—Stores operated under MINISO Retail Partner model |
372 |
429 |
57 |
|
|
—Stores operated under distributor model |
2,142 |
2,358 |
216 |
|
|
Number of TOP TOY stores |
234 |
307 |
73 |
|
|
—Directly operated stores |
29 |
42 |
13 |
|
|
—Stores operated under TOP TOY Retail Partner model(1) |
205 |
258 |
53 |
|
|
—Stores operated under distributor model |
– |
7 |
7 |
|
|
Note: |
||||
|
(1) TOP TOY Retail Partner model is a hybrid store operation model similar to MINISO Retail Partner model, taking advantageous elements from the franchise store model and the directly operated chain store model, both of which are industry norms. |
||||
Mr. Guofu Ye, Founder, Chairman, and CEO of MINISO, commented, “We are thrilled to see two significant milestones achieved by MINISO Group in the September Quarter: quarterly revenue surpassed RMB 5 billion for the first time, and MINISO Group’s global store counts exceeded 8,000. In the September Quarter, MINISO mainland China delivered an exceptional performance, with over 100 net new stores on a quarterly basis and a high-single-digit level SSSG in this quarter. Both net store expansion and SSSG demonstrated sequential acceleration. Against the backdrop of a highly competitive physical retail environment in domestic market, MINISO mainland China’s outstanding results further underscored our ability to respond agilely, execute effectively, and leverage the resilience of our business model. SSSG in MINISO mainland China from year to date reached low-single digit. We are steadily progressing toward our goal of achieving full-year positive SSSG for MINISO mainland China in 2025.”
“MINISO overseas had also shown sequential improvement in its same-store GMV, with growth accelerating to low-single digit in the September Quarter. Our strategic markets, such as North America and Europe, continued to deliver outstanding SSSG. We expected to see more momentum from SSSG in the growth of overseas markets, signaling a higher-quality growth that is more sustainable and carries lower operational risk. Meanwhile, we were thrilled to see that the operating margin of MINISO overseas directly operated business has year-over-year improvement, which demonstrated continuous and steady improvement in MINISO’s fundamental operational strengths. Notably, TOP TOY achieved a remarkable 111.4% year-over-year revenue increase in the September Quarter, significantly exceeding our expectations and demonstrating its strong market leadership and growth potential in the pop toy industry.” Mr. Ye continued.
Mr. Eason Zhang, CFO of MINISO, commented, “The year-over-year revenue growth on group level reached 28.2%, above our previous guidance. Adjusted operating profit increased 14.8% year over year. Adjusted operating margin was 17.6%, with year-over-year margin contraction sequentially narrowing from previous quarters, both in line with our previous guidance. Adjusted EBITDA increased 18.8% year over year, with a trend of sequential quarterly acceleration in year-over-year growth. Adjusted EBITDA margin reached 23.4%.”
” Net cash from operating cash flow was RMB1,299.6 million in this quarter, with an operating cash flow to adjusted net profit ratio of 1.7. As of September 30, our cash position reached RMB7.77 billion. Net cash from operating cash flow for the First Nine Months reached 2,313.8 million, surpassing adjusted net profit in the same period. It demonstrated our solid financial position, high-quality profitability and efficient management ability in working capital, and further underscored the resilience and robust operational cash flow generation of our business that will fuel our future high-quality growth.” Mr. Zhang concluded.
Operational Updates
October 2025: According to the Company’s preliminary estimates, the SSSG for MINISO mainland China reached a low-teens level for the whole month of October.
Financial Results for the September Quarter
Revenue was RMB5,796.6 million (US$814.3 million), representing an increase of 28.2% year over year.
Revenue from MINISO brand increased by 22.9% year over year to RMB5,221.5 million (US$733.5 million), including (i) an increase of 19.3% in revenue from MINISO brand in mainland China, accelerating sequentially by quarters in 2025, and (ii) an increase of 27.7% in revenue from MINISO brand in overseas markets. Overseas revenue contributed to 44.3% of revenue from MINISO brand.
Revenue from TOP TOY brand(1) increased by 111.4% to RMB574.5 million (US$80.7 million).
For more information on the composition and year-over-year change of revenue, please refer to the “Unaudited Additional Information” in this press release.
Cost of sales was RMB3,206.6 million (US$450.4 million), representing an increase of 28.6% year over year.
Gross profit was RMB2,590.1 million (US$363.8 million), representing an increase of 27.6% year over year.
Gross margin was 44.7%, compared to 44.9% in the same period last year.
Selling and distribution expenses were RMB1,429.9 million (US$200.9 million), representing an increase of 43.5% year over year. Excluding share-based compensation expenses, selling and distribution expenses were RMB1,333.9 million (US$187.4 million), representing an increase of 36.5% year over year. The year-over-year increase was mainly attributable to the Company’s investments into directly operated stores to pursue the future success of the Company’s business, especially in strategic overseas markets such as the U.S. market. As of September 30, 2025, total number of directly operated stores on the group level was 700, compared to 480 as of September 30, 2024. In the September Quarter, revenue from directly operated stores increased 69.9%, while related expenses including rental and related expenses, depreciation and amortization expenses together with payroll excluding share-based compensation expenses increased 40.7%, decelerating from the year-over-year increase of 71.4% and 56.3% in March and June quarter of 2025, respectively. Promotion and advertising expenses increased 43.3%, as a percentage of revenue stabilizing at around 3% in both comparative periods. Licensing expenses increased 20.8%, as a percentage of revenue stabilizing at around 3% in both comparative periods as well. Logistics expenses increased 23.3% year over year.
General and administrative expenses were RMB343.8 million (US$48.3 million), representing an increase of 45.6% year over year. Excluding share-based compensation expenses, general and administrative expenses were RMB264.0 million (US$37.1 million), representing an increase of 21.4% year over year. The year-over-year increase was primarily due to the increase of personnel-related expenses in relation to the growth of the Company’s business. The increase in equity-settled share-based payment expenses was mainly related to TOP TOY brand.
Other net income was RMB34.3 million (US$4.8 million), compared to RMB36.8 million in the same period last year. The year-over-year decrease was mainly due to a larger net foreign exchange loss compared with the same period last year, partially offset by an increase in investment income from wealth management products.
Operating profit was RMB846.6 million (US$118.9 million), compared with RMB852.6 million in the same period last year.
Adjusted operating profit(2) was RMB1,022.3 million (US$143.6 million), representing an increase of 14.8% year over year, with adjusted operating margin of 17.6%. The year-over-year contraction in adjusted operating margin has narrowed sequentially from 4.2 percentage points in the March quarter, to 2.3 percentage points in the June quarter and further narrowed down to 2.1 percentage points in the September Quarter.
Net finance cost was RMB104.5 million (US$14.7 million), compared to net finance income of RMB7.8 million in the same period last year. The year-over-year increase in finance cost was due to (i) increased interest expenses in relation to the equity linked securities issued by the Company in January 2025 ( the “Equity Linked Securities“) and the bank loans used for the acquisition of the equity interest of Yonghui Superstores Co., Ltd*(永輝超市股份有限公司) (“Yonghui“), both of which have been excluded in non-IFRS financial measures(2), and (ii) increased interest expenses on lease liabilities corresponding to the Company’s investment in directly operated stores.
Share of loss of equity-accounted investees, net of tax was RMB145.1 million (US$20.4 million), compared to share of profit of RMB2.0 million in the same period last year. The year-over-year change was mainly attributable to share of loss in Yonghui, which has been excluded in non-IFRS financial measures(2).
Other gain was RMB73.2 million (US$10.3 million), mainly attributable to gain from fair value change of derivatives under mark-to-market impact, which was in relation to the Equity Linked Securities and has been excluded in non-IFRS financial measures(2).
Effective tax rate was 33.9%, compared to 24.8% in the same period last year.
Adjusted effective tax rate(2) was 22.8%, which excluded the impact on effective tax rate as a result of adjusted items, compared to 23.8% in the same period last year.
Profit for the period was RMB443.2 million (US$62.3 million), compared to RMB648.3 million in the same period last year.
Adjusted net profit(2) was RMB766.8 million (US$107.7 million), increased by 11.7% year over year.
Adjusted net margin(2) was 13.2%, compared to 15.2% in the same period last year.
Adjusted EBITDA(2) was RMB1,353.8 million (US$190.2 million), representing an increase of 18.8% year over year.
Adjusted EBITDA margin(2) was 23.4%, compared to 25.2% in the same period last year.
Basic and diluted earnings per ADS were both RMB1.44 (US$0.20) in the September Quarter, compared with RMB2.08 in the same period last year.
Adjusted basic and diluted earnings per ADS(2) were both RMB2.48 (US$0.35) in the September Quarter, representing an increase of 12.7% year over year from RMB2.20 in the same period last year.
Net cash from operating activities was RMB1,299.6 million (USD182.6 million) in the September Quarter, with an operating cash flow to adjusted net profit ratio of 1.7. Capital expenditure was RMB330.3 million (US$46.4 million) and free cash flow was RMB969.3 million (US$136.2 million) for the September Quarter.
Financial Results for the First Nine Months
Revenue was RMB15,189.8 million (US$2,133.7 million), representing an increase of 23.7% year over year.
Revenue from MINISO brand increased by 19.8% to RMB13,870.5 million (US$1,948.4 million), including (i) an increase of 14.1% in revenue from MINISO brand in mainland China, and (ii) an increase of 28.7% in revenue from MINISO brand in overseas markets. The overseas revenue contributed to 42.1% of revenue from MINISO brand, compared to 39.2% in the same period last year.
Revenue from TOP TOY brand(1) increased by 87.9% to RMB1,316.6 million (US$184.9 million).
For more information on the composition and year-over-year change of revenue, please refer to the “Unaudited Additional Information” in this press release.
Cost of sales was RMB8,442.8 million (US$1,185.9 million), representing an increase of 23.0% year over year.
Gross profit was RMB6,747.0 million (US$947.7 million), representing an increase of 24.5% year over year.
Gross margin reached 44.4%, representing a year-over-year increase of 0.3 percentage point.
Selling and distribution expenses were RMB3,610.9 million (US$507.2 million), increased by 43.4% year over year. Excluding share-based compensation expenses, selling and distribution expenses were RMB3,501.0 million (US$491.8 million), increased by 42.4% year over year.
General and administrative expenses were RMB847.5 million (US$119.0 million), increased by 29.4% year over year. Excluding share-based compensation expenses, general and administrative expenses were RMB741.1 million (US$104.1 million), increased by 20.9% year over year.
Other net income was RMB132.5 million (US$18.6 million), compared to RMB78.5 million in the same period last year. The year-over-year increase was mainly due to (i) a net foreign exchange gain compared with a net foreign exchange loss in the same period last year, and (ii) an increase in investment income from wealth management products.
Operating profit was RMB2,392.5 million (US$336.1 million), compared to RMB2,347.4 million in the same period last year.
Adjusted operating profit(2) was RMB2,608.8 million (US$366.5 million), representing an increase of 6.5% year over year.
Net finance cost was RMB232.9 million (US$32.7 million), compared to net finance income of RMB41.9 million in the same period last year. The year-over-year increase in finance cost was due to (i) increased interest expenses in relation to the Equity Linked Securities and the bank loans used for the acquisition of the equity interest of Yonghui, both of which have been excluded in non-IFRS financial measures(2), and (ii) increased interest expenses on lease liabilities corresponding to the Company’s investment in directly operated stores.
Share of loss of equity-accounted investees, net of tax was RMB284.1 million (US$39.9 million), compared with share of profit of RMB2.3 million in the same period last year. The year-over-year change was mainly attributable to share of loss in Yonghui, which has been excluded in non-IFRS financial measures(2).
Other expenses was RMB11.2 million (US$1.6 million), mainly attributable to loss from fair value change of derivatives under mark-to-market impact and issuance cost of derivatives, which were in relation to the Equity Linked Securities and have been excluded in non-IFRS financial measures(2).
Effective tax rate was 27.6%, compared to 23.7% in the same period last year.
Adjusted effective tax rate(2) was 20.1%, which excluded the impact on effective tax rate as a result of adjusted items, compared to 22.7% in the same period last year.
Profit for the period was RMB1,349.2 million (US$189.5 million), compared to RMB1,825.7 million in the same period last year.
Adjusted net profit(2) was RMB2,045.5 million (US$287.3 million), compared to RMB1,928.1 million in the same period last year.
Adjusted net margin(2) was 13.5%, compared to 15.7% in the same period last year.
Adjusted EBITDA(2) increased 14.0% year over year to RMB3,540.6 million (US$497.3 million).
Adjusted EBITDA margin(2) was 23.3%, compared to 25.3% in the same period last year.
Basic earnings per ADS was RMB4.40 (US$0.62), compared to RMB5.84 in the same period last year.
Diluted earnings per ADS was RMB4.36 (US$0.61), compared to RMB5.80 in the same period last year.
Adjusted basic earnings per ADS(2) increased 7.8% year over year to RMB6.64 (US$0.93), compared to RMB6.16 in the same period last year.
Adjusted diluted earnings per ADS(2) increased 8.5% year over year to RMB6.64 (US$0.93), compared to RMB6.12 in the same period last year.
Cash position, which was the combined balance of the Company’s cash and cash equivalents, restricted cash, term deposits, and other investments recorded as current assets was RMB7,766.2 million (US$1,090.9 million) as of September 30, 2025, compared to RMB6,698.1 million as of December 31, 2024.
Net cash from operating activities was RMB2,313.8 million (US$325.0 million). Capital expenditure was RMB765.0 million (US$107.5 million) and free cash flow was RMB1,548.8 million (US$217.6 million) for the First Nine Months.
|
Notes: |
|
(1) Revenue from TOP TOY brand only represents revenue generated from external parties. |
|
(2) See the sections titled “Non-IFRS Financial Measures” and “Reconciliation of Non-IFRS Financial Measures” in this press release for more information. |
Conference Call
The Company’s management will hold an earnings conference call at 4:00 A.M. Eastern Time on Friday, November 21, 2025 (5:00 P.M. Beijing Time on the same day) to discuss the financial results. Simultaneous interpretation in English will be provided during the conference call. The conference call can be accessed via the following methods:
Access 1
Join Zoom meeting.
Zoom link: https://zoom.us/j/97158482833?pwd=msvkC9gwjBFY7o1WCnQWqSJ4cpKEAD.1
Meeting Number: 971 5848 2833
Meeting Passcode: 9896
Access 2
Listeners of the meeting may access the call by dialing the following numbers and using the same meeting number and passcode as access 1.
|
United States: |
+1 689 278 1000 (or +1 719 359 4580) |
|
Hong Kong, China: |
+852 5803 3730 (or +852 5803 3731) |
|
United Kingdom: |
+44 203 481 5237 (or +44 131 460 1196) |
|
France: |
+33 1 7037 9729 (or +33 1 7037 2246) |
|
Singapore: |
+65 3158 7288 (or +65 3165 1065) |
|
Canada: |
+1 438 809 7799 (or +1 204 272 7920) |
Access 3
Listeners of the meeting can also access the call through the Company’s investor relations website at https://ir.miniso.com/.
The replay will be available approximately two hours after the conclusion of the live event at the Company’s investor relations website at https://ir.miniso.com/.
About MINISO Group
MINISO Group is a global value retailer offering a variety of trendy lifestyle products featuring IP design. The Company serves consumers primarily through its large network of MINISO stores, and promotes a relaxing, treasure-hunting and engaging shopping experience full of delightful surprises that appeals to all demographics. Aesthetically pleasing design, quality and affordability are at the core of every product in MINISO’s wide product portfolio, and the Company continually and frequently rolls out products with these qualities. Since the opening of its first store in China in 2013, the Company has built its flagship brand “MINISO” as a globally recognized retail brand and established a massive store network worldwide. For more information, please visit https://ir.miniso.com/.
Exchange Rate
The U.S. dollar (US$) amounts disclosed in this press release, except for those transaction amounts that were actually settled in U.S. dollars, are presented solely for the convenience of the readers. The conversion of Renminbi (RMB) into US$ in this press release is based on the exchange rate set forth in the H.10 statistical release of the Board of Governors of the Federal Reserve System as of September 30, 2025, which was RMB7.1190 to US$1.0000. The percentages stated in this press release are calculated based on the RMB amounts.
Non-IFRS Financial Measures
In evaluating the business, MINISO considers and uses adjusted operating profit, adjusted operating margin, adjusted effective tax rate, adjusted net profit, adjusted net margin, adjusted EBITDA, adjusted EBITDA margin, adjusted basic and diluted net earnings per share and adjusted basic and diluted net earnings per ADS as supplemental measures to review and assess its operating performance. The presentation of these non-IFRS financial measures is not intended to be considered in isolation or as a substitute for the financial information prepared and presented in accordance with IFRS. MINISO defines adjusted operating profit as operating profit for the period excluding equity-settled share-based payment expenses. MINISO calculates adjusted operating margin by dividing adjusted operating profit by revenue for the same period. MINISO defines adjusted effective tax rate as the effective tax rate excluding the tax impact of adjusted items under non-IFRS financial measures. MINISO defines adjusted net profit as profit for the period excluding equity-settled share-based payment expenses, gain or loss from fair value change of derivatives, issuance cost of derivatives and interest expenses related to the Equity Linked Securities, interest expenses related to the bank loans used for acquisition of the equity interest in Yonghui, and share of profit or loss of Yonghui, net of tax. MINISO calculates adjusted net margin by dividing adjusted net profit by revenue for the same period. MINISO defines adjusted EBITDA as adjusted net profit plus depreciation and amortization, finance costs excluding interest expenses related to the Equity Linked Securities and interest expenses related to the bank loans used for acquisition of the equity interest in Yonghui and income tax expense. Adjusted EBITDA margin is computed by dividing adjusted EBITDA by revenue for the period. MINISO computes adjusted basic and diluted net earnings per ADS by dividing adjusted net profit attributable to the equity shareholders of the Company by the number of ADSs represented by the number of ordinary shares used in the basic and diluted earnings per share calculation on an IFRS basis. MINISO computes adjusted basic and diluted net earnings per share in the same way as it calculates adjusted basic and diluted net earnings per ADS, except that it uses the number of ordinary shares used in the basic and diluted earnings per share calculation on an IFRS basis as the denominator instead of the number of ADSs represented by these ordinary shares.
MINISO presents these non-IFRS financial measures because they are used by the management to evaluate its operating performance and formulate business plans. These non-IFRS financial measures enable the management to assess its operating results without considering the impacts of the aforementioned non-cash and other adjustment items that MINISO does not consider to be indicative of its operating performance in the future. Accordingly, MINISO believes that the use of these non-IFRS financial measures provides useful information to investors and others in understanding and evaluating its operating results in the same manner as the management and board of directors.
These non-IFRS financial measures are not defined under IFRS and are not presented in accordance with IFRS. These non-IFRS financial measures have limitations as analytical tools. One of the key limitations of using these non-IFRS financial measures is that they do not reflect all items of income and expense that affect MINISO’s operations. Further, these non-IFRS financial measures may differ from the non-IFRS information used by other companies, including peer companies, and therefore their comparability may be limited.
These non-IFRS financial measures should not be considered in isolation or construed as alternatives to profit, net profit margin, basic and diluted earnings per share and basic and diluted earnings per ADS, as applicable, or any other measures of performance or as indicators of MINISO’s operating performance. Investors are encouraged to review MINISO’s historical non-IFRS financial measures in light of the most directly comparable IFRS measures, as shown below. The non-IFRS financial measures presented here may not be comparable to similarly titled measures presented by other companies. Other companies may calculate similarly titled measures differently, limiting the usefulness of such measures when analyzing MINISO’s data comparatively. MINISO encourages you to review its financial information in its entirety and not rely on a single financial measure.
For more information on the non-IFRS financial measures, please see the table captioned “Reconciliation of Non-IFRS Financial Measures” set forth at the end of this press release.
Safe Harbor Statement
This announcement contains forward-looking statements. These statements are made under the “safe harbor” provisions of the U.S. Private Securities Litigation Reform Act of 1995. These forward-looking statements can be identified by words or phrases such as “may”, “will”, “expect”, “anticipate”, “aim”, “estimate”, “intend”, “plan”, “believe”, “is/are likely to”, “potential”, “continue” or other similar expressions. Among other things, the quotations from management in this announcement, as well as MINISO’s strategic and operational plans, contain forward-looking statements. MINISO may also make written or oral forward-looking statements in its periodic reports to the U.S. Securities and Exchange Commission (the “SEC“) and The Stock Exchange of Hong Kong Limited (the “HKEX“), in its annual report to shareholders, in press releases and other written materials and in oral statements made by its officers, directors or employees to third parties. Statements that are not historical facts, including statements about MINISO’s beliefs and expectations, are forward-looking statements. Forward-looking statements involve inherent risks and uncertainties. A number of factors could cause actual results to differ materially from those contained in any forward-looking statement, including but not limited to the following: MINISO’s mission, goals and strategies; future business development, financial conditions and results of operations; the expected growth of the retail market and the market of branded variety retail of lifestyle products in China and globally; expectations regarding demand for and market acceptance of MINISO’s products; expectations regarding MINISO’s relationships with consumers, suppliers, MINISO Retail Partners, local distributors, and other business partners; competition in the industry; proposed use of proceeds; and relevant government policies and regulations relating to MINISO’s business and the industry. Further information regarding these and other risks is included in MINISO’s filings with the SEC and the HKEX. All information provided in this press release and in the attachments is as of the date of this press release, and MINISO undertakes no obligation to update any forward-looking statement, except as required under applicable law.
Investor Relations Contact:
MINISO Group Holding Limited
Email: ir@miniso.com
Phone: +86 (20) 36228788 Ext.8039
|
MINISO GROUP HOLDING LIMITED |
||||||
|
UNAUDITED CONDENSED CONSOLIDATED STATEMENTS OF FINANCIAL POSITION |
||||||
|
(Expressed in thousands) |
||||||
|
As at |
As at |
|||||
|
December 31, 2024 |
September 30, 2025 |
|||||
|
(Audited) |
(Unaudited) |
|||||
|
RMB’000 |
RMB’000 |
US$’000 |
||||
|
ASSETS |
||||||
|
Non-current assets |
||||||
|
Property, plant and equipment |
1,436,939 |
1,919,666 |
269,654 |
|||
|
Right-of-use assets |
4,172,083 |
5,008,473 |
703,536 |
|||
|
Intangible assets |
8,802 |
98,185 |
13,792 |
|||
|
Goodwill |
21,418 |
225,840 |
31,724 |
|||
|
Deferred tax assets |
181,948 |
216,410 |
30,399 |
|||
|
Other investments |
123,399 |
147,944 |
20,782 |
|||
|
Trade and other receivables |
341,288 |
149,312 |
20,974 |
|||
|
Term deposits |
140,183 |
– |
– |
|||
|
Financial derivative assets |
– |
1,108,926 |
155,770 |
|||
|
Interests in equity-accounted investees |
38,567 |
6,030,265 |
847,066 |
|||
|
6,464,627 |
14,905,021 |
2,093,697 |
||||
|
Current assets |
||||||
|
Other investments |
100,000 |
4,396,781 |
617,612 |
|||
|
Inventories |
2,750,389 |
3,287,721 |
461,823 |
|||
|
Trade and other receivables |
2,207,013 |
2,709,889 |
380,656 |
|||
|
Cash and cash equivalents |
6,328,121 |
3,099,079 |
435,325 |
|||
|
Restricted cash |
1,026 |
7,138 |
1,003 |
|||
|
Term deposits |
268,952 |
263,182 |
36,969 |
|||
|
11,655,501 |
13,763,790 |
1,933,388 |
||||
|
Total assets |
18,120,128 |
28,668,811 |
4,027,085 |
|||
|
MINISO GROUP HOLDING LIMITED |
||||||
|
UNAUDITED CONDENSED CONSOLIDATED STATEMENTS OF FINANCIAL POSITION (CONTINUED) |
||||||
|
(Expressed in thousands) |
||||||
|
As at |
As at |
|||||
|
December 31, 2024 |
September 30, 2025 |
|||||
|
(Audited) |
(Unaudited) |
|||||
|
RMB’000 |
RMB’000 |
US$’000 |
||||
|
EQUITY |
||||||
|
Share capital |
94 |
94 |
13 |
|||
|
Additional paid-in capital |
4,683,577 |
2,902,595 |
407,725 |
|||
|
Other reserves |
1,329,126 |
2,204,724 |
309,696 |
|||
|
Retained earnings |
4,302,177 |
5,636,230 |
791,717 |
|||
|
Equity attributable to equity shareholders of the Company |
10,314,974 |
10,743,643 |
1,509,151 |
|||
|
Non-controlling interests |
40,548 |
84,197 |
11,827 |
|||
|
Total equity |
10,355,522 |
10,827,840 |
1,520,978 |
|||
|
LIABILITIES |
||||||
|
Non-current liabilities |
||||||
|
Contract liabilities |
35,145 |
23,271 |
3,269 |
|||
|
Loans and borrowings |
4,310 |
5,622,289 |
789,758 |
|||
|
Other payables |
59,842 |
71,585 |
10,055 |
|||
|
Lease liabilities |
1,903,137 |
2,308,889 |
324,328 |
|||
|
Financial derivative liabilities |
– |
1,464,479 |
205,714 |
|||
|
Deferred income |
34,983 |
33,294 |
4,677 |
|||
|
2,037,417 |
9,523,807 |
1,337,801 |
||||
|
MINISO GROUP HOLDING LIMITED |
||||||
|
UNAUDITED CONDENSED CONSOLIDATED STATEMENTS OF FINANCIAL POSITION (CONTINUED) |
||||||
|
(Expressed in thousands) |
||||||
|
As at |
As at |
|||||
|
December 31, 2024 |
September 30, 2025 |
|||||
|
(Audited) |
(Unaudited) |
|||||
|
RMB’000 |
RMB’000 |
US$’000 |
||||
|
Current liabilities |
||||||
|
Contract liabilities |
323,292 |
287,242 |
40,349 |
|||
|
Loans and borrowings |
566,955 |
1,886,022 |
264,928 |
|||
|
Trade and other payables |
3,943,988 |
4,292,129 |
602,913 |
|||
|
Lease liabilities |
635,357 |
1,168,637 |
164,157 |
|||
|
Deferred income |
5,376 |
1,294 |
182 |
|||
|
Current taxation |
252,221 |
252,315 |
35,442 |
|||
|
Redemption liabilities arising from preferred shares |
– |
429,525 |
60,335 |
|||
|
5,727,189 |
8,317,164 |
1,168,306 |
||||
|
Total liabilities |
7,764,606 |
17,840,971 |
2,506,107 |
|||
|
Total equity and liabilities |
18,120,128 |
28,668,811 |
4,027,085 |
|||
|
MINISO GROUP HOLDING LIMITED |
||||||||||||
|
UNAUDITED CONDENSED CONSOLIDATED STATEMENTS OF PROFIT OR LOSS AND OTHER COMPREHENSIVE INCOME |
||||||||||||
|
(Expressed in thousands, except for per ordinary share and per ADS data) |
||||||||||||
|
Three months ended September 30, |
Nine months ended September 30, |
|||||||||||
|
2024 |
2025 |
2024 |
2025 |
|||||||||
|
(Unaudited) |
(Unaudited) |
(Unaudited) |
(Unaudited) |
|||||||||
|
RMB’000 |
RMB’000 |
US$’000 |
RMB’000 |
RMB’000 |
US$’000 |
|||||||
|
Revenue |
4,522,577 |
5,796,645 |
814,250 |
12,281,320 |
15,189,757 |
2,133,693 |
||||||
|
Cost of sales |
(2,492,601) |
(3,206,573) |
(450,425) |
(6,861,558) |
(8,442,767) |
(1,185,948) |
||||||
|
Gross profit |
2,029,976 |
2,590,072 |
363,825 |
5,419,762 |
6,746,990 |
947,745 |
||||||
|
Other income |
5,327 |
3,549 |
499 |
18,025 |
8,919 |
1,253 |
||||||
|
Selling and distribution expenses |
(996,461) |
(1,429,853) |
(200,850) |
(2,518,549) |
(3,610,875) |
(507,217) |
||||||
|
General and administrative expenses |
(236,208) |
(343,802) |
(48,294) |
(654,781) |
(847,458) |
(119,042) |
||||||
|
Other net income |
36,758 |
34,280 |
4,815 |
78,454 |
132,519 |
18,615 |
||||||
|
Reversal of credit loss/(credit loss) on trade and other receivables |
13,170 |
(7,678) |
(1,079) |
9,564 |
(21,128) |
(2,968) |
||||||
|
Impairment loss on non-current assets |
– |
– |
– |
(5,104) |
(16,450) |
(2,311) |
||||||
|
Operating profit |
852,562 |
846,568 |
118,916 |
2,347,371 |
2,392,517 |
336,075 |
||||||
|
Finance income |
25,067 |
20,276 |
2,848 |
99,673 |
86,112 |
12,096 |
||||||
|
Finance costs |
(17,227) |
(124,805) |
(17,531) |
(57,822) |
(319,041) |
(44,815) |
||||||
|
Net finance income/(cost) |
7,840 |
(104,529) |
(14,683) |
41,851 |
(232,929) |
(32,719) |
||||||
|
Share of profit/(loss) of equity-accounted investees, net of tax |
2,009 |
(145,105) |
(20,383) |
2,310 |
(284,051) |
(39,900) |
||||||
|
Other gain/(expenses) |
– |
73,214 |
10,284 |
– |
(11,198) |
(1,573) |
||||||
|
Profit before taxation |
862,411 |
670,148 |
94,134 |
2,391,532 |
1,864,339 |
261,883 |
||||||
|
Income tax expense |
(214,090) |
(226,950) |
(31,879) |
(565,832) |
(515,151) |
(72,363) |
||||||
|
Profit for the period |
648,321 |
443,198 |
62,255 |
1,825,700 |
1,349,188 |
189,520 |
||||||
|
Attributable to: |
||||||||||||
|
Equity shareholders of the Company |
641,765 |
440,539 |
61,881 |
1,811,867 |
1,346,569 |
189,152 |
||||||
|
Non-controlling interests |
6,556 |
2,659 |
374 |
13,833 |
2,619 |
368 |
||||||
|
Earnings per share for ordinary shares |
||||||||||||
|
-Basic |
0.52 |
0.36 |
0.05 |
1.46 |
1.10 |
0.15 |
||||||
|
-Diluted |
0.52 |
0.36 |
0.05 |
1.45 |
1.09 |
0.15 |
||||||
|
Earnings per ADS |
||||||||||||
|
(Each ADS represents 4 ordinary shares) |
||||||||||||
|
-Basic |
2.08 |
1.44 |
0.20 |
5.84 |
4.40 |
0.62 |
||||||
|
-Diluted |
2.08 |
1.44 |
0.20 |
5.80 |
4.36 |
0.61 |
||||||
|
MINISO GROUP HOLDING LIMITED |
|||||||||||||
|
UNAUDITED CONDENSED CONSOLIDATED STATEMENTS OF PROFIT OR LOSS AND OTHER COMPREHENSIVE INCOME (CONTINUED) |
|||||||||||||
|
(Expressed in thousands) |
|||||||||||||
|
Three months ended September 30, |
Nine months ended September 30, |
||||||||||||
|
2024 |
2025 |
2024 |
2025 |
||||||||||
|
(Unaudited) |
(Unaudited) |
(Unaudited) |
(Unaudited) |
||||||||||
|
RMB’000 |
RMB’000 |
US$’000 |
RMB’000 |
RMB’000 |
US$’000 |
||||||||
|
Profit for the period |
648,321 |
443,198 |
62,255 |
1,825,700 |
1,349,188 |
189,520 |
|||||||
|
Items that may be reclassified subsequently to profit or loss: |
|||||||||||||
|
Exchange differences on translation of financial statements of foreign operations |
8,863 |
(17,451) |
(2,451) |
15,708 |
(5,776) |
(811) |
|||||||
|
Other comprehensive income/(loss) for the period |
8,863 |
(17,451) |
(2,451) |
15,708 |
(5,776) |
(811) |
|||||||
|
Total comprehensive income for the period |
657,184 |
425,747 |
59,804 |
1,841,408 |
1,343,412 |
188,709 |
|||||||
|
Attributable to: |
|||||||||||||
|
Equity shareholders of the Company |
645,096 |
425,972 |
59,836 |
1,823,139 |
1,343,373 |
188,704 |
|||||||
|
Non-controlling interests |
12,088 |
(225) |
(32) |
18,269 |
39 |
5 |
|||||||
|
MINISO GROUP HOLDING LIMITED |
||||||||||||
|
RECONCILIATION OF NON-IFRS FINANCIAL MEASURES |
||||||||||||
|
(Expressed in thousands, except for percentages) |
||||||||||||
|
Three months ended September 30, |
Nine months ended September 30, |
|||||||||||
|
2024 |
2025 |
2024 |
2025 |
|||||||||
|
(Unaudited) |
(Unaudited) |
(Unaudited) |
(Unaudited) |
|||||||||
|
RMB’000 |
RMB’000 |
US$’000 |
RMB’000 |
RMB’000 |
US$’000 |
|||||||
|
Reconciliation of operating profit for the period to adjusted operating profit |
||||||||||||
|
Operating profit |
852,562 |
846,568 |
118,916 |
2,347,371 |
2,392,517 |
336,075 |
||||||
|
Add back: |
||||||||||||
|
Equity-settled share-based payment expenses |
37,883 |
175,728 |
24,684 |
102,390 |
216,314 |
30,385 |
||||||
|
Adjusted operating profit |
890,445 |
1,022,296 |
143,600 |
2,449,761 |
2,608,831 |
366,460 |
||||||
|
Adjusted operating margin |
19.7 % |
17.6 % |
17.6 % |
19.9 % |
17.2 % |
17.2 % |
||||||
|
MINISO GROUP HOLDING LIMITED |
|||||||||
|
RECONCILIATION OF NON-IFRS FINANCIAL MEASURES (CONTINUED) |
|||||||||
|
(Expressed in percentages) |
|||||||||
|
Three months ended September 30, |
Nine months ended September 30, |
||||||||
|
2024 |
2025 |
2024 |
2025 |
||||||
|
(Unaudited) |
(Unaudited) |
(Unaudited) |
(Unaudited) |
||||||
|
Reconciliation of effective tax rate to adjusted effective tax rate: |
|||||||||
|
Effective tax rate |
24.8 % |
33.9 % |
23.7 % |
27.6 % |
|||||
|
Impact on effective tax rate as a result of adjusted items |
(1.0) % |
(11.1) % |
(1.0) % |
(7.5) % |
|||||
|
Adjusted effective tax rate |
23.8 % |
22.8 % |
22.7 % |
20.1 % |
|||||
|
MINISO GROUP HOLDING LIMITED |
||||||||||||
|
RECONCILIATION OF NON-IFRS FINANCIAL MEASURES (CONTINUED) |
||||||||||||
|
(Expressed in thousands, except for per share, per ADS data and percentages) |
||||||||||||
|
Three months ended September 30, |
Nine months ended September 30, |
|||||||||||
|
2024 |
2025 |
2024 |
2025 |
|||||||||
|
(Unaudited) |
(Unaudited) |
(Unaudited) |
(Unaudited) |
|||||||||
|
RMB’000 |
RMB’000 |
US$’000 |
RMB’000 |
RMB’000 |
US$’000 |
|||||||
|
Reconciliation of profit for the period to adjusted net profit: |
||||||||||||
|
Profit for the period |
648,321 |
443,198 |
62,255 |
1,825,700 |
1,349,188 |
189,520 |
||||||
|
Add back: |
||||||||||||
|
Equity-settled share-based payment expenses |
37,883 |
175,728 |
24,684 |
102,390 |
216,314 |
30,385 |
||||||
|
Gain from fair value change of derivatives(1) |
– |
(73,214) |
(10,284) |
– |
(33,466) |
(4,701) |
||||||
|
Issuance cost of derivatives(2) |
– |
– |
– |
– |
44,664 |
6,274 |
||||||
|
Interest expenses related to the Equity Linked Securities and the bank loans used for acquisition of the equity interest in Yonghui |
– |
75,306 |
10,578 |
– |
203,657 |
28,608 |
||||||
|
—Interest expenses related to the Equity Linked Securities(3) |
– |
51,092 |
7,177 |
– |
140,977 |
19,803 |
||||||
|
—Interest expenses related to the bank loans used for acquisition of the equity interest in Yonghui |
– |
24,214 |
3,401 |
– |
62,680 |
8,805 |
||||||
|
Share of loss of Yonghui, net of tax |
– |
145,804 |
20,481 |
– |
265,139 |
37,244 |
||||||
|
Adjusted net profit |
686,204 |
766,822 |
107,714 |
1,928,090 |
2,045,496 |
287,330 |
||||||
|
Adjusted net margin |
15.2 % |
13.2 % |
13.2 % |
15.7 % |
13.5 % |
13.5 % |
||||||
|
Attributable to: |
||||||||||||
|
Equity shareholders of the Company |
679,461 |
763,224 |
107,209 |
1,913,891 |
2,041,853 |
286,818 |
||||||
|
Non-controlling interests |
6,743 |
3,598 |
505 |
14,199 |
3,643 |
512 |
||||||
|
Adjusted net earnings per share(4) |
||||||||||||
|
-Basic |
0.55 |
0.62 |
0.09 |
1.54 |
1.66 |
0.23 |
||||||
|
-Diluted |
0.55 |
0.62 |
0.09 |
1.53 |
1.66 |
0.23 |
||||||
|
Adjusted net earnings per ADS (Each ADS represents 4 ordinary shares) |
||||||||||||
|
-Basic |
2.20 |
2.48 |
0.35 |
6.16 |
6.64 |
0.93 |
||||||
|
-Diluted |
2.20 |
2.48 |
0.35 |
6.12 |
6.64 |
0.93 |
||||||
|
MINISO GROUP HOLDING LIMITED |
||||||||||||
|
RECONCILIATION OF NON-IFRS FINANCIAL MEASURES (CONTINUED) |
||||||||||||
|
(Expressed in thousands, except for percentages) |
||||||||||||
|
Three months ended September 30, |
Nine months ended September 30, |
|||||||||||
|
2024 |
2025 |
2024 |
2025 |
|||||||||
|
(Unaudited) |
(Unaudited) |
(Unaudited) |
(Unaudited) |
|||||||||
|
RMB’000 |
RMB’000 |
US$’000 |
RMB’000 |
RMB’000 |
US$’000 |
|||||||
|
Reconciliation of adjusted net profit for the period to adjusted EBITDA: |
||||||||||||
|
Adjusted net profit |
686,204 |
766,822 |
107,714 |
1,928,090 |
2,045,496 |
287,330 |
||||||
|
Add back: |
||||||||||||
|
Depreciation and amortization |
222,259 |
310,554 |
43,623 |
555,390 |
864,570 |
121,445 |
||||||
|
Finance costs excluding interest expenses related to the Equity Linked Securities and the bank loans used for acquisition of the equity interest in Yonghui |
17,227 |
49,499 |
6,953 |
57,822 |
115,384 |
16,207 |
||||||
|
Income tax expense |
214,090 |
226,950 |
31,879 |
565,832 |
515,151 |
72,363 |
||||||
|
Adjusted EBITDA |
1,139,780 |
1,353,825 |
190,169 |
3,107,134 |
3,540,601 |
497,345 |
||||||
|
Adjusted EBITDA margin |
25.2 % |
23.4 % |
23.4 % |
25.3 % |
23.3 % |
23.3 % |
||||||
|
Notes: |
|
(1) The gain or loss from fair value change of derivatives was a non-cash gain or expense that was related to the fair value of the Equity Linked Securities and call spread. It was determined primarily by movements in the underlying share price. |
|
(2) The issuance cost of derivatives was a one-off expense that was related to the Equity Linked Securities. |
|
(3) For the three months ended September 30, 2025, the RMB51.1 million interest expenses related to the Equity Linked Securities included RMB46.2 million non-cash portion and RMB4.9 million cash expense. |
|
For the nine months ended September 30, 2025, the RMB141.0 million interest expenses related to the Equity Linked Securities included RMB127.0 million non-cash portion and RMB14.0 million cash expense. |
|
(4) Adjusted basic and diluted net earnings per share are computed by dividing adjusted net profit attributable to the equity shareholders of the Company by the number of ordinary shares used in the basic and diluted earnings per share calculation on an IFRS basis. |
|
MINISO GROUP HOLDING LIMITED |
||||||||||||||||
|
UNAUDITED ADDITIONAL INFORMATION |
||||||||||||||||
|
(Expressed in thousands, except for percentages) |
||||||||||||||||
|
Three months ended September 30, |
Nine months ended September 30, |
|||||||||||||||
|
2024 |
2025 |
YoY |
2024 |
2025 |
YoY |
|||||||||||
|
RMB’000 |
RMB’000 |
US$’000 |
RMB’000 |
RMB’000 |
US$’000 |
|||||||||||
|
Revenue |
||||||||||||||||
|
MINISO Brand |
4,249,307 |
5,221,476 |
733,456 |
22.9 % |
11,573,972 |
13,870,480 |
1,948,375 |
19.8 % |
||||||||
|
-Mainland China |
2,438,555 |
2,909,171 |
408,648 |
19.3 % |
7,031,354 |
8,024,158 |
1,127,147 |
14.1 % |
||||||||
|
-Overseas |
1,810,752 |
2,312,305 |
324,808 |
27.7 % |
4,542,618 |
5,846,322 |
821,228 |
28.7 % |
||||||||
|
TOP TOY Brand |
271,797 |
574,523 |
80,703 |
111.4 % |
700,717 |
1,316,581 |
184,939 |
87.9 % |
||||||||
|
Others(1) |
1,473 |
646 |
91 |
(56.1) % |
6,631 |
2,696 |
379 |
(59.3) % |
||||||||
|
4,522,577 |
5,796,645 |
814,250 |
28.2 % |
12,281,320 |
15,189,757 |
2,133,693 |
23.7 % |
|||||||||
|
Note: |
|
(1) “Others” refers to revenue generated from other operating segments such as “WonderLife”, which was a secondary brand targeting on lower-tier cities in mainland China, aggregated and presented as “others”. As the MINISO brand increasingly penetrated into lower-tier cities in mainland China, “WonderLife” has become marginalized. |
|
MINISO GROUP HOLDING LIMITED |
|||||||
|
UNAUDITED ADDITIONAL INFORMATION |
|||||||
|
NUMBER OF MINISO STORES IN MAINLAND CHINA |
|||||||
|
As of |
|||||||
|
September 30, 2024 |
September 30, 2025 |
YoY |
|||||
|
By City Tiers |
|||||||
|
First-tier cities |
563 |
584 |
21 |
||||
|
Second-tier cities |
1,771 |
1,817 |
46 |
||||
|
Third- or lower-tier cities |
1,916 |
2,006 |
90 |
||||
|
Total |
4,250 |
4,407 |
157 |
||||
|
MINISO GROUP HOLDING LIMITED |
|||||||
|
UNAUDITED ADDITIONAL INFORMATION |
|||||||
|
NUMBER OF MINISO STORES IN OVERSEAS MARKETS |
|||||||
|
As of |
|||||||
|
September 30, 2024 |
September 30, 2025 |
YoY |
|||||
|
By Regions |
|||||||
|
Asia excluding China |
1,572 |
1,748 |
176 |
||||
|
North America |
294 |
421 |
127 |
||||
|
Latin America |
598 |
684 |
86 |
||||
|
Europe |
260 |
337 |
77 |
||||
|
Others |
212 |
234 |
22 |
||||
|
Total |
2,936 |
3,424 |
488 |
||||
|
*For identification purpose only |
Everest Medicines Announces First Patient Dosed in a Global Multi-Center Phase I Clinical Trial of Tumor-Associated Antigen Cancer Vaccine EVM14
- The first patient had received the first dose of EVM14 injection in a global, multi-center Phase I clinical trial of Everest Medicines’ Tumor-Associated Antigen (TAA) Cancer Vaccine EVM14 at NEXT Oncology Virginia in the United States, marking an important milestone in its global clinical development.
- The primary endpoints of the EVM14 Phase I trial are safety and tolerability, with secondary endpoints evaluating preliminary efficacy. EVM14 is Everest Medicines’ first internally developed therapeutic mRNA cancer vaccine to obtain IND approvals from both China National Medical Products Administration (NMPA) and the U.S. Food and Drug Administration (FDA).
- EVM14, an off-the-shelf therapeutic mRNA cancer vaccine, is developed based on the Company’s proprietary mRNA platform. It is designed to treat various squamous cell carcinomas, including squamous non-small cell lung cancer (sq-NSCLC) and head and neck squamous cell carcinoma (HNSCC).
- Patients with these cancers face limited treatment options within the current standard of care, underscoring a significant unmet medical need. As a TAA cancer vaccine, EVM14’s unique mechanism offers the potential to complement existing therapies and help delay disease recurrence, providing hope for long-term cancer-free survival.
SHANGHAI, Nov. 21, 2025 /PRNewswire/ — Everest Medicines (HKEX 1952.HK, “Everest”, or the “Company”), a biopharmaceutical company focused on the discovery, clinical development, manufacturing, and commercialization of innovative therapeutics, today announced that the first patient had received the first dose of EVM14 injection in a global, multi-center Phase I clinical trial of its Tumor-Associated Antigen (TAA) Cancer Vaccine EVM14 at NEXT Oncology Virginia in the United States, marking an important milestone in its clinical development globally. EVM14 is Everest Medicines’ first internally developed therapeutic mRNA cancer vaccine to obtain IND approvals from both China National Medical Products Administration (NMPA) and the U.S. Food and Drug Administration (FDA).
EVM14, an off-the-shelf therapeutic mRNA cancer vaccine, is developed based on the Company’s proprietary mRNA platform. It is designed to treat various squamous cell carcinomas, including squamous non-small cell lung cancer (sq-NSCLC) and head and neck squamous cell carcinoma (HNSCC). In the targeted cancer types, 96% of patients with sq-NSCLC and 97% of patients with HNSCC expressed at least one of the five target genes.1
The EVM14 Phase I trial is a dose-escalation study with two cohorts: EVM14 monotherapy and EVM14 in combination with PD-1 monoclonal antibody. The trial enrolls patients with pathologically confirmed unresectable, advanced, recurrent, or metastatic squamous non-small cell lung cancer (sq-NSCLC) and head and neck squamous cell carcinoma (HNSCC), who have experienced disease progression after receiving at least two prior lines of standard systemic therapy for advanced or metastatic disease. The primary endpoints are the safety and tolerability of EVM14, with secondary endpoints assessing preliminary efficacy. Monotherapy dose escalation is expected to be completed in 2026, with initial safety and tolerability data anticipated. The participating clinical sites include NEXT Oncology Virginia, The University of Texas MD Anderson Cancer Center, Memorial Sloan Kettering Cancer Center in the United States, and Shanghai Chest Hospital in China.
“The first patient dosed with EVM14 in the United States marks an important milestone in translating Everest’s internally developed therapeutic mRNA cancer vaccine from technological innovation into clinical development. With IND approval also secured in China, we will accelerate clinical progress in both the U.S. and China to build a more robust global evidence base for EVM14’s clinical value,” said Rogers Yongqing Luo, Chief Executive Officer of Everest Medicines. “Patients face limited treatment options with the current standard of care, underscoring a significant unmet medical need. As a TAA cancer vaccine, EVM14’s unique mechanism has the potential to complement existing treatments and help delay disease recurrence, offering hope for long-term cancer-free survival. We look forward to seeing this innovative therapy demonstrate promising potential in upcoming clinical trials, driving breakthroughs in cancer treatment and bringing new hope to patients worldwide.”
In preclinical studies, EVM14 induced a dose-dependent antigen-specific immune response in mice and significantly inhibited tumor growth in multiple syngeneic tumor models. Notably, EVM14 demonstrated the ability to induce immune memory and prevent tumor recurrence, offering hope for long-term cancer-free survival. Furthermore, preclinical data demonstrated that the combination of EVM14 with immune checkpoint inhibitors (ICIs), such as anti-PD-1 or anti-CTLA-4 antibodies, greatly enhanced the anti-tumor activity, reduced recurrence, and supports clinical exploration of combination therapies.
Everest Medicines continues to focus on achieving key breakthroughs in its core proprietary pipeline while accelerating the clinical development and global expansion of innovative assets with global rights. Leveraging its industry-leading mRNA therapeutic cancer vaccine platform, the Company is building a globally competitive R&D pipeline.
EVM 14 injection used in this trial was manufactured at Jiashan manufacturing site with the Company’s proprietary mRNA platform and in full compliance with global GMP standards. This demonstrates the Company’s end-to-end capabilities across the entire mRNA value chain, from proprietary antigen design, LNP delivery system, CMC process development to in-house manufacturing, laying a solid foundation for future pipeline advancement and commercialization.
Reference:
- The Cancer Genome Atlas (TCGA) data
About EVM14
EVM14 Injection is a preservative-free, sterile mRNA-lipid nanoparticle (mRNA-LNP) cancer vaccine. It is formulated with mRNA solution encoding 5 tumor-associated antigens (TAAs), encapsulated in a lipid nanoparticle system. After intramuscular injection, EVM14 is taken up by antigen-presenting cells (APCs) and translated into target antigens. These antigens are processed, presented to T cells by major histocompatibility complex (MHC) molecules and activated antigen-specific T cells. The activated T cells can migrate to tumor tissues, recognize, and kill the tumor cells expressing the target antigens.
About Everest Medicines
Everest Medicines is a biopharmaceutical company focused on discovering, developing, manufacturing and commercializing transformative pharmaceutical products and vaccines that address critical unmet medical needs for patients in global markets. The management team of Everest Medicines has deep expertise and an extensive track record from both leading global pharmaceutical companies and local Chinese pharmaceutical companies in high-quality discovery, clinical development, regulatory affairs, CMC, business development and operations. Everest Medicines has built a portfolio of potentially global first-in-class or best-in-class molecules in the company’s core therapeutic areas of renal diseases, infectious diseases, autoimmune disorders and ophthalmic diseases. For more information, please visit its website at www.everestmedicines.com.
Forward-Looking Statements
This news release may make statements that constitute forward-looking statements, including descriptions regarding the intent, belief or current expectations of the Company or its officers with respect to the business operations and financial condition of the Company, which can be identified by terminology such as “will,” “expects,” “anticipates,” “future,” “intends,” “plans,” “believes,” “estimates,” “confident” and similar statements. Such forward-looking statements are not guarantees of future performance and involve risks and uncertainties, or other factors, some of which are beyond the control of the Company and are unforeseeable. Therefore, the actual results may differ from those in the forward-looking statements as a result of various factors and assumptions, such as future changes and developments in our business, competitive environment, political, economic, legal and social conditions. The Company or any of its affiliates, directors, officers, advisors or representatives has no obligation and does not undertake to revise forward-looking statements to reflect new information, future events or circumstances after the date of this news release, except as required by law.
National Cancer Institute Broadens Partnership with Medidata to Bring Unmatched Continuity of Medical and Clinical Data for Lead Protocol Organizations

|
The Medidata Data Experience offering will enable the National Cancer Institute Lead Protocol Organizations to expedite the development of life-saving medicines for patients
SINGAPORE, Nov. 21, 2025 /PRNewswire/ — Medidata, a Dassault Systèmes brand and leading provider of clinical trial solutions to the life sciences industry, today announced that Medidata Health Record Connect and Medidata Rave Companion, both integral components of the Medidata Data Experience, will be available to a select set of National Cancer Institute (NCI) Lead Protocol Organizations (LPO). These solutions automatically enable patient data from electronic health records (EHR) systems to be elevated into the Medidata Platform, reducing administrative burdens, providing medical and clinical new levels of insights, and giving sites more time to focus on patient care.
“For years, the industry has struggled with a scalable way to use EHR in clinical studies. With Health Record Connect and Companion, we’re finally solving that challenge for NCI LPOs,” said Wayne Walker, senior vice president, Data Experience, Medidata. “By reducing duplicative tasks for research sites, we’re not only making it easier for patients to participate in trials but also accelerating timelines and improving overall data quality. This technology is a game-changer for bringing therapies to market more reliably and enhancing the experience for both researchers and patients.”
Health Record Connect and Rave Companion simplify access to a clinical trial site’s EHR data and enable automated and accurate completion of clinical trial site data entry tasks. These solutions are seamlessly integrated with the entire Data Experience, supporting both site and patient data collection and empowering NCI LPOs with the potential to input data up to 90% faster.
Medidata has supported the NCI Cancer Therapy Evaluation Program (CTEP) study portfolio with tools across the Medidata Platform for the past 17 years, strengthening the collaboration and reinforcing NCI’s ability to manage clinical operations effectively.
To learn more about the Medidata Data Experience and its solutions, visit here.
About Medidata
Medidata is powering smarter treatments and healthier people through digital solutions to support clinical trials. Celebrating 25 years of ground-breaking technological innovation across more than 36,000 trials and 11 million patients, Medidata offers industry-leading expertise, analytics-powered insights, and one of the largest clinical trial data sets in the industry. More than 1 million registered users across approximately 2,300 customers trust Medidata’s seamless, end-to-end platform to improve patient experiences, accelerate clinical breakthroughs, and bring therapies to market faster. A Dassault Systèmes brand (Euronext Paris: FR0014003TT8, DSY.PA), Medidata is headquartered in New York City and has been recognized as a Leader by Everest Group and IDC. Discover more at www.medidata.com. Listen to our latest podcast, from Dreamers to Disruptors, and follow us at @Medidata.
About Dassault Systèmes
Dassault Systèmes is a catalyst for human progress. Since 1981, the company has pioneered virtual worlds to improve real life for consumers, patients and citizens. With Dassault Systèmes’ 3DEXPERIENCE platform, 370,000 customers of all sizes, in all industries, can collaborate, imagine and create sustainable innovations that drive meaningful impact. For more information, visit: www.3ds.com.
About the National Cancer Institute (NCI)
NCI leads the National Cancer Program and NIH’s efforts to dramatically reduce the prevalence of cancer and improve the lives of people with cancer. NCI supports a wide range of cancer research and training extramurally through grants and contracts. The Cancer Therapy Evaluation Program (CTEP) manages a broad range of clinical trials that are closely integrated with preclinical discovery and development and biostatistical expertise fostered by other Division of Cancer Treatment and Diagnosis (DCTD) programs. Once a treatment approach has demonstrated promising efficacy and adequate safety in preclinical testing, CTEP-supported clinical trials networks and resources can move the therapy from first-in-human safety trials through definitive, randomized, controlled trials. CTEP also provides centralized infrastructure and support for other NCI-supported clinical trials networks, improving efficiency and reducing costs. For more information about cancer, please visit the NCI website at cancer.gov or call NCI’s contact center at 1-800-4-CANCER (1-800-422-6237).
Lazada Dominates Southeast Asia Authenticity-Driven ECommerce, Celebrates 170,000-Strong Brand Ecosystem at LazMall Brand Gala Dinner
|
SINGAPORE, Nov. 21, 2025 /PRNewswire/ — Lazada, Southeast Asia’s leading eCommerce platform, celebrated its 170,000-strong brand ecosystem at the LazMall Brand Gala 2025, cementing its position as the platform-of-choice for businesses in the region. A night of recognition, inspiration, and innovation, the event at Grand Hyatt Hotel Singapore brought together top brands, industry leaders, and key partners to celebrate the achievements shaping the region’s eCommerce landscape.

LazMall Brand Gala 2025 honours outstanding brand partners across Southeast Asia.
A Night to Celebrate Brand Excellence
The gala highlighted Lazada’s brand-led strategy and the commercial success brands achieve on Lazada:
- Million-dollar GMV brands surged 53% since 9.9, proving the platform drives tangible results.
- During 11.11, LazMall brands achieved a 39% GMV increase, with 11% YoY growth in LazMall buyers, demonstrating a clear shift toward trusted, high-quality brands.
- Average revenue per user (ARPU) grew 70%, with buyer penetration at 65%, demonstrating Lazada’s ability to attract and retain premium shoppers.
“Lazada is the engine powering Southeast Asia’s eCommerce growth,” said Iris Wei, Group President of Lazada. “Our partners succeed because Lazada delivers unparalleled reach, innovation, and results for international and local brands. From record-breaking mega sales to everyday shopper trust, our joint success is built on the dedication, innovation, and collaboration with our brand partners.”
Lazada Leading the Way in Innovation and Shopper Experience
Beyond celebrating achievements, the gala underscored Lazada’s vision for the future. Lazada’s next-generation capabilities to empower brands include:
- AI-powered tools for smarter product listings, marketing, and operational efficiency.
- Upgraded logistics and customer service to ensure faster delivery and seamless after-sales experiences.
With these innovations, Lazada continues to empower brands to scale with ease, delight consumers, and set new benchmarks for Southeast Asia’s eCommerce landscape.
About Lazada Group
Lazada Group is Southeast Asia’s pioneer eCommerce platform. For the last 13 years, Lazada has been accelerating progress in Indonesia, Malaysia, the Philippines, Singapore, Thailand and Vietnam through commerce and technology. Today, a thriving local ecosystem links about 160 million active users to more than one million actively-selling sellers every month, who are transacting safely and securely via trusted payments channels and Lazada Wallet, receiving parcels through a homegrown logistics network that has become the largest in the region.
Global South Talks: China Southern Power Grid Steps Up China-Africa Energy Cooperation
JOHANNESBURG, Nov. 21, 2025 /PRNewswire/ — According to a report by Xinhuanet:
On November 13, the Global South Media and Think Tank Forum China-Africa Partnership Conference got underway in Johannesburg, South Africa. A representative from China Southern Power Grid Co., Ltd. (CSG) was invited to address the “Global South Talks” session during the opening ceremony, sharing the company’s on-the-ground experience in power-grid cooperation with countries across the Global South.
Sun Shengjun, Project General Manager of the Africa and Europe Regional Development Department at China Southern Power Grid International, described CSG’s experience and efforts to deepen China–Africa energy ties in Cairo, Egypt. In 2023, Sun and his team arrived in Cairo to address chronic problems in the local power grid, including high line losses and poor operating performance. They progressively introduced CSG’s operational measures for cutting distribution network losses and rolled out practical, scalable and replicable “CSG Solutions” for the local utility. In addition to its technical efforts, CSG has focused on developing a skilled local workforce through targeted training programs and technical knowledge-sharing sessions. By matching its technology to on-the-ground operating realities and investing in workforce training, the company has sought to align its mature technical systems with local needs while fostering homegrown technical capabilities, laying the groundwork for long-term engagement.
Sun said that CSG does not regard energy cooperation as a one-way street, but as a partnership rooted in mutual benefit and shared growth. Looking ahead, the company says it will continue to provide its technologies and management expertise to Global South countries, aimed at deepening China–Africa energy cooperation and supporting plans for broader collaboration across the Global South.
Accident in Texas Leaves Two Lao-American Monks in Critical Condition

Two Buddhist monks participating in the nationwide Walk of Peace initiative to Washington, D.C., were critically injured on 19 November after a truck struck a pilot vehicle accompanying the group along US-90 in Dayton, Texas.
Among those hurt is Maha Dam Phommasan, Abbot of Wat Buddha Khanti in Atlanta, who remains in critical condition. One monk was airlifted to a Houston-area hospital and is undergoing surgery, while the other sustained minor injuries and was transported by ambulance.
The Laotian American Society confirmed the incident, noting Abbot Maha Dam Phommasan’s longstanding role as a respected spiritual leader and dedicated supporter of community programs.
Organizers reported that “the monks remain resilient” and plan to continue their journey once the injured monk’s condition stabilizes.
Emergency responders acted quickly to provide treatment, and the driver of the truck involved is cooperating with authorities.
The Society expressed its sympathy to all those affected and pledged ongoing support for the monks, their families, and their communities. Supporters around the world have also sent prayers and messages of encouragement.
