Home Blog Page 1751

Vinhomes Green Paradise recognized as the first official participant of the global campaign “7 Wonders of Future Cities”


HO CHI MINH CITY, VIETNAM – Media OutReach Newswire – 20 November 2025 – Vinhomes Green Paradise has been officially recognized as the very first Official Participant of the global campaign “7 Wonders of Future Cities”, launched by New7Wonders. Surpassing 90 proposals and applications from around the world to become the earliest project to satisfy the participation criteria, Vinhomes Green Paradise affirms its vision and international stature as a pioneering model for the future of 21st-century urban development.

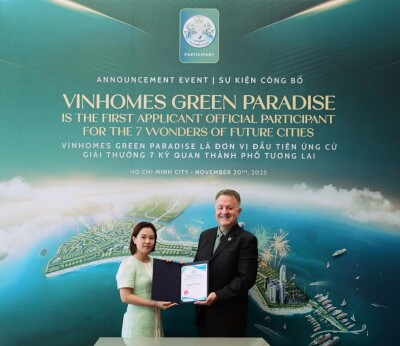
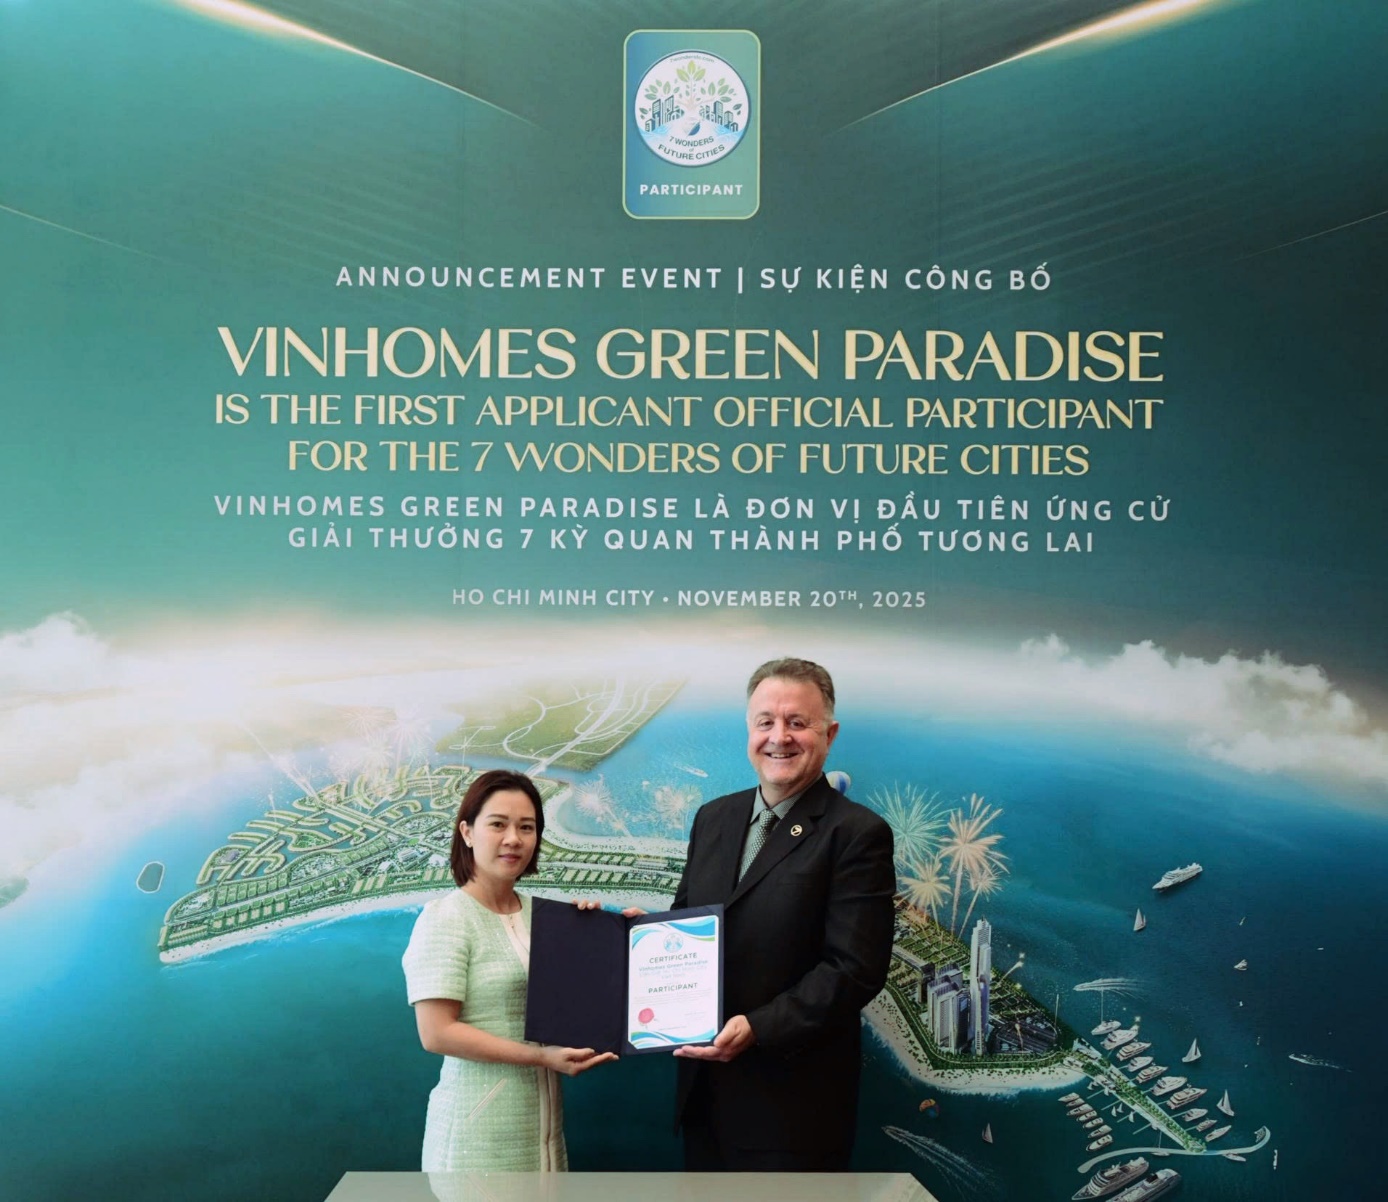
Ms. Nguyen Thu Hang, CEO of Vinhomes, and Mr. Jean-Paul de la Fuente, Director of New7Wonders and Chairman of the “7 Wonders of Future Cities” campaign at the ceremony presenting the Official Participant certificate for the Vinhomes Green Paradise project within the global “7 Wonders of Future Cities” campaign.

Since the campaign officially opened on October 31, 2025, a total of 90 proposals and applications have been submitted globally. Among them, Vinhomes Green Paradise is honored to be the first project acknowledged by New7Wonders as an Official Participant.

According to the organization’s evaluation framework, the Vietnamese representative distinguishes itself across three core pillars: Environmental & Nature, Smart City and Human-Centric development.

Vinhomes Green Paradise stands out as a strong applicant in the global campaign “7 Wonders of Future Cities”

Under the Environmental & Nature criterion, Vinhomes Green Paradise benefits from a rare coastal-forest ecosystem, bordered by the Can Gio Sea and the UNESCO-recognized 75,000-hectare Can Gio Mangrove Biosphere Reserve. The project spans 2,870 hectares with an exceptionally low construction density of only 16 percent. Most of the land is reserved for greenery and water surfaces, including a natural seawater Lagoon Lake of up to 800 hectares at the heart of the development. The entire complex enjoys a remarkable 121-kilometer shoreline, establishing an ecological environment comparable to leading coastal megacities worldwide.

In relation to the Smart City criterion, Vinhomes Green Paradise integrates IoT, Big Data and Artificial Intelligence into governance, operations and environmental monitoring, thereby forming a modern, safe and civilized urban environment.

Regarding the Human-Centric criterion, the project embraces a people-first development philosophy expressed through a comprehensive ecosystem of internationally benchmarked services in healthcare, education, senior living, culture, sports and entertainment.

Residents will experience world-class medical services provided by Vinmec in partnership with Cleveland Clinic (USA), global-standard education through Vinschool and Brighton College (UK), premium senior-living services via Vin New Horizon, and a vibrant cultural and lifestyle landscape that includes the 7-hectare Blue Waves Theatre, sports (two 18-hole golf courses designed by firms founded by two world-renowned figures, Tiger Woods and Robert Trent Jones), the 122-hectare VinWonders seaside complex and the lively Cosmo Bay culinary, retail and nightlife district.

Speaking at the certification ceremony, Mr. Jean-Paul de la Fuente, Director of New7Wonders and Chairman of the “7 Wonders of Future Cities”, shared: “New7Wonders is happy to announce Vinhomes Green Paradise as the first applicant Official Participant in the 7 Wonders of Future Cities, joining our global campaign to choose the seven cities and developments that will inspire the future of humanity. Vinhomes Green Paradise meets all the key criteria of this campaign, as well as being a flagship mission of a pioneering and leading group in Asia and the world that is already actively delivering ESG and beyond across many of its activities. We are presenting the certificate of its first applicant Official Participant status in person, as a symbolic moment for the entire campaign, and also as it gives us a chance to visit the project in development, to see how it is shaping a truly extraordinary urban environment where nature, people, and technology are seamlessly interwoven and elevated – precisely what every Participant in the 7 Wonders of Future Cities should aspire to be!”

A key differentiator of Vinhomes Green Paradise lies in its elevated development strategy. Rather than merely complying with conventional global ESG standards, the project pioneers the enhanced ESG++ framework, built upon five pillars: Environment, Social, Governance, Regeneration and Climate Adaptation.

This green vision is applied rigorously from the construction phase. The project adopts advanced, low-impact technologies, most notably the K-DPM solution that transforms soft mud into durable reclamation material, significantly reducing indirect emissions, limiting pollution and eliminating the dependence on natural sand extraction.

When operational, the entire urban system is designed to be comprehensively decarbonized, targeting 100 percent clean electricity sourced from offshore wind power located 20 kilometers from the coast, complemented by solar energy and battery storage systems. Transportation within the development will be fully net-zero, comprising electric cars, electric motorbikes, electric buses, electric bicycles and electric canoes, as well as a high-speed rail link connecting directly to the center of Ho Chi Minh City.

Beyond strict compliance with environmental protection standards, Vinhomes Green Paradise prioritizes the conservation and regeneration of local flora and fauna, in harmony with Ho Chi Minh City’s climate adaptation strategy. A dedicated Forest Regeneration and Climate Resilience Fund has been established to support long-term research, restoration and climate-response initiatives, with a particular focus on regenerating the Can Gio forest to form a protective green belt for the entire development.

With these orientations, Vinhomes Green Paradise aspires to achieve BREEAM and ISO 37122 certifications, two of the world’s most rigorous green and smart city benchmarks, thereby positioning itself as a global ESG++ symbol and a benchmark for next-generation coastal cities.

Ms. Nguyen Thu Hang, CEO of Vinhomes, stated: “Environmental & Nature, Smart City and Human-Centric development are the three foundational pillars of Vinhomes Green Paradise. These pillars are not only our competitive advantage in the ‘7 Wonders of Future Cities’ campaign, but also the guiding compass for Vinhomes as we shape a world-class urban icon, a truly exceptional living environment for global citizens and a representation of aspiration for a sustainable future.”

The recognition of Vinhomes Green Paradise as the first Official Participant represents a significant milestone, affirming the project’s vision, capabilities and international relevance. With its robust foundations, the development stands as a rising Asian highlight in the global journey toward identifying the “7 Wonders of Future Cities”.

The global voting phase officially begins on October 31, 2026, with the final announcement scheduled for October 31, 2027.

This election marks another landmark initiative from New7Wonders, the internationally renowned organization behind the 2011 “New 7 Wonders of Nature” campaign. The “7 Wonders of Future Cities” initiative is expected to become a global phenomenon, engaging hundreds of millions of participants in redefining the urban icons of a new era, one shaped by greener, smarter and more human-centric cities.

Hashtag: #Vingroup

The issuer is solely responsible for the content of this announcement.

ZJLD Group Honored with Dual Accolades: “ESG Special Commendation Award” and “UN Sustainability Impact Award for SDGs”

Recognized by Two Prestigious Institutions for the Group’s Outstanding ESG Governance and Sustainable Business Contributions


HONG KONG SAR – Media OutReach Newswire – 20 November 2025 – ZJLD Group Inc. (“ZJLD” or the “Company”, SEHK stock code: 06979.HK), the first baijiu enterprise listed on the Hong Kong Stock Exchange, is proud to announce its recent recognition with two esteemed awards: the “ESG Special Commendation Award” at the 2025 Best Corporate Governance and ESG Awards hosted by the Hong Kong Institute of Certified Public Accountants (HKICPA), and the “UN Sustainability Impact Award for SDGs” presented by the APEC Digital Trade and Business Innovation Forum with Excellence Award for Corporate. These dual honors, conferred by a leading Hong Kong professional institution and a premier Asia-Pacific international platform, fully underscore ZJLD’s excellence in ESG governance and its enduring commitment to sustainable development.

These accolades not only fully affirm the Group’s long-term strategic achievements in sustainability but also signify that Chinese baijiu enterprises are reaching both local industry benchmarks and internationally recognised ESG standards. As Hong Kong’s statutory accounting body, HKICPA has hosted the Best Corporate Governance and ESG Awards since 2000, establishing a gold standard for corporate governance, disclosure, and reporting across sectors. ZJLD’s recognition reflects the Institute’s endorsement of the Group’s comprehensive ESG framework, from top-level design to frontline implementation. Meanwhile, as a premier Asia-Pacific “Culture + Business” innovation summit, the APEC Digital Trade and Business Innovation Forum’s conferral of this honor on ZJLD also marks that its sustainable development model has aligned with international best practices and has earned high regard within regional cooperation mechanisms.

Mr. Ng Paul, Vice President of International Affairs at ZJLD Group, remarked, “We are deeply honored to receive these two prestigious awards and sincerely thank HKICPA and the APEC Forum for their recognition. This is not only a mark of distinction but also a call to action—affirming the market’s strong endorsement of our ESG-driven approach to high-quality development.” He added that the Group will take this milestone as a new starting point to further embed ESG principles across its operations and value chain. “From advancing green production through packaging innovation and carbon reduction, to expanding agricultural empowerment and co-developing ESG governance mechanisms with suppliers, and leveraging global platforms like APEC to promote China’s baijiu sustainability model across the Asia-Pacific—we are committed to delivering long-term value for our shareholders, partners, employees, and society at large.”

Hashtag: #ZJLD

The issuer is solely responsible for the content of this announcement.

About ZJLD Group Inc.

Zhen Jiu was established in 1975 in Zunyi, Guizhou, China’s primary production area of sauce-aroma baijiu. In 1988, it was honored with the National Quality Award at the 5th National Wine Appreciation Conference. In the same year, it was announced by the Protocol Department of the Ministry of Foreign Affairs, the Communication Department of the Ministry of Economy and Trade, and the Great Hall of the People Management Bureau to become one of the two sauce-aroma baijiu served at state banquets. It is also known as one of the “Three Representative Baijiu Brands in Guizhou”.

ZJLD Group Inc. is a leading baijiu group in China that is devoted to offering premium baijiu products, including sauce-aroma, mixed-aroma, and strong-aroma. In 2023, the Company was the third-largest private baijiu company in China in terms of revenue, according to Frost & Sullivan statistics. It also was the largest IPO fundraising company on the Hong Kong Stock Exchange in 2023. The Company operates four baijiu brands in China, including two national baijiu, Zhen Jiu and Li Du, and two regional brands, Xiangjiao and Kaikouxiao. ZJLD prides itself on inheriting the time-honored baijiu-brewing techniques and reinvigorating them to develop iconic products. It strives to create a wide variety of aromatic and mellow baijiu products to meet the diverse preferences of consumers, seize broader market opportunities, and promote traditional Chinese baijiu culture.

TOJOY leads over 20 Chinese enterprise representatives to Saudi Arabia to explore new collaborations and global market opportunities


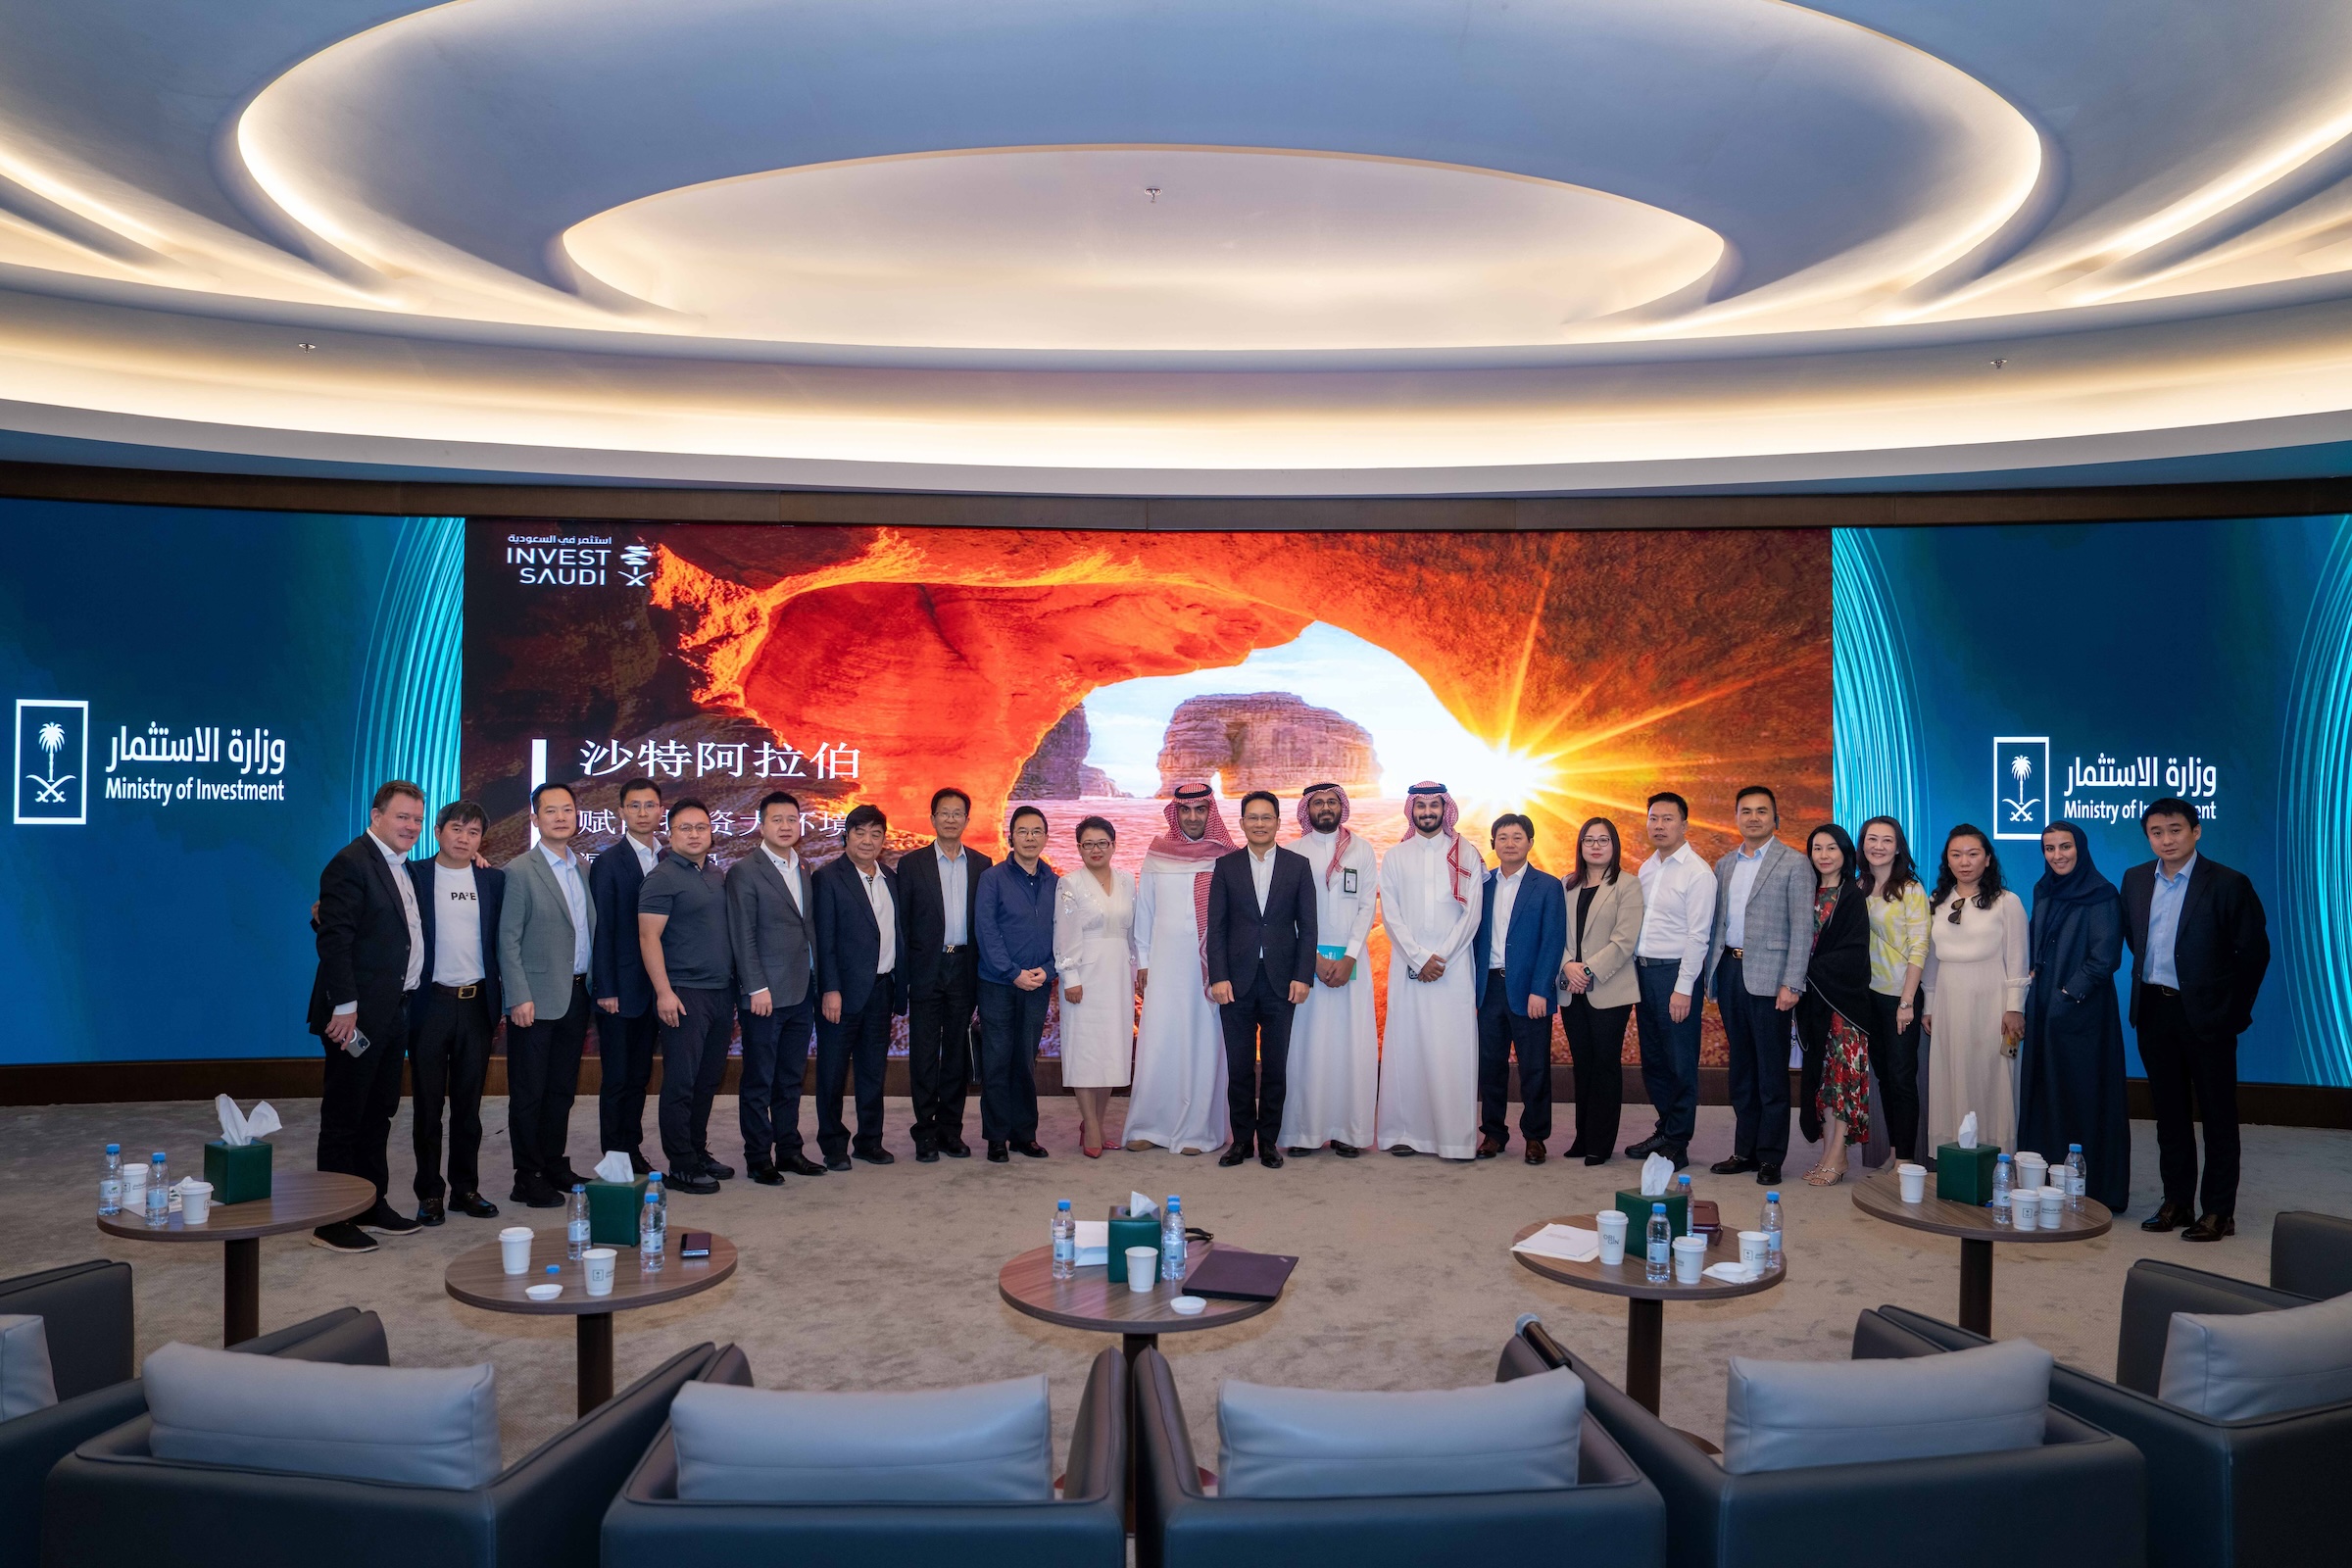
HONG KONG SAR – Media OutReach Newswire – 20 November 2025 – Recently, a delegation of Chinese enterprises, organized by TOJOY Shared Smart Enterprise Service, a leading Chinese enterprise service platform, held business talks with the Ministry of Investment for Saudi Arabia (MISA) in Riyadh, the capital of Saudi Arabia. Mr. Ge Jun, Chairman of the Board and CEO of TOJOY, led more than 20 representatives from companies, including Zhejiang Great Wall Mixers Equipment Co., Ltd. and Longqing Southeast (Hainan) Green Building Co., Ltd. The discussions covered investment, infrastructure, healthcare, artificial intelligence and other sectors. Mr. Fahad Mansour AlHashem, Assistant Deputy Minister Fahd Mansour AlHashem and other officials attended the meeting. The two sides held pragmatic discussions on Saudi Arabia’s investment environment, industrial policies, and cooperation opportunities between Chinese and Saudi enterprises.

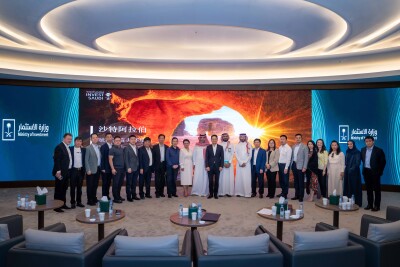
GE Jun, the Chairman of the Board and CEO of TOJOY, led over 20 Chinese enterprise representatives to visit Saudi Arabia, resulting in preliminary partnership agreements.

This visit to Saudi Arabia followed the delegation’s trip to Dragon Mart, the largest Chinese market and trading hub in Dubai and UAE, on November 4. During the visit, Mr. Ge Jun said that TOJOY has long focused on supporting the global development of Chinese companies. This delegation represented companies from various sectors, including manufacturing, building materials, technology and trade, with the aim of fostering resource complementarity through pragmatic cooperation between Chinese enterprises and the Middle Eastern markets.

During the meeting, Mr. Fahad Mansour AlHashem provided a comprehensive overview of Saudi Arabia’s current foreign investment policies. He noted that more than 90% of sectors in Saudi Arabia allow 100% foreign ownership, no minimum registered capital requirements in most industries, and a range of incentives—such as 30-year corporate income tax exemptions and salary subsidies for local employees—are available. Besides, business registration has been fully digitalized, making the process more efficient and convenient.

Mr. Ge Jun said that Saudi Arabia, as a major economy in the Middle East, is actively advancing economic diversification under the Saudi Vision 2030, focusing on high-growth sectors such as renewable energy, information and communications technology, healthcare, and infrastructure construction. These areas align closely with the strengths of Chinese enterprises in technology development, industrial integration and large-scale operations. He added that TOJOY will leverage its platform resources to help Chinese enterprises better understand the local policies and business environments, promoting cooperation that extends from the product level to broader industrial-chain collaborations.

Mr. Ge Jun also noted that Chinese enterprises should take a long-term perspective when expanding into Middle Eastern markets, emphasizing the importance of localization and regulatory compliance. Several participating companies have already begun the process of registering their businesses in Saudi Arabia.

The delegation’s discussions with MISA resulted in preliminary cooperation intentions in infrastructure and smart transportation, healthcare, artificial intelligence and other fields. MISA committed that it would assign dedicated officials to facilitate coordination, while TOJOY will continue organizing curated visits to the Middle East, fostering long-term partnerships between Chinese and Saudi enterprises.

Hashtag: #TOJOY #MIDDLEEAST #SAUDI #DUBAI #UAE

The issuer is solely responsible for the content of this announcement.

Tune Protect and Ticket2U Expand to Indonesia with Ticket Refund Protection and Sports PA


JAKARTA, INDONESIA – Media OutReach Newswire – 20 November 2025 – Tune Protect Re (“Tune Protect”), a leading Travel & Lifestyle reinsurance subsidiary of Tune Protect Group Berhad, has extended its partnership with Ticket2U, Southeast Asia’s premier ticketing platform, to Indonesia with the launch of Ticket Refund Protection and Sports Personal Accident (PA). This milestone aligns with Tune Protect’s regional expansion plan across Southeast Asia, bringing Indonesia insurance protection for eventgoers through Ticket2U’s digital platform after the successful roll out in Malaysia earlier this year.

(Left to Right) Janet Chin, Chief Executive Officer of Tune Protect Re and YC Chia, Managing Director of Ticket2U Sdn Bhd

This regional expansion reflects Tune Protect’s continued commitment to making insurance simple, accessible and relevant to the digital lifestyles of today’s consumers. By embedding protection directly into Ticket2U’s ecosystem, Tune Protect empowers eventgoers to plan and enjoy their experiences with greater confidence and peace of mind.

“Following the success of Ticket Refund Protection and Sports PA in Malaysia, we are pleased to extend the same to Indonesia, a country with a vibrant and growing live event scene. Research shows that the majority of Indonesians enjoy attending concerts and live events, reflecting a strong appetite for entertainment and travel experiences. With this collaboration, we aim to give eventgoers added peace of mind, knowing they are protected against unforeseen circumstances. This launch further strengthens our regional presence as we continue to build partnerships that make protection more accessible across Southeast Asia,” said Janet Chin, Chief Executive Officer of Tune Protect Re.

According to Jakpat’s Music Concert Trends & Fan Behaviours 2025 survey[1], interest in live entertainment is surging, with Millennials and Gen Z forming the majority of concertgoers and 81% of respondents saying they enjoy attending music festivals. Recognising this momentum, Tune Protect and Ticket2U are introducing an added layer of assurance for fans and travellers alike.

“Ticket2U Indonesia aims to build a smarter, safer, and more reliable ticketing ecosystem for both organisers and attendees. Through our partnership with Tune Protect, we are delivering greater value and confidence to everyone who joins an event through our platform,” said YC Chia, Managing Director of Ticket2U Sdn Bhd.

The Ticket Refund Protection is available to all Ticket2U customers in Indonesia covering a wide range of events, including concerts, festivals, marathons, runs, conferences, exhibitions, and sports tournaments. Offered at only 5% of the ticket price, it protects against unforeseen circumstances that may prevent attendance.

Purchasing Ticket Refund Protection is quick and effortless:

  1. Select an event ticket on Ticket2U Indonesia[2].
  2. Opt-in for ‘Ticket Refund Protection’ at checkout.
  3. Complete the purchase, and coverage is automatically activated.

Covering a comprehensive range of unexpected situations, Ticket Refund Protection ensures that eventgoers receive a full refund if they are unable to attend due to circumstances such as illness, accidents, natural disasters, home emergencies, or other qualifying disruptions.

For sports enthusiasts, Sports PA (Personal Accident Insurance) is also available as an optional add-on, providing financial protection for accidental injuries sustained during sports-related events, ensuring peace of mind while staying active. The Sports PA protection is the first of its kind to be offered in the events scene in Indonesia.

The claims process is equally seamless:

  1. Submit a claim directly to PT Asuransi Dayin Mitra (ADM)[3] with the required documentation.
  2. Claims are reviewed, and eligible refunds are issued promptly.

“Beyond protecting local eventgoers, our collaboration with Ticket2U also encourages international audiences to travel to Indonesia to attend events with greater confidence. By offering coverage that protects against last-minute cancellations or disruptions, we are giving travellers the peace of mind to plan their trips without worrying about unexpected setbacks. This reflects our vision of making protection simple and relevant for today’s connected and mobile lifestyles across borders,” added Janet.

The partnership between Tune Protect and Ticket2U will continue to expand into other Southeast Asian markets, reinforcing both companies’ shared vision of delivering innovative, digital-first solutions that enhance customer experience and build confidence in event participation.

For more information on Ticket Refund Protection and Sports PA, visit https://www.ticket2u.id/blog/291


[2] Applicable to events that have opted in to offer Ticket Refund Protection
[3] PT Asuransi Dayin Mitra Tbk is the local insurance partner underwriting the insurance products

Hashtag: #TuneProtect

The issuer is solely responsible for the content of this announcement.

About Tune Protect Re Limited

Tune Protect Re Ltd (“TPR”), a wholly owned subsidiary of Tune Protect Group Berhad, was established in 2011 specialising in non-life reinsurance businesses, particularly in Travel and Lifestyle. Its strengths in Travel and Lifestyle are demonstrated through successful partnerships, facilitating market activation for its partners, notably within the airline sector. TPR strategically partners with underwriters across more than 50 countries, complemented by a comprehensive network of Third-Party Administrators (TPAs).

TPR offers an array of innovative travel products including parametric travel solutions and various lifestyle offerings. Additionally, through its retakaful window, TPR actively underwrites and supports reinsurance arrangements for Hajj and Umrah travel products in collaboration with insurance partners. Beyond its reinsurance services, TPR is backed by strong digital capabilities and technology to enable seamless digital experiences for its partners, encompassing the entirety of the sales process to claims management.

For more information, please visit

About Ticket2U

Ticket2U is Southeast Asia’s leading provider of innovative event ticketing solutions, offering a comprehensive platform for event organizers and attendees. From ticket sales to event management and customer support, Ticket2U delivers a seamless experience for events of all sizes, including concerts, festivals, conferences, and sports. Renowned for its reliability, user-friendly interface, and commitment to customer satisfaction, Ticket2U empowers event organizers to streamline operations and enhance the guest experience. For more information, visit .

ATRenew Inc. Reports Unaudited Third Quarter 2025 Financial Results

SHANGHAI, Nov. 20, 2025 /PRNewswire/ — ATRenew Inc. (“ATRenew” or the “Company”) (NYSE: RERE), a leading technology-driven pre-owned consumer electronics transactions and services platform in China, today announced its unaudited financial results for the three months ended September 30, 2025.

Third Quarter 2025 Highlights

  • Total net revenues grew by 27.1% to RMB5,149.2 million (US$723.3 million) from RMB4,051.2 million in the same period of 2024.
  • Income from operations was RMB120.8 million (US$17.0 million), representing an increase of 385.1% year -on-year from RMB24.9 million in the same period of 2024. Adjusted income from operations (non-GAAP)[1] was RMB140.3 million (US$19.7 million), representing an increase of 34.9% year-on-year from RMB104.0 million in the same period of 2024.
  • Number of consumer products transacted[2] was 10.9 million compared to 9.1 million in the same period of 2024.

Mr. Kerry Xuefeng Chen, Founder, Chairman, and Chief Executive Officer of ATRenew, commented, “In the third quarter of 2025, ATRenew once again delivered impressive results. Total revenue for the quarter reached a record high of RMB5,149 million, up 27.1% year-on-year. With a strategic focus on ‘scenario + supply chain’ capabilities, we have secured high-quality supplies, accelerated the expansion of our fulfillment capabilities, and achieved a higher proportion of compliant refurbishment and retail operations that deliver greater value to the industry. With enhanced transaction efficiency and user experience across our marketplaces, we capitalized on the rapid and healthy development of the pre-owned consumer electronics industry, thereby solidifying the foundation of the company’s core business. At the same time, leveraging AHS Recycle’s brand power as China’s leading brand for recycle-and-reuse, we are innovatively exploring multi-category recycling services under the platform model, with a focus on the long-term opportunities presented by the future circular economy.”

Mr. Rex Chen, Chief Financial Officer of ATRenew, added, “We are pleased to report that ATRenew achieved improved profitability in the third quarter of 2025, with adjusted income from operations increasing by 34.9% year-over-year to RMB140 million. Through effective business execution and refined operational management, we achieved year-over-year and quarter-over-quarter improvements across multiple profitability metrics. As user acceptance of recycling and trade-in services continues to grow, we expect to leverage economies of scale in our fulfillment capabilities to gradually enhance our overall profitability. In alignment with the Company’s financial performance and our ongoing commitment to creating value, we are also implementing a three-year shareholder return plan as we previously announced.”

1.  For all measures labeled as “non-GAAP” on this page and following pages, please see “Unaudited Reconciliations of GAAP and Non-GAAP Results” for more information.

2. “Number of consumer products transacted” represents the number of consumer products distributed to merchants and consumers through transactions on the Company’s PJT Marketplace, Paipai Marketplace and other channels the Company operates in a given period, prior to returns and cancellations, excluding the number of consumer products collected through AHS Recycle; a single consumer product may be counted more than once according to the number of times it is transacted on PJT Marketplace, Paipai Marketplace and other channels the Company operates through the distribution process to end consumer.

Third Quarter 2025 Financial Results

REVENUE

Total net revenues increased by 27.1% to RMB5,149.2 million (US$723.3 million) from RMB4,051.2 million in the same period of 2024.

  • Net product revenues increased by 28.7% to RMB4,726.3 million (US$663.9 million) from RMB3,672.2 million in the same period of 2024. The increase was primarily attributable to an increase in the sales of pre-owned consumer electronics through the Company’s online channels.
  • Net service revenues increased by 11.6% to RMB422.8 million (US$59.4 million), compared to RMB379.0 million in the same period of 2024. This increase was primarily due to an increase in the service revenue generated from multi-category recycling business and Paipai Marketplace.

OPERATING COSTS AND EXPENSES

Operating costs and expenses were RMB5,033.2 million (US$707.0 million), compared to RMB4,028.1 million in the same period of 2024, representing an increase of 25.0%.

  • Merchandise costs were RMB4,094.2 million (US$575.1 million), compared to RMB3,242.8 million in the same period of 2024, representing an increase of 26.3%. The increase was primarily due to the growth in product sales.
  • Fulfillment expenses were RMB437.1 million (US$61.4 million), compared to RMB347.3 million in the same period of 2024, representing an increase of 25.9%. The increase was primarily due to (i) an increase in personnel costs and logistics expenses as the Company conducted more recycling and transaction activities compared with the same period of 2024, and (ii) an increase in operation related expenses as the Company expanded its store networks and operation center capacity in the third quarter of 2025.
  • Selling and marketing expenses were RMB363.9 million (US$51.1 million), compared to RMB315.3 million in the same period of 2024, representing an increase of 15.4%. The increase was primarily due to (i) an increase in advertising expenses and promotional campaign related expenses, and (ii) an increase in commission expenses in relation to channel service fees. The increase was partially offset by a decrease in amortization of intangible assets resulting from assets and business acquisitions resulting from the maturity of major remaining intangible assets in the second quarter of 2025.
  • General and administrative expenses were RMB74.1 million (US$10.4 million), compared to RMB69.3 million in the same period of 2024, representing an increase of 6.9%. The increase was primarily due to (i) an increase in tax and surcharges, and (ii) an increase in consultant fees. The increase was partially offset by a decrease in share-based compensation.
  • Technology and content expenses were RMB63.8 million (US$9.0 million), compared to RMB53.4 million in the same period of 2024, representing an increase of 19.5%. The increase was primarily due to an increase in personnel costs.

INCOME FROM OPERATIONS

Income from operations was RMB120.8 million (US$17.0 million), an increase of 385.1% from RMB24.9 million in the same period of 2024.

Adjusted income from operations (non-GAAP) was RMB140.3 million (US$19.7 million), an increase of 34.9% from RMB104.0 million in the same period of 2024.

NET INCOME

Net income was RMB90.8 million (US$12.8 million), an increase of 407.3% from RMB17.9 million in the same period of 2024.

Adjusted net income (non-GAAP) was RMB110.2 million (US$15.5 million), an increase of 22.3% from RMB90.1 million in the same period of 2024.

BASIC AND DILUTED NET INCOME PER ORDINARY SHARE

Basic and diluted net income per ordinary share were RMB0.56 (US$0.08) and RMB0.56 (US$0.08), compared to RMB0.11 and RMB0.11 in the same period of 2024.

Adjusted basic and diluted net income per ordinary share (non-GAAP) were RMB0.68 (US$0.10) and RMB0.68 (US$0.10), compared to RMB0.56 and RMB0.55 in the same period of 2024.

CASH AND CASH EQUIVALENTS, RESTRICTED CASH, SHORT-TERM INVESTMENTS AND FUNDS RECEIVABLE FROM THIRD PARTY PAYMENT SERVICE PROVIDERS

Cash and cash equivalents, restricted cash, short-term investments and funds receivable from third party payment service providers were RMB2,537.6 million (US$356.4 million) as of September 30, 2025, as compared to RMB2,919.6 million as of December 31, 2024.

Business Outlook

For the fourth quarter of 2025, the Company currently expects its total revenues to be between RMB6,080.0 million and RMB6,180.0 million, representing an increase of 25.4% to 27.4% year-over-year. This forecast only reflects the Company’s current and preliminary views on the market and operational conditions, which are subject to change.

Recent Developments

On June 30, 2025, ATRenew announced that the board of directors of the Company (the “Board”) has authorized a new share repurchase program, under which the Company may repurchase up to US$50 million of its shares (including ADSs) over a 12-month period starting from June 30, 2025. During the third quarter of 2025, ATRenew repurchased a total of approximately 0.5 million ADSs for approximately US$2.1 million.

Conference Call Information

The Company’s management will hold a conference call on Thursday, November 20, 2025 at 07:00 A.M. Eastern Time (or 08:00 P.M. Beijing Time on the same day) to discuss the financial results. Listeners may access the call by dialing the following numbers:

International:

1-412-317-6061

United States Toll Free:

1-888-317-6003

Mainland China Toll Free:

4001-206115

Hong Kong Toll Free:

800-963976

Access Code:

2918322

The replay will be accessible through November 27, 2025 by dialing the following numbers:

International:

1-412-317-0088

United States Toll Free:

1-855-669-9658

Access Code:

3466263

A live and archived webcast of the conference call will also be available at the Company’s investor relations website at ir.atrenew.com.

About ATRenew Inc.

Headquartered in Shanghai, ATRenew Inc. operates a leading technology-driven pre-owned consumer electronics transactions and services platform in China under the brand ATRenew. Since its inception in 2011, ATRenew has been on a mission to give a second life to all idle goods, addressing the environmental impact of pre-owned consumer electronics by facilitating recycling and trade-in services, and distributing the devices to prolong their lifecycle. ATRenew’s open platform integrates C2B, B2B, and B2C capabilities to empower its online and offline services. Through its end-to-end coverage of the entire value chain and its proprietary inspection, grading, and pricing technologies, ATRenew sets the standard for China’s pre-owned consumer electronics industry. ATRenew is a participant in the United Nations Global Compact, and adheres to its principles-based approach to responsible business.

Exchange Rate Information

This announcement contains translations of certain RMB amounts into U.S. dollars at specified rates solely for the convenience of the reader. Unless otherwise noted, all translations from RMB to U.S. dollars are made at a rate of RMB7.1190 to US$1.00, the exchange rate set forth in the H.10 statistical release of the Board of Governors of the Federal Reserve System as of September 30, 2025.

Use of Non-GAAP Financial Measures

The Company also uses certain non-GAAP financial measures in evaluating its business. For example, the Company uses adjusted income from operations, adjusted net income and adjusted net income per ordinary share as supplemental measures to review and assess its financial and operating performance. The presentation of these non-GAAP financial measures is not intended to be considered in isolation, or as a substitute for the financial information prepared and presented in accordance with U.S. GAAP. Adjusted income from operations is income (loss) from operations excluding the share-based compensation expenses and amortization of intangible assets resulting from assets and business acquisitions. Adjusted net income is net income (loss) excluding the share-based compensation expenses and amortization of intangible assets resulting from assets and business acquisitions and tax effects of amortization of intangible assets resulting from assets and business acquisitions. Adjusted net income per ordinary share is adjusted net income attributable to ordinary shareholders divided by weighted average number of shares used in calculating net income (loss) per ordinary share.

The Company presents non-GAAP financial measures because they are used by the Company’s management to evaluate the Company’s financial and operating performance and formulate business plans. The Company believes that adjusted income from operations and adjusted net income help identify underlying trends in the Company’s business that could otherwise be distorted by the effect of certain expenses that are included in income (loss) from operations and net income (loss). The Company also believes that the use of non-GAAP financial measures facilitates investors’ assessment of the Company’s operating performance. The Company believes that adjusted income from operations and adjusted net income provide useful information about the Company’s operating results, enhance the overall understanding of the Company’s past performance and future prospects and allow for greater visibility with respect to key metrics used by the Company’s management in its financial and operational decision making.

The non-GAAP financial measures are not defined under U.S. GAAP and are not presented in accordance with U.S. GAAP. The non-GAAP financial measures have limitations as analytical tools. One of the key limitations of using non-GAAP financial measures is that they do not reflect all items of income and expense that affect the Company’s operations. The share-based compensation expenses, amortization of intangible assets resulting from assets and business acquisitions and tax effects of amortization of intangible assets resulting from assets and business acquisitions have been and may continue to be incurred in the Company’s business and is not reflected in the presentation of non-GAAP financial measures. Further, the non-GAAP measures may differ from the non-GAAP measures used by other companies, including peer companies, potentially limiting the comparability of their financial results to the Company’s. In light of the foregoing limitations, the non-GAAP financial measures for the period should not be considered in isolation from or as an alternative to income from operations, net income, and net income attributable to ordinary shareholders per share, or other financial measures prepared in accordance with U.S. GAAP.

The Company compensates for these limitations by reconciling the non-GAAP financial measures to the nearest U.S. GAAP performance measures, which should be considered when evaluating the Company’s performance. For reconciliations of these non-GAAP financial measures to the most directly comparable GAAP financial measures, please see the section of the accompanying tables titled, “Reconciliations of GAAP and Non-GAAP Results.”

Safe Harbor Statement

This press release contains statements that may constitute “forward-looking” statements pursuant to the “safe harbor” provisions of the U.S. Private Securities Litigation Reform Act of 1995. These forward-looking statements can be identified by terminology such as “will,” “expects,” “anticipates,” “aims,” “future,” “intends,” “plans,” “believes,” “estimates,” “likely to” and similar statements. Among other things, quotations in this announcement, contain forward-looking statements. ATRenew may also make written or oral forward-looking statements in its periodic reports to the U.S. Securities and Exchange Commission (the “SEC”), in its annual report to shareholders, in press releases and other written materials and in oral statements made by its officers, directors or employees to third parties. Statements that are not historical facts, including statements about ATRenew’s beliefs, plans and expectations, are forward-looking statements. Forward-looking statements involve inherent risks and uncertainties. A number of factors could cause actual results to differ materially from those contained in any forward-looking statement, including but not limited to the following: ATRenew’s strategies; ATRenew’s future business development, financial condition and results of operations; ATRenew’s ability to maintain its relationship with major strategic investors; its ability to facilitate pre-owned consumer electronics transactions and provide relevant services; its ability to maintain and enhance the recognition and reputation of its brand; general economic and business conditions globally and in China and assumptions underlying or related to any of the foregoing. Further information regarding these and other risks is included in ATRenew’s filings with the SEC. All information provided in this press release is as of the date of this press release, and ATRenew does not undertake any obligation to update any forward-looking statement, except as required under applicable law.

Investor Relations Contact

In China:
ATRenew Inc.
Investor Relations
Email: ir@atrenew.com

In the United States:
ICR LLC.
Email: atrenew@icrinc.com
Tel: +1-212-537-0461


ATRENEW INC.

UNAUDITED CONDENSED CONSOLIDATED BALANCE SHEETS

(Amounts in thousands)

As of December 31,

As of September 30,

2024

2025

RMB

RMB

US$

ASSETS

Current assets:

Cash and cash equivalents

1,970,183

1,627,654

228,635

Restricted cash

132,000

6,668

937

Short-term investments

583,764

546,685

76,792

Amount due from related parties, net

117,161

244,445

34,337

Inventories

535,070

698,834

98,165

Funds receivable from third party payment service
providers

233,133

356,054

50,015

Prepayments and other receivables, net

598,045

903,655

126,934

Total current assets

4,169,356

4,383,995

615,815

Non-current assets:

Long-term investments

556,136

514,256

72,237

Property and equipment, net

156,532

229,671

32,262

Intangible assets, net

56,603

11,432

1,606

Other non-current assets

152,094

158,551

22,272

Total non-current assets

921,365

913,910

128,377

TOTAL ASSETS

5,090,721

5,297,905

744,192

LIABILITIES AND SHAREHOLDERS’ EQUITY

Current liabilities:

Short-term borrowings

225,000

149,800

21,042

Accounts payable

171,356

146,268

20,546

Contract liabilities

98,834

79,139

11,117

Accrued expenses and other current liabilities

522,378

648,487

91,092

Accrued payroll and welfare

179,693

189,921

26,678

Amount due to related parties

109,730

116,418

16,353

Total current liabilities

1,306,991

1,330,033

186,828

Non-current liabilities:

Operating lease liabilities, non-current

79,934

76,986

10,814

Deferred tax liabilities

9,244

2,469

347

Total non-current liabilities

89,178

79,455

11,161

TOTAL LIABILITIES

1,396,169

1,409,488

197,989

TOTAL SHAREHOLDERS’ EQUITY

3,694,552

3,888,417

546,203

TOTAL LIABILITIES AND SHAREHOLDERS’
EQUITY

5,090,721

5,297,905

744,192


ATRENEW INC.

UNAUDITED CONDENSED CONSOLIDATED STATEMENTS OF OPERATIONS AND

COMPREHENSIVE INCOME (LOSS)

(Amounts in thousands, except share and per share and otherwise noted)

Three months ended September 30,

Nine months ended September 30,

2024

2025

2024

2025

RMB

RMB

US$

RMB

RMB

US$

Net revenues

Net product revenues

3,672,239

4,726,335

663,904

10,383,813

13,548,709

1,903,176

Net service revenues

378,999

422,820

59,393

1,095,264

1,245,356

174,934

Operating (expenses) income (1)(2)

Merchandise costs

(3,242,843)

(4,094,190)

(575,107)

(9,181,300)

(11,667,662)

(1,638,947)

Fulfillment expenses

(347,270)

(437,102)

(61,399)

(985,325)

(1,278,579)

(179,601)

Selling and marketing expenses

(315,293)

(363,891)

(51,115)

(990,607)

(1,189,619)

(167,105)

General and administrative expenses

(69,302)

(74,147)

(10,415)

(215,671)

(215,042)

(30,207)

Technology and content expenses

(53,396)

(63,823)

(8,965)

(153,391)

(181,294)

(25,466)

Other operating income, net

1,751

4,776

671

23,082

22,666

3,184

Income (loss) from operations

24,885

120,778

16,967

(24,135)

284,535

39,968

Interest expense

(3,615)

(1,258)

(177)

(12,332)

(4,886)

(686)

Interest income

8,686

5,921

832

20,611

19,875

2,792

Other income (loss), net

47

(281)

(39)

(41,305)

(1,998)

(281)

Income (loss) before income taxes and
share of loss in equity method investments

30,003

125,160

17,583

(57,161)

297,526

41,793

Income tax benefits (expenses)

5,949

(16,883)

(2,372)

24,536

(40,465)

(5,684)

Share of loss in equity method investments

(18,069)

(17,460)

(2,453)

(53,028)

(51,108)

(7,179)

Net income (loss)

17,883

90,817

12,758

(85,653)

205,953

28,930

Net income (loss) per ordinary share:

Basic

0.11

0.56

0.08

(0.53)

1.28

0.18

Diluted

0.11

0.56

0.08

(0.53)

1.27

0.18

Weighted average number of shares used
in calculating net income (loss) per
ordinary share

Basic

161,405,774

161,397,323

161,397,323

162,011,110

161,419,254

161,419,254

Diluted

164,258,720

162,686,691

162,686,691

162,011,110

162,495,952

162,495,952

Net income (loss)

17,883

90,817

12,758

(85,653)

205,953

28,930

Foreign currency translation adjustments

(7,093)

892

125

(7,183)

(5,849)

(822)

Total comprehensive income (loss)

10,790

91,709

12,883

(92,836)

200,104

28,108


ATRENEW INC.

UNAUDITED CONDENSED CONSOLIDATED STATEMENTS OF OPERATIONS AND

COMPREHENSIVE INCOME (LOSS) (CONTINUED)

(Amounts in thousands)

Three months ended September
30,

Nine months ended September
30,

2024

2025

2024

2025

RMB

RMB

US$

RMB

RMB

US$

(1) Includes share-based compensation
expenses as follows:

Fulfillment expenses

(3,021)

(4,919)

(691)

(15,992)

(11,257)

(1,581)

Selling and marketing expenses

(12,220)

(2,062)

(290)

(56,792)

(8,252)

(1,159)

General and administrative expenses

(13,854)

(8,992)

(1,263)

(45,924)

(15,323)

(2,152)

Technology and content expenses

(3,657)

(2,726)

(383)

(13,611)

(8,943)

(1,256)

(2) Includes amortization of intangible
assets resulting from assets and
business acquisitions as follows:

Selling and marketing expenses

(46,263)

(780)

(110)

(169,154)

(45,172)

(6,345)

Technology and content expenses

(130)

(981)


Unaudited Reconciliations of GAAP and Non-GAAP Results

(Amounts in thousands, except share and per share and otherwise noted)

Three months ended September 30,

Nine months ended September 30,

2024

2025

2024

2025

RMB

RMB

US$

RMB

RMB

US$

 Income (loss) from operations

24,885

120,778

16,967

(24,135)

284,535

39,968

Add:

Share-based compensation expenses

32,752

18,699

2,627

132,319

43,775

6,148

Amortization of intangible assets resulting from
assets and business acquisitions

46,393

780

110

170,135

45,172

6,345

Adjusted income from operations (non-GAAP)

104,030

140,257

19,704

278,319

373,482

52,461

Net income (loss)

17,883

90,817

12,758

(85,653)

205,953

28,930

Add:

Share-based compensation expenses

32,752

18,699

2,627

132,319

43,775

6,148

Amortization of intangible assets resulting from
assets and business acquisitions

46,393

780

110

170,135

45,172

6,345

Less:

Tax effects of amortization of intangible assets
resulting from assets and business acquisitions

(6,972)

(117)

(16)

(25,559)

(6,776)

(952)

Adjusted net income (non-GAAP)

90,056

110,179

15,479

191,242

288,124

40,471

Adjusted net income per ordinary share (non-
GAAP):

Basic

0.56

0.68

0.10

1.18

1.78

0.25

Diluted

0.55

0.68

0.10

1.16

1.77

0.25

Weighted average number of shares used in
calculating net income per ordinary share

Basic

161,405,774

161,397,323

161,397,323

162,011,110

161,419,254

161,419,254

Diluted

164,258,720

162,686,691

162,686,691

165,040,389

162,495,952

162,495,952


Ericsson Mobility Report: differentiated connectivity services gaining momentum

  • 33 CSPs currently offer differentiated connectivity services based on network slicing – with a combined total of 65 offerings
  • New report period forecasts 6.4 billion 5G subscriptions by the end of 2031 – comprising two-thirds of all mobile subscriptions at the time
  • About 1.4 billion people expected to be served by FWA broadband by the end of 2031 – 90 percent via 5G

STOCKHOLM, Nov. 20, 2025 /PRNewswire/ — 5G Standalone (5G SA) deployments have triggered a notable 2025 growth in the number of communications service providers (CSPs) offering differentiated connectivity commercial models based on 5G SA Network Slicing – where CSPs guarantee quality of service for customer use cases through the allocation of slices of the network. The statistic is part of in-depth reporting, analysis and forecasting in the November 2025 Ericsson (NASDAQ: ERIC) Mobility Report (EMR).

More than 90 CSPs have now launched/soft-launched 5G Standalone (5G SA) networks – an increase of about 30 CSPs from the same period last year and 20 from the June 2025 EMR report.

EMR researchers identified 118 cases – across 56 CSPs – where network slicing is used to provide differentiated connectivity services.

Of the 118 cases – 65 have moved beyond proof of concept and into commercial services, across 33 CSPs. These are either subscription services or add-on packages for consumer or enterprise customers.

Twenty-one of the 65 commercial offerings – almost one third – were launched during 2025 alone.

“We see that service providers around the world are keen to embrace and deploy 5G SA to offer differentiated connectivity based on value services and not just data volume packages,” EMR publisher and Ericsson CTO, Erik Ekudden, says. “As reflected in the case studies in this EMR edition, 5G SA is already enabling differentiated connectivity opportunities. We’ve seen many service providers go from proof-of-concept to commercial deployment in 2025 alone, and we expect to see that trend continuing.”

The November 2025 EMR covers a new forecast timeframe, from 2025 through the end of 2031.

The new reporting EMR period also covers the first expected deployments of commercial 6G. Based on previous mobile generation cycles’ subscriptions uptake, EMR researchers expect the first commercial launches to be driven by leading service providers in front-runner markets – such as the U.S., Japan, South Korea, China, India, and some Gulf Cooperation Council countries.

Global 6G subscriptions are forecast to reach 180 million by the end of 2031, not including the early uptake of AI-enabled Internet of Things devices. The subscription uptake number could increase significantly if 6G launches earlier than previous cycles indicate.

Commercial 6G is expected to launch about a year later in Europe, compared to other countries, than was the case for 5G, primarily due comparably later deployments of 5G SA

As an ongoing major 5G use case, enhanced mobile broadband is forecast to top 6.4 billion 5G subscriptions by the end of 2031, comprising about two-thirds of all mobile subscriptions at the time. Some 4.1 billion of these subscriptions – about 65 percent – are forecast to be 5G SA.

In 2025 alone, 5G subscriptions are expected to top 2.9 billion by the end of the year – equating to about one third of all current mobile subscriptions – an increase of some 600 million subscriptions year-on-year.

In geographical coverage terms, 2025 saw an increase of 400 million people worldwide being able to access 5G. About 50 percent of the global population beyond mainland China is expected to have 5G coverage by the end of 2025.

Mobile network data traffic grew 20 percent between the third quarter of 2024 and the corresponding period in 2025 – a slightly larger than expected increase, driven by mainland China and India. Continued growth is forecast at an annual average of 16 percent through 2031.

5G networks are expected to manage 43 percent of all mobile data by the close of 2025 – up from 34 percent for the corresponding period last year. EMR experts forecast this to increase to 83 percent in 2031.

Fixed Wireless Access (FWA) broadband continues to grow as a 5G use case. The November 2025 EMR forecasts that about 1.4 billion people globally are expected to access FWA broadband by the end of 2031 – 90 percent via 5G.

EMR researchers have identified 159 providers that currently offer FWA services via 5G – amounting to approximately 65 percent of all FWA service providers. The number of service providers offering speed-based tariffs – a common monetization model for fixed broadband via fiber or cable – increased from 43 percent to 54 percent since the November 2024 EMR.

The 36-page November 2025 EMR includes three co-written use-case articles:

  • Singtel: 5G SA providing tailored experiences
  • Softbank: modernizing enterprise IT with 5G
  • SailGP: enhancing operations and viewer experiences with 5G

Ericsson will host related Ericsson Mobility Report online seminars at 09.00 (CET) and at 18.00 (CET) today, Thursday  November 20 . To join please register via this link.

Read the full November 2025 Ericsson Mobility Report via this link.

Based on unique Ericsson and partner network insights, the Ericsson Mobility Report has been the key industry reference for network data, performance, statistics, and forecasts since its launch in 2011.

NOTES TO EDITORS:

FOLLOW US:

Subscribe to Ericsson press releases
Subscribe to Ericsson blog posts
https://x.com/ericsson
https://www.facebook.com/ericsson
https://www.linkedin.com/company/ericsson

MORE INFORMATION AT:
Ericsson Newsroom
media.relations@ericsson.com  (+46 10 719 69 92)
investor.relations@ericsson.com  (+46 10 719 00 00)

ABOUT ERICSSON:
Ericsson’s high-performing, programmable networks provide connectivity for billions of people every day. For nearly 150 years, we’ve been pioneers in creating technology for communication. We offer mobile communication and connectivity solutions for service providers and enterprises. Together with our customers and partners, we make the digital world of tomorrow a reality. www.ericsson.com

This information was brought to you by Cision http://news.cision.com

https://news.cision.com/ericsson/r/ericsson-mobility-report–differentiated-connectivity-services-gaining-momentum,c4269113

The following files are available for download:

https://mb.cision.com/Main/15448/4269113/3795780.pdf

PDF – Ericsson Mobility Report: differentiated connectivity services gaining momentum

https://news.cision.com/ericsson/i/ericsson-mobility-report–emr–november-2025-report-cover,c3489132

Ericsson Mobility Report (EMR) November 2025 report cover

Jobsdb by SEEK Reveals 24% of Job Scams Target Admin & Office Support, Predominantly Entry-Level Positions

Warns of AI-powered and Multi-channel Scams

Hong Kong’s regulated market structure contributes to the lower fraudulent ad rate

HONG KONG SAR – Media OutReach Newswire – 20 November 2025 – In recognition of International Fraud Awareness Week, Jobsdb by SEEK released new insights into employment fraud trends across the operating markets, revealing how scammers adapt their tactics to exploit local job market conditions and economic needs. The analysis, based on internal fraud detection data from SEEK’s platforms across its eight operating markets in APAC—Australia, New Zealand, Hong Kong, Singapore, Malaysia, Thailand, Indonesia, and the Philippines—reveals that Hong Kong’s job market demonstrates a significantly lower incidence of fraudulent activity across these markets. From the data, the most fraudulent job ads are seen in entry‑level roles, with Hong Kong following a similar pattern.

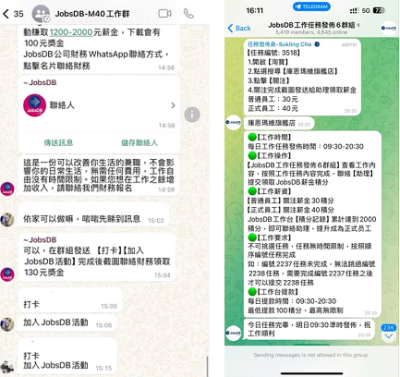
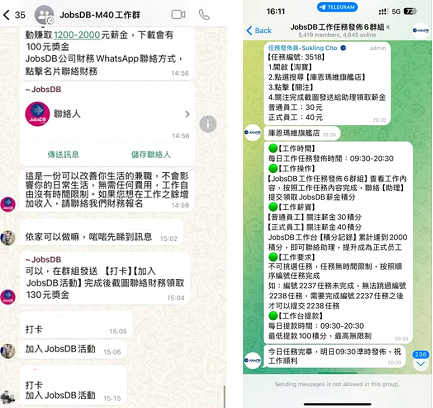
Fraudulent messages often include phrases like 'part-time activities,' to attract individuals with promises of monetary rewards for simply 'checking in' or completing tasks.
Fraudulent messages often include phrases like ‘part-time activities,’ to attract individuals with promises of monetary rewards for simply ‘checking in’ or completing tasks.

Job Scams most targeted category: Administration & Office Support

The data shows that Administration & Office Support roles remain the primary target across all markets. In APAC markets, this category is the most targeted for job ads, accounting for 24% of the total, while Manufacturing, Transport & Logistics accounts for 13%.

Top 5 most targeted job ad categories by fraudsters (July 2024 – June 2025)

Job category APAC total
Administration & Office Support 24%
Manufacturing, Transport & Logistics 13%
Sales 7%
Retail & Consumer Products 6%
Trades & Services 6%

“Administration and office support roles are particularly vulnerable because they typically don’t require specialised degrees or extensive experience,” said Tom Rhind, SEEK’s Head of Trust & Safety. “Sales positions show similar patterns, as these roles often promise immediate employment and commission-based earnings that appeal to jobseekers in urgent need of income. Combined, these entry-level categories create larger pools of potential victims and make it easier for scammers to cast wide nets with convincing-looking opportunities.”

The analysis, based on fraud detection data from SEEK, found Hong Kong’s fraud case rate stands at approximately 0.0035%, about 18 times lower compared to the APAC average of 0.067%. Bill Lee, Managing Director, Hong Kong, Jobsdb by SEEK, explained, “Hong Kong’s unique market structure, which is highly regulated and dominated by large, registered corporations, provides a strong foundation for our security measures. This environment means fraudulent activity is more likely to stand out and be blocked before it ever reaches a jobseeker.”

“While this contributes to a much lower fraud rate on our platform, no market is immune. We are seeing scammers adapt, using AI to write flawless copy and moving conversations to social media and instant messaging platforms,” Lee continued. “This is why it is crucial for jobseekers to use trusted and verified platforms. Jobsdb’s investment in world-class AI and a dedicated Trust & Safety team demonstrates our commitment to building a more secure and efficient marketplace. We aim to empower Hong Kong’s talent by providing a trusted platform where they can connect with opportunities confidently.”

Jobsdb‘s fair hiring controls in action

As Hong Kong’s leading job platform, Jobsdb is deeply committed to providing a safe and trusted environment for all jobseekers. Leveraging the world-class technology and expertise of our parent company, SEEK, we are dedicated to eliminating unfair hiring practices. Our commitment begins with a robust first line of defence: a stringent hirer onboarding process where our dedicated Trust & Safety team conducts thorough verification to ensure all hirers on our platform are legitimate. This is followed by continuous content moderation; every job advertisement undergoes automated scanning, and any suspicious content is immediately escalated to specialist teams for manual review. The platform also empowers candidates through reporting tools to flag suspicious job advertisements directly.

These protection measures delivered notable results during SEEK’s 2025 financial year, between July 2024 and June 2025. SEEK’s systems scanned 100% of the 4.3 million job ads posted across APAC, with 8% escalated for manual review.

SEEK also prevented about 3,600 hirers who failed the onboarding process assessment from entering its platforms, closed about 650 hirer accounts due to fraud or high-risk behaviour, and removed nearly 2,800 high-risk job ads after investigation. Candidates also actively participated by reporting approximately 22,000 job ads for suspected fraud or scams, which were subsequently reviewed by SEEK’s dedicated Trust & Safety team.

Jobsdb Fights Job Scams: No Sensitive Data Requests

Recently, scammers are increasingly using artificial intelligence to create more sophisticated scams, as well as impersonating Jobsdb and contacting candidates through SMS, messaging apps and social media platforms. Jobsdb places the utmost importance on the privacy and security of jobseekers and employers. Jobsdb and our staff will never request passwords, bank account details, or any other sensitive information from jobseekers via phone, email, social media, or personal messaging platforms.

To combat these evolving threats, SEEK continuously enhances its fraud detection measures – including automated blocking systems and improved verification processes – and works closely with government and non-government bodies to facilitate knowledge and intelligence sharing.

As part of its commitment to candidate safety, SEEK provides ongoing education through its Security & Privacy Hub, which includes information on current scams, known unfair hiring practices, safe job searching advice and tips to protect themselves online.

Jobseekers can visit Security & Privacy Hub of Jobsdb at https://hk.jobsdb.com/security-hub, for more information. Jobsdb’s official Phone Number/ WhatsApp account can be found at https://hk.jobsdb.com/page/jobsdb-official-whatsapp-account.

Click here for high resolution image.

– End –

Hashtag: #Jobsdb

The issuer is solely responsible for the content of this announcement.

About Jobsdb by SEEK

Jobsdb is the leading employment platform in Hong Kong and Thailand, helping people live more fulfilling and productive working lives and helping organisations succeed. It is a subsidiary of SEEK, a diverse group of companies comprised of a strong portfolio of online employment, educational, commercial and volunteer businesses. SEEK is listed on the Australian Securities Exchange and has a strong presence across the APAC region, including six Asian markets – Hong Kong, Indonesia, Malaysia, the Philippines, Singapore, and Thailand – through the Jobsdb and Jobstreet brands. SEEK attracts over 500 million visits a year in Asia.​

SUS ENVIRONMENT at COP30: Co-building a Brighter Tomorrow with Waste-to-Energy

SHANGHAI, Nov. 20, 2025 /PRNewswire/ — From November 10 to 21, 2025, the 30th United Nations Climate Change Conference (COP 30) was held in Belém, Brazil. Over 50,000 delegates from more than 190 countries and regions attended, jointly advancing the annual climate finance goal of $1.3 trillion and accelerating the “just transition” toward a clean economy.

As a representative enterprise in China’s environmental and energy sectors, SUS ENVIRONMENT was invited to participate in the China Pavilion series of events at the core area of COP 30. Focusing on “energy transition,” “ecological governance,” and “biodiversity conservation,” SUS demonstrated the strategic significance of waste-to-energy in climate governance and shared SUS solution for jointly building a beautiful world.

Technological Innovation, Accelerating the Low-Carbon Transition
The scientific consensus indicates that global temperatures are trending toward temporarily exceeding the 1.5°C warming limit outlined in the Paris Agreement. As the fourth largest source of global carbon emissions, waste management urgently requires strategic attention.

SUS ENVIRONMENT delivered a keynote speech titled “SUS Solid Waste Management Solution: Technological Innovation Driving Climate Action and Sustainable Development,” sharing China’s advanced technological achievements and carbon reduction practices in waste-to-energy. Through technological innovation, industrial collaboration, and AI empowerment, it achieves a win-win scenario for environmental governance and sustainable development, making clean energy with carbon reduction or even “negative carbon” emissions possible, and provides globally shared clean and efficient advanced solid waste management solutions.

Practising Biodiversity Conservation, Safeguarding the Pulse of Life
On the critical issue of biodiversity conservation, SUS ENVIRONMENT presented “Towards a Sustainable Future – Waste-to-Energy and Biodiversity Conservation Practices,” demonstrating how the company strictly adheres to ecological protection principles during waste-to-energy plant construction and operation, remediation of industrial and mining contaminated sites, landfill comprehensive remediation, and secondary solid waste resource utilization.

SUS ENVIRONMENT will continue to promote global cooperation with an open attitude, contributing to global climate governance and ecological protection through waste-to-energy solutions.

About SUS ENVIRONMENT
SUS ENVIRONMENT is the global leading comprehensive environment provider.* As of June 2025, SUS ENVIRONMENT has established 11 management centers worldwide, invested in and constructed 90 waste-to-energy projects, with a daily processing capacity nearly 120,000 tons of MSW and annual green power generation of approximately 18,000 GWh.

*Data sourced from the Environmental Sanitation Net Of China and public data, covering total design scale, with data as of June 30, 2025.