Home Blog Page 70

Trip.com Group Limited Reports Unaudited Second Quarter and First Half of 2026 Financial Results

SINGAPORE, Sept. 16, 2026 /PRNewswire/ — Trip.com Group Limited (Nasdaq: TCOM; HKEX: 9961) (“Trip.com Group” or the “Company”), a leading global one-stop travel service provider of accommodation reservation, transportation ticketing, packaged tours, and corporate travel management, today announced its unaudited financial results for the second quarter and first half of 2026.

Key Highlights for the Second Quarter of 2026

  • International business delivered robust growth across all segments in the second quarter of 2026
    – Revenue on the Company’s international platform increased by over 50% year-over-year.
    – Inbound travel revenue increased at a high double-digit rate year-over-year.
  • The Company delivered solid results in the second quarter of 2026
    – Total net revenue for the second quarter of 2026 was RMB15.7 billion (US$2.3 billion), increased by 6% year-over-year.
    – Diluted loss per ordinary share and per ADS was RMB3.89 (US$0.57) for the second quarter of 2026. Non-GAAP diluted earnings per ordinary share and per ADS was RMB7.27 (US$1.07) for the second quarter of 2026, up from RMB7.20 in the same period last year.

“Travel remains a fundamental consumer need, and we see significant long-term opportunities as travelers seek more personalized and rewarding experiences. Our strategic priorities remain clear: Globalization and Great Quality, or G2,” said James Liang, Executive Chairman. “Building on this foundation, we are advancing our proprietary AI capabilities across every stage of the travel journey to accelerate G2 and unlock new opportunities for growth. We are building a more differentiated and valuable global platform for travelers and partners, positioning us for the next phase of sustainable growth.”

“Trip.com Group delivered resilient performance in the second quarter, with inbound and world-to-world travel continuing to gain momentum as structural growth drivers,” said Jane Sun, Chief Executive Officer. “We see an opportunity to build a healthier ecosystem centered on value, experience, and service quality. We are expanding our offerings to include new travel and lifestyle experiences, while leveraging technology and international marketing to help partners differentiate and drive sustainable growth. We remain focused on disciplined execution and building the capabilities to capture these growth opportunities at scale.”

Second Quarter of 2026 Financial Results and Business Updates

For the second quarter of 2026, Trip.com Group reported total net revenues of RMB15.7 billion (US$2.3 billion), representing a 6% increase from the same period in 2025, primarily driven by resilient travel demand. Total net revenues for the second quarter of 2026 decreased by 3% from the previous quarter, primarily due to macro headwinds such as elevated energy prices and geopolitical volatility, alongside operational adjustments the Company implemented to align with evolving industry standards and compliance frameworks.

Accommodation reservation revenue for the second quarter of 2026 was RMB6.6 billion (US$969 million), representing a 6% increase from the same period in 2025, primarily driven by an increase in accommodation reservations, and partially offset by a contra-revenue imposed by the State Administration for Market Regulation of the People’s Republic of China (the “SAMR”). Accommodation reservation revenue for the second quarter of 2026 increased by 1% from the previous quarter.

Transportation ticketing revenue for the second quarter of 2026 was RMB5.4 billion (US$788 million), representing a 1% decrease from the same period in 2025 and a 12% decrease from the previous quarter, primarily due to macro headwinds such as elevated energy prices and geopolitical volatility.

Packaged-tour revenue for the second quarter of 2026 was RMB1.2 billion (US$171 million), representing an 8% increase from the same period in 2025, primarily driven by an increase in packaged-tour reservations. Packaged-tour revenue for the second quarter of 2026 increased by 3% from the previous quarter, primarily driven by resilient travel demand, particularly during the holiday periods.

Corporate travel revenue for the second quarter of 2026 was RMB771 million (US$114 million), representing an 11% increase from the same period in 2025 and a 12% increase from the previous quarter, primarily driven by an increase in corporate travel reservations.

Cost of revenue for the second quarter of 2026 increased by 12% to RMB3.2 billion (US$466 million) from the same period in 2025 and decreased by 5% from the previous quarter, which was generally in line with the fluctuations in total net revenues from the respective periods. Cost of revenue as a percentage of total net revenues was 20% for the second quarter of 2026.

Product development expenses for the second quarter of 2026 increased by 8% to RMB3.8 billion (US$559 million) from the same period in 2025 and decreased by 7% from the previous quarter, primarily due to the fluctuations in product development personnel related expenses. Product development expenses as a percentage of total net revenues were 24% for the second quarter of 2026.

Sales and marketing expenses for the second quarter of 2026 increased by 15% to RMB3.8 billion (US$566 million) from the same period in 2025 and increased by 3% from the previous quarter, primarily due to the increase in expenses relating to sales and marketing promotion activities. Sales and marketing expenses as a percentage of total net revenues were 25% for the second quarter of 2026.

General and administrative expenses for the second quarter of 2026 increased by 477% to RMB6.3 billion (US$933 million) from the same period in 2025 and increased by 463% from the previous quarter, primarily due to the anti-monopoly penalty by the SAMR in the amount of RMB5.2 billion (US$763 million). Without the effect of the anti-monopoly penalty, general and administrative expenses for the second quarter of 2026 would have increased by 5% to RMB1.2 billion (US$170 million) from the same period in 2025 and would have increased by 2% from the previous quarter. General and administrative expenses as a percentage of total net revenues were 40% for the second quarter of 2026. Without the effect of the anti-monopoly penalty, general and administrative expenses as a percentage of total net revenues would have been 7% for the second quarter of 2026.

Income tax expense for the second quarter of 2026 was RMB799 million (US$118 million), compared to RMB998 million for the same period in 2025 and RMB893 million for the previous quarter. The change in Trip.com Group’s effective tax rate was primarily due to the combined impacts of changes in respective profitability of its subsidiaries with different tax rates, changes in deferred tax liabilities relating to withholding tax, certain non-taxable income or loss resulting from the fair value changes in equity securities investments and exchangeable senior notes recorded in other income and anti-monopoly penalty in general and administrative expenses, and changes in valuation allowance provided for deferred tax assets.

Net loss for the second quarter of 2026 was RMB2.4 billion (US$361 million), compared to net income of RMB4.9 billion for the same period in 2025 and net income of RMB2.5 billion for the previous quarter, primarily due to the anti-monopoly penalty by the SAMR in the amount of RMB5.2 billion (US$763 million). Without the effect of the anti-monopoly penalty, net income for the second quarter of 2026 would have been RMB2.7 billion (US$402 million). Adjusted EBITDA for the second quarter of 2026 was RMB4.6 billion (US$673 million), compared to RMB4.9 billion for the same period in 2025 and RMB4.8 billion for the previous quarter.

Net loss attributable to Trip.com Group’s shareholders for the second quarter of 2026 was RMB2.5 billion (US$363 million), compared to net income attributable to Trip.com Group’s shareholders of RMB4.8 billion for the same period in 2025 and RMB2.5 billion for the previous quarter, primarily due to the anti-monopoly penalty by the SAMR in the amount of RMB5.2 billion (US$763 million). Without the effect of the anti-monopoly penalty, net income attributable to Trip.com Group’s shareholders for the second quarter of 2026 would have been RMB2.7 billion (US$400 million). Excluding share-based compensation charges, the anti-monopoly penalty by the SAMR, fair value changes of equity securities investments and exchangeable senior notes recorded in other income, and their tax effects, non-GAAP net income attributable to Trip.com Group’s shareholders for the second quarter of 2026 was RMB4.8 billion (US$706 million), compared to RMB5.0 billion for the same period in 2025 and RMB3.9 billion for the previous quarter.

Diluted loss per ordinary share and per ADS was RMB3.89 (US$0.57) for the second quarter of 2026. Excluding share-based compensation charges, the anti-monopoly penalty by the SAMR, fair value changes of equity securities investments and exchangeable senior notes recorded in other income, and their tax effects, non-GAAP diluted earnings per ordinary share and per ADS was RMB7.27 (US$1.07) for the second quarter of 2026. Each ADS currently represents one ordinary share of the Company.

As of June 30, 2026, the balance of cash and cash equivalents, restricted cash, short-term investment, and held to maturity time deposit and financial products was RMB100.5 billion (US$14.8 billion).

Conference Call

Trip.com Group’s management team will host a conference call at 8:00 PM on September 15, 2026, U.S. Eastern Time (or 8:00 AM on September 16, 2026, Hong Kong Time) following this announcement.

The conference call will be available live on Webcast and for replay at: https://investors.trip.com. The call will be archived for twelve months on our website.

All participants must pre-register to join this conference call using the Participant Registration link below: https://register-conf.media-server.com/register/BI2674f539340943acacf4a39cf6d51444.

Upon registration, each participant will receive details for this conference call, including dial-in numbers and a unique access PIN. To join the conference, please dial the number provided, enter your PIN, and you will join the conference instantly.

Safe Harbor Statement

This announcement contains forward-looking statements. These statements are made under the “safe harbor” provisions of the U.S. Private Securities Litigation Reform Act of 1995. These forward-looking statements can be identified by terminology such as “may,” “will,” “expect,” “anticipate,” “future,” “intend,” “plan,” “believe,” “estimate,” “is/are likely to,” “confident,” or other similar statements. Among other things, quotations from management in this press release, as well as Trip.com Group’s strategic and operational plans, contain forward-looking statements. Forward-looking statements involve inherent risks and uncertainties. A number of important factors could cause actual results to differ materially from those contained in any forward-looking statement. Potential risks and uncertainties include, but are not limited to, severe or prolonged downturn in the global or Chinese economy, general declines or disruptions in the travel industry, volatility in the trading price of Trip.com Group’s ADSs or shares, Trip.com Group’s reliance on its relationships and contractual arrangements with travel suppliers and strategic alliances, failure to compete against new and existing competitors, failure to successfully manage current growth and potential future growth, risks associated with any strategic investments or acquisitions, seasonality in the travel industry in the relevant jurisdictions where Trip.com Group operates, failure to successfully develop Trip.com Group’s existing or future business lines, damage to or failure of Trip.com Group’s infrastructure and technology, loss of services of Trip.com Group’s key executives, adverse changes in economic and business conditions in the relevant jurisdictions where Trip.com Group operates, any regulatory developments in laws, regulations, rules, policies or guidelines applicable to Trip.com Group, any investigation, enforcement or legal/administrative proceeding against Trip.com Group in connection with its business operation and other risks outlined in Trip.com Group’s filings with the U.S. Securities and Exchange Commission or the Stock Exchange of Hong Kong Limited. All information provided in this press release and in the attachments is as of the date of the issuance, and Trip.com Group does not undertake any obligation to update any forward-looking statement, except as required under applicable law.

About Non-GAAP Financial Measures

To supplement Trip.com Group’s consolidated financial statements, which are prepared and presented in accordance with United States Generally Accepted Accounting Principles (“GAAP”), Trip.com Group uses non-GAAP financial information related to adjusted net income attributable to Trip.com Group Limited, adjusted EBITDA, adjusted EBITDA margin, and adjusted diluted earnings per ordinary share and per ADS, each of which is adjusted from the most comparable GAAP result to exclude the share-based compensation charges that are not tax deductible, fair value changes of equity securities investments and exchangeable senior notes recorded in other income, net of tax, and other applicable items. Trip.com Group’s management believes the non-GAAP financial measures facilitate better understanding of operating results from quarter to quarter and provide management with a better capability to plan and forecast future periods.

Non-GAAP information is not prepared in accordance with GAAP, does not have a standardized meaning under GAAP, and may be different from non-GAAP methods of accounting and reporting used by other companies. The presentation of this additional information should not be considered a substitute for GAAP results. A limitation of using non-GAAP financial measures is that non-GAAP measures exclude share-based compensation charges, fair value changes of equity securities investments and exchangeable senior notes recorded in other income, and their tax effects that have been and will continue to be significant recurring expenses in Trip.com Group’s business for the foreseeable future.

Reconciliations of Trip.com Group’s non-GAAP financial data to the most comparable GAAP data included in the consolidated statement of operations are included at the end of this press release.

About Trip.com Group Limited

Trip.com Group Limited (Nasdaq: TCOM; HKEX: 9961) is a leading global one-stop travel platform, integrating a comprehensive suite of travel products and services and differentiated travel content. It is the go-to destination for many travelers in Asia, and increasingly for travelers around the world, to explore travel, get inspired, make informed and cost-effective travel bookings, enjoy hassle-free on-the-go support, and share travel experience. Founded in 1999 and listed on Nasdaq in 2003 and HKEX in 2021, the Company currently operates under a portfolio of brands, including Ctrip, Qunar, Trip.com, and Skyscanner, with the mission “to pursue the perfect trip for a better world.”

For further information, please contact:

Investor Relations
Trip.com Group Limited
Email: iremail@trip.com


Trip.com Group Limited

Unaudited Consolidated Balance Sheets

(In millions, except share and per share data)

December 31, 2025

June 30, 2026

June 30, 2026

RMB (million)

RMB (million)

USD (million)

ASSETS

Current assets:

Cash, cash equivalents and restricted cash

46,451

56,016

8,256

Short-term investments

32,007

23,499

3,463

Accounts receivable, net 

15,241

17,053

2,513

Prepayments and other current assets 

27,351

25,945

3,824

Total current assets

121,050

122,513

18,056

Property, equipment and software

5,445

5,767

850

Intangible assets and land use rights

13,013

12,947

1,908

Right-of-use asset

881

854

126

Investments (Includes held to maturity time deposit and
financial products of RMB27,302 million and RMB21,001
million as of December 31, 2025 and June 30, 2026,
respectively)

61,375

51,361

7,570

Goodwill

62,268

62,196

9,167

Other long-term assets

600

517

76

Deferred tax asset

2,755

2,934

432

Total assets

267,387

259,089

38,185

LIABILITIES

Current liabilities:

Short-term debt and current portion of long-term debt

19,335

25,767

3,798

Accounts payable

19,150

19,958

2,941

Advances from customers

18,185

20,861

3,075

Other current liabilities

21,499

25,750

3,794

Total current liabilities

78,169

92,336

13,608

Deferred tax liability

3,949

4,233

624

Long-term debt

11,430

630

93

Long-term lease liability

585

567

84

Other long-term liabilities

654

519

76

Total liabilities

94,787

98,285

14,485

MEZZANINE EQUITY

131

140

21

SHAREHOLDERS’ EQUITY

Total Trip.com Group Limited shareholders’ equity

170,818

159,049

23,441

Non-controlling interests

1,651

1,615

238

Total shareholders’ equity

172,469

160,664

23,679

Total liabilities, mezzanine equity and shareholders’
equity

267,387

259,089

38,185


Trip.com Group Limited

Unaudited Consolidated Statements of Income/(Loss)

(In millions, except share and per share data)

Three Months Ended

Six Months Ended

June 30, 2025

March 31, 2026

June 30, 2026

June 30, 2026

June 30, 2025

June 30, 2026

June 30, 2026

RMB (million)

RMB (million)

RMB (million)

USD (million)

RMB (million)

RMB (million)

USD (million)

Net Revenues:

Accommodation reservation 

6,225

6,510

6,576

969

11,766

13,086

1,929

Transportation ticketing 

5,397

6,050

5,350

788

10,815

11,400

1,680

Packaged-tour 

1,079

1,130

1,161

171

2,026

2,291

338

Corporate travel

692

690

771

114

1,265

1,461

215

Others

1,450

1,828

1,805

266

2,801

3,633

535

Total net revenues

14,843

16,208

15,663

2,308

28,673

31,871

4,697

Cost of revenue

(2,818)

(3,330)

(3,160)

(466)

(5,523)

(6,490)

(956)

Product development *

(3,500)

(4,062)

(3,792)

(559)

(7,025)

(7,854)

(1,158)

Sales and marketing *

(3,326)

(3,747)

(3,841)

(566)

(6,325)

(7,588)

(1,118)

General and administrative *

(1,097)

(1,124)

(6,332)

(933)

(2,135)

(7,456)

(1,099)

Income/(loss) from operations

4,102

3,945

(1,462)

(216)

7,665

2,483

366

Interest income 

609

563

562

83

1,249

1,125

166

Interest expense

(265)

(115)

(117)

(17)

(551)

(232)

(34)

Other income/(loss)

1,114

176

(1,199)

(177)

2,251

(1,023)

(151)

Income/(loss) before income
tax expense and equity in
income/(loss) of affiliates

5,560

4,569

(2,216)

(327)

10,614

2,353

347

Income tax expense

(998)

(893)

(799)

(118)

(1,636)

(1,692)

(249)

Equity in income/(loss) of affiliates

318

(1,151)

570

84

216

(581)

(86)

Net income/(loss)

4,880

2,525

(2,445)

(361)

9,194

80

12

Net income attributable to non-
controlling interests and mezzanine
classified non-controlling interests

(28)

(19)

(2)

(0)

(65)

(21)

(3)

Accretion to redemption value of
redeemable non-controlling interests

(6)

(7)

(11)

(2)

(6)

(18)

(3)

Net income/(loss) attributable
to Trip.com Group Limited

4,846

2,499

(2,458)

(363)

9,123

41

6

Earnings/(losses) per ordinary share 

– Basic

7.34

3.85

(3.89)

(0.57)

13.82

0.06

0.01

– Diluted

6.97

3.67

(3.89)

(0.57)

13.05

0.06

0.01

Earnings/(losses) per ADS 

– Basic

7.34

3.85

(3.89)

(0.57)

13.82

0.06

0.01

– Diluted

6.97

3.67

(3.89)

(0.57)

13.05

0.06

0.01

Weighted average ordinary shares outstanding 

– Basic

659,916,799

648,991,284

632,330,255

632,330,255

660,060,247

640,617,168

640,617,168

– Diluted

695,705,348

681,679,206

632,330,255

632,330,255

698,925,198

640,617,168

640,617,168

* Share-based compensation included in expenses above is as follows:

  Product development 

258

363

337

50

478

700

103

  Sales and marketing 

53

66

68

10

94

134

20

  General and administrative 

255

262

242

36

474

504

74


Trip.com Group Limited

Unaudited Reconciliation of  GAAP and Non-GAAP Results

(In millions, except %, share and per share data)

Three Months Ended

Six Months Ended

June 30, 2025

March 31, 2026

June 30, 2026

June 30, 2026

June 30, 2025

June 30, 2026

June 30, 2026

RMB (million)

RMB (million)

RMB (million)

USD (million)

RMB (million)

RMB (million)

USD (million)

Net income/(loss)

4,880

2,525

(2,445)

(361)

9,194

80

12

Less: Interest income

(609)

(563)

(562)

(83)

(1,249)

(1,125)

(166)

Add: Interest expense

265

115

117

17

551

232

34

Less: Other (income)/loss

(1,114)

(176)

1,199

177

(2,251)

1,023

151

Add: Income tax expense

998

893

799

118

1,636

1,692

249

Less: Equity in (income)/loss of affiliates

(318)

1,151

(570)

(84)

(216)

581

86

Income/(loss) from operations

4,102

3,945

(1,462)

(216)

7,665

2,483

366

Add: Share-based compensation

566

691

647

96

1,046

1,338

197

Add: Depreciation and amortization

212

194

200

30

416

394

58

Add: Anti-monopoly penalty by the State Administration for Market
Regulation of the People’s Republic of China

–

–

5,180

763

–

5,180

763

Adjusted EBITDA

4,880

4,830

4,565

673

9,127

9,395

1,384

Adjusted EBITDA margin

33 %

30 %

29 %

29 %

32 %

29 %

29 %

Net income/(loss) attributable to Trip.com Group Limited

4,846

2,499

(2,458)

(363)

9,123

41

6

Add: Share-based compensation

566

691

647

96

1,046

1,338

197

Add: Anti-monopoly penalty by the State Administration for Market
Regulation of the People’s Republic of China

–

–

5,180

763

–

5,180

763

Less: (Gain)/loss from fair value changes of equity securities investments
and exchangeable senior notes

(447)

876

1,454

214

(973)

2,330

343

Add: Tax effects on fair value changes of equity securities investments
and exchangeable senior notes

46

(161)

(25)

(4)

3

(186)

(27)

Non-GAAP net income attributable to Trip.com Group Limited

5,011

3,905

4,798

706

9,199

8,703

1,282

Weighted average ordinary shares outstanding-
 Diluted-non GAAP 

695,705,348

681,679,206

659,356,092

659,356,092

698,925,198

670,474,048

670,474,048

Non-GAAP Diluted income per share 

7.20

5.73

7.27

1.07

13.16

12.98

1.91

Non-GAAP Diluted income per ADS 

7.20

5.73

7.27

1.07

13.16

12.98

1.91

Notes for all the condensed consolidated financial schedules presented:

Note 1: The conversion of Renminbi (RMB) into U.S. dollars (USD) is based on the certified exchange rate of USD1.00=RMB6.7851 on June 30, 2026 published by the Federal Reserve Board.


SQC Appoints Semiconductor Veteran John Hollister as Chief Financial Officer

Hollister brings 25+ years of financial leadership across the global semiconductor industry, including previous CFO roles at GlobalFoundries and Silicon Labs

SYDNEY, Sept. 16, 2026 /PRNewswire/ — Silicon Quantum Computing (SQC), a pioneer in quantum computing and atomic-precision manufacturing, today announced the appointment of John Hollister as Chief Financial Officer, effective 17 August 2026. Hollister will lead global financial strategy and operations as SQC advances its roadmap to universal, commercial-scale quantum computers.

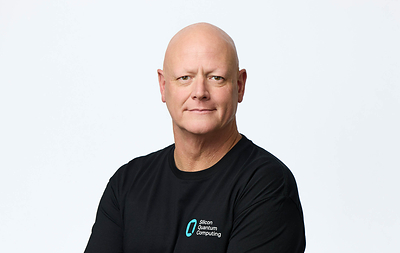
SQC Chief Financial Officer, John Hollister

Based in the U.S., Hollister is a global finance executive with more than two decades of leadership experience within the semiconductor industry. He has led and scaled international teams through periods of accelerated growth, with expertise spanning capital formation, financial planning and analysis, worldwide accounting, financial reporting, M&A, tax and investor relations.

Prior to SQC, Hollister served as CFO at GlobalFoundries, one of the world’s largest semiconductor foundries. Earlier in his career, he spent two decades at Silicon Labs, including 11 years as the company’s CFO, and held previous roles at Cicada Semiconductor and Cirrus Logic.

SQC Founder and CEO, Michelle Simmons, said: “Building a globally competitive quantum computing company requires the sharpest minds and deep knowledge. John brings a track record of financial rigor and expertise that is critical to advancing our commercial roadmap and scaling our world-leading manufacturing technology. We are delighted to have him on board.”

SQC Chief Financial Officer, John Hollister, added: “I look forward to building the financial infrastructure to support SQC’s next phase of growth, both in Australia and globally. Bringing quantum computing to the world is a massive opportunity, and SQC’s atomic-precision manufacturing capability gives us a distinct commercial and scientific advantage.”

Hollister’s arrival follows the appointment of Karna Nisewaner as Chief Legal Officer in June 2026. Together, these appointments bolster SQC’s executive leadership with decades of expertise building and running the operational machine behind chip design and manufacturing. SQC is one of 11 companies selected for Stage B of DARPA’s Quantum Benchmarking Initiative, and the company continues to deploy its quantum-enhanced AI and materials simulation chips to customers today.

For more information, visit www.sqc.com and follow SQC on LinkedIn.

About Silicon Quantum Computing

Silicon Quantum Computing (SQC) is at the forefront of global efforts to deliver a commercial-scale quantum system. Backed by 25 years of technological leadership, SQC holds a singular advantage: exclusive capability to manufacture silicon chips with atomic precision, enabling quantum computing systems with world-leading algorithmic fidelity. With in-house QPU manufacturing, SQC iterates new chips weekly while delivering quantum-enhanced AI and materials simulation systems to customers today. The company was founded in 2017 and is headquartered in Sydney, Australia.

Media Contact
press@sqc.com

STAK to Hold Class A Meeting and Extraordinary General Meeting

CHANGZHOU, China, Sept. 16, 2026 /PRNewswire/ — STAK Inc. (the “Company” or “STAK”) (Nasdaq: STAK), a fast-growing company specializing in the research, development, manufacturing, and sale of oilfield-specialized production and maintenance equipment, today announced that it will hold a meeting of the holders of its class A ordinary shares of par value of USD0.001 each (the “Class A Meeting”) at its executive office at Building 11, 8th Floor, No. 6 Beitanghe East Road, Tianning District, Changzhou, Jiangsu, People’s Republic of China 213000, at 10:00 a.m. on October 9, 2026, Beijing/Hong Kong Time. An extraordinary general meeting of shareholders of the Company (the “EGM” and, together with the Class A Meeting, the “Meetings”) will be held immediately thereafter at the same location.

Holders of record of the Company’s class A ordinary shares of par value of USD0.001 each as of the close of business on September 4, 2026 (the “Record Date”) are entitled to receive notice of and to attend and vote at the Class A Meeting and any adjournment or postponement thereof. All registered shareholders of the Company at the close of business on the Record Date are entitled to receive notice of and to attend and vote at the EGM and any adjournment or postponement thereof.

Copies of the notices of the Meetings and the forms of proxy are available on the Company’s corporate investor relations website at https://www.stakindustry.com/ir/.

About STAK Inc.

STAK Inc. is a fast-growing company specializing in the research, development, manufacturing, and sale of oilfield-specific production and maintenance equipment. The Company designs and manufactures oilfield-specialized production and maintenance equipment, then collaborates with qualified specialized vehicle manufacturing companies to integrate the equipment onto vehicle chassis, producing specialized oilfield vehicles for sale. Additionally, the Company sells oilfield-specialized equipment components, related products, and provides automation solutions. Its vision is to help oilfield services companies reduce costs and increase efficiency by providing the cutting-edge integrated oilfield equipment and automation solutions service. Its mission is to become a powerful provider for the niche markets of specialized oilfield vehicles and equipment in China. For more information, please visit the Company’s website at https://www.stakindustry.com/ir/.

Forward-looking Statements

Certain statements in this announcement are forward-looking statements. These forward-looking statements involve known and unknown risks and uncertainties and are based on the Company’s current expectations and projections about future events that the Company believes may affect its financial condition, results of operations, business strategy and financial needs. Investors can find many (but not all) of these statements by the use of words such as “may,” “will,” “expect,” “anticipate,” “aim,” “estimate,” “potential,” “intend,” “plan,” “believe,” “likely to” or other similar expressions in this prospectus. The Company undertakes no obligation to update or revise publicly any forward-looking statements to reflect subsequent occurring events or circumstances, or changes in its expectations, except as may be required by law. Although the Company believes that the expectations expressed in these forward-looking statements are reasonable, it cannot assure you that such expectations will turn out to be correct, and the Company cautions investors that actual results may differ materially from the anticipated results and encourages investors to review other factors that may affect its future results in the Company’s registration statement and other filings with the SEC.

For more information, please contact:

STAK Inc.
Investor Relations Department
Email: ir@stakindustry.com

Ascent Investor Relations LLC
Tina Xiao
Phone: +1-646-932-7242
Email: investors@ascent-ir.com

KSAT Selected by Intuitive Machines to Support NASA’s EAGLE VSWIR Mission

PARIS, Sept. 16, 2026 /PRNewswire/ — Kongsberg Satellite Services (KSAT), a leading provider of ground station networks and satellite operations, announced that KSAT was selected by Intuitive Machines to support NASA’s EAGLE (Explorer for Artemis Geology, Lunar, and Earth) VSWIR Mission, currently scheduled to launch in 2028.

KSAT will operate the IM 300 spacecraft, which will integrate the NASA Jet Propulsion Laboratory (JPL)’s Visible to Shortwave Infrared (VSWIR) instrument to characterize Earth’s surface by investigating ground and water temperature, snow reflectivity, active geologic processes, vegetation traits, and algal biomass. The mission also tests technology that could support future lunar and Mars exploration. Under the partnership between NASA, Intuitive Machines, and KSAT, KSAT will provide its streamlined Integrated Mission Services, inclusive of global ground station services and satellite operations services.

“KSAT is thrilled to support NASA in science and exploration. In partnership with Intuitive Machines, we are eager to provide NASA with mature commercial solutions with predictable costs. We look forward to our continued support for NASA’s mission and their vision of space exploration,” said Dan Adams, General Manager of KSAT Inc.

“Our partnership with KSAT is a critical component of delivering mission success for NASA JPL’s EAGLE-VSWIR mission. By combining Intuitive Machines’ spacecraft and mission integration capabilities with KSAT’s global ground station network and operational expertise, we are confident we can deliver resilient end-to-end services for the successful mission,” said Rizwan Parvez, Senior Director, Business Development at Intuitive Machines.

About KSAT:

Kongsberg Satellite Services (KSAT) is the leading provider of Ground Station Services, Earth Observation Services, and Satellite Operations Services. Headquartered in Tromsø, Norway, the company operates the largest commercial satellite ground station network worldwide, including facilities in Svalbard and Antarctica to provide unique southern hemisphere coverage. Through KSAT Inc., KSAT’s U.S.-based, full-capability subsidiary in Denver, Colorado, delivers mission-critical infrastructure for customers in government, civil, and commercial space in the United States, as well as the global space industry.

Media Contact:
mediacontact@ksat.no

ROSEWOOD HONG KONG NAMED NO.1 IN THE 50 BEST HOTELS 2026 FOR THE SECOND CONSECUTIVE YEAR

  • Rosewood Hong Kong (No.1) has once again been named The World’s Best Hotel 2026
  • The list celebrates hotels from 22 destinations across six continents, with Europe leading the way with 21 winning hotels
  • Chablé Yucatán (No.9) in Mexico wins the Bombay Sapphire Eco Hotel Award, audited by the Sustainable Restaurant Association
  • In its second year, the Johnnie Walker Art of Design Award is presented to Hôtel du Couvent (No.38) in Nice, France
  • James McBride, founder of Nihi Hotels, is celebrated with the SevenRooms Icon Award
  • The Best Boutique Hotel Award is awarded to Passalacqua (No.5) in Lake Como, for a third year
  • Patina Osaka in Japan (No.33) wins the Nikka Best New Hotel Award
  • Other accolades include Ferrari Trento Most Admired Hotel Group Award, awarded to Rosewood; WhistlePig Highest Climber Award goes to Las Ventanas al Paraíso (No.25) in Los Cabos, Mexico; Casa Maria Luigia (No.18) in Modena, Italy wins the Lavazza Highest New Entry Award; and the Best Beach Hotel Award goes to Atlantis The Royal (No.4) in Dubai
  • The Fifth Avenue Hotel (No.78) in New York City received the American Express Travel One to Watch Award and Switzerland’s Badrutt’s Palace (No.36) was honoured with the SeiBellissimi Art of Hospitality Award

PARIS, Sept. 15, 2026 /PRNewswire/ — The list of The 50 Best Hotels has been revealed at a prestigious awards ceremony in Paris. The unveiling recognises exceptional and pioneering hospitality experiences from across the globe.

Rosewood Hong Kong is named No.1 in The 50 Best Hotels 2026 for the second consecutive year at a live awards ceremony held in Paris on 15 September.

See the full list of The 50 Best Hotels 2026 here

Rosewood Hong Kong (No.1) has once again been recognised as The World’s Best Hotel, following its ranking as No.1 in 2025 and No.3 in 2024. The No.2 spot goes to Capella Bangkok and Four Seasons Bangkok at Chao Phraya River ranks at No.3. Asia has 18 hotels including four in Japan: Aman Tokyo (No.11), Bulgari Tokyo (No.24), Patina Osaka (No.33) and Park Hyatt Kyoto (No.37).

Europe leads the way with 21 winning hotels, including six in Italy and France, four in the UK and one in Greece, Monaco, Switzerland and Türkiye. The highest-ranking European entry is Passalacqua (No.5) in Lake Como.

North America lists six properties and South America has two hotels. Oceania has one hotel included, whereas Africa is home to two.

Media Contact: The50BestHotels@thesaucecollective.com

Media Centre: https://mediacentre.the50.com/ 


Introducing Fotor Agent: Create Fully Editable AE-Quality Motion Graphics and Long-Form Videos

Fotor Agent, ranked No. 1 Product of the Day on Product Hunt, turns ideas and raw assets into complete, editable video projects through an intelligent end-to-end production workflow.

LOS ANGELES, Sept. 16, 2026 /PRNewswire/ — Fotor, a leading AI Vibe Marketing Platform serving more than 800 million users worldwide, today announced the launch of Fotor Agent, an AI-powered production system designed to transform how videos are created.


Fotor Agent: Product Overview and Key Features

With Fotor Agent, users can create complete, production-ready videos and 4K motion graphics—all fully editable through natural-language prompts. Starting with a brief or raw source materials, the agent understands creative intent, manages long-horizon logical reasoning and planning, generates supporting assets, organizes scenes, and automatically assembles everything onto a multi-track timeline—giving creators total control to refine every detail.

From AI Generation to AI Production

While generating individual clips with AI video models has become virtually effortless, a major industry bottleneck in video production remains: seamlessly orchestrating these fragmented assets—along with music, voiceovers, motion graphics, and subtitles—into a cohesive, release-ready long-form narrative.

Today’s standard video production pipeline remains notoriously fragmented across a wide array of software. Creators must write scripts, map out storyboards, generate video clips, produce subtitles, synthesize voiceovers, source background tracks, and design custom transitions—all across separate tools. Advanced motion graphics often demand specialized software like Adobe After Effects. Then, bringing dozens or even hundreds of disparate media assets together in a video editor like Premiere Pro or CapCut for manual assembly requires constant context-switching between disconnected apps, consuming an immense amount of time, creative energy, and resources.

Fotor Agent bridges this critical gap through its advanced long-horizon reasoning and planning capabilities. Built for end-to-end production, the agent transforms raw creative vision into fully assembled, production-ready narrative videos within a single, unified environment.

Intent-Driven Narrative & Coordinated Generation: Translates creative intent into comprehensive scripts and storyboards—automatically structuring long-form narrative arcs with dramatic pacing—while dynamically orchestrating all media components to guarantee complete character, product, and visual consistency.

Automated Multi-Track Assembly: The engine instantly populates and aligns all generated assets onto independent, dedicated tracks. Guided by your initial input, it automatically calculates precise layout, timing, and layering across the entire timeline, delivering a complete edit in a single pass without human intervention.

In short: Creators bring the imagination—Fotor Agent handles complete video production inside a single system, eliminating the need for fragmented tools. Whether you’re producing brand campaigns, social ads, product demos, science explainers, data visualizations, corporate reports, or dynamic motion graphic promos, the Agent delivers complete, high-quality, production-ready videos.

Create After Effects-level Precision Motion Graphics

Motion graphics are indispensable to modern visual communications—powering everything from high-impact product demos and corporate reporting to scientific explainers and social campaigns. Yet, achieving After Effects-level motion design has long required specialized software, steep technical barriers, and tedious production cycles.

Fotor Agent reimagines motion graphics production with chat-driven workflows. Creators can simply describe their ideas to instantly produce AE-grade 4K animated infographics—translating raw information like charts, line graphs, data cards, key metrics, and process diagrams with pixel-perfect text accuracy. By automating complex motion design, the Agent cuts production time and costs by two orders of magnitude.

Conventional AI video models bake motion graphics directly into uneditable pixel streams, locking visual layers and timing into static video files where any late-stage modification requires a costly full regeneration. In contrast, Fotor Agent keeps graphic elements fully parametric. Text, brand colors, charts, visual layers, animation pacing, and element positions remain live and fully interactive on the preview canvas.

Editable Projects: Designed for Total Post-Production 

Conventional AI video generators output flattened video files—where even a minor tweak to a specific region or element forces a time-consuming full-project regeneration. Fotor Agent transforms this process by delivering a fully transparent, multi-track editable project. While the AI Agent handles macro narrative structure and orchestration, the built-in editor gives you flexible element-level post-production control.

Complete Non-Destructive Editing Suite:

Decoupled multi-track Timeline: Video, voiceovers, music, sound effects, subtitles, and motion graphics are organized into dedicated tracks. Creators can select specific clips or assets on the timeline for localized manual editing, or attach them in chat for precise, conversational prompt adjustments with the Agent.

Editable Motion Graphics: Empowering creators with granular control over visual elements right on the video canvas. Instead of forcing full scene re-renders for minor updates, creators can directly select and fine-tune motion graphics on the spot—revising text content, adjusting font sizes, customizing color palettes, tweaking line thickness, repositioning elements or reordering flowchart steps through intuitive parameter controls.

Semantic-Level Intelligent Video Editing

Fotor Agent intelligently analyzes video content to grasp your creative vision and key messaging, automatically transforming long-form videos into high-impact highlights. Guided by smart video editing algorithms, it pinpoints peak moments, strips out filler and bloopers, inserts context-aware B-roll, and auto-completes subtitles, background music, and smooth transitions.

Taking editing a step further, the engine intelligently pairs standard video footage with dynamic Motion Graphics and high-end typography. By automatically matching visual styles, layouts, and pacing to your video’s context, it effortlessly elevates ordinary raw footage into sophisticated, professional-grade visual content.

Radical Cost Reduction and Unmatched Production Efficiency

By unifying long-horizon planning, asset generation, motion design, and editing into a single automated workspace, Fotor Agent dramatically slashes production costs and accelerates delivery. What once took marketing teams 3 to 5 days across the entire end-to-end video production pipeline—from initial creative briefing and scripting to asset generation, timeline assembly, final packaging, and adjusting—is now compressed into under 1 hour for 2-minute video, enabling rapid content scaling, low-cost A/B testing, and effortless global campaign rollouts.

End-to-End Automated Orchestration: Instead of manually stitching together fragmented tools and assets, the Agent automatically coordinates narrative design, asset generation, and timeline assembly in a single pass—eliminating the friction of traditional manual workflows and saving significant time.

Non-Destructive Iteration: Continuous revision and editing remain a critical bottleneck in traditional video workflows. Fotor Agent eliminates costly full-project regenerations by allowing precise, element-level adjustments directly on the multi-track timeline and canvas—drastically slashing iteration costs.

Exponential Savings in Motion Graphics: The cost impact is especially striking in high-end motion design. According to Fotor’s internal benchmarks, the Agent cuts MG production costs to 1/200th of traditional After Effects workflows while boosting generation and editing speed 50-fold. Crucially, because elements stay fully parametric, you can edit text, layout, or animation timing on the fly—without paying for extra renders.

New Foundation for AI-Powered Visual Creation

“Professional visual capability should be accessible to everyone,” said Tony Duan, Founder and CEO of Fotor. “Fotor Agent bridges the gap between raw AI output and real-world execution, marking the shift from generating individual assets to completing the entire production process.”

Integrated into Fotor’s AI Vibe Marketing workflow, Fotor Agent extends the platform from image and design creation to end-to-end, fully editable video production.

Fotor Agent is available at www.fotor.com/agent/.

About Fotor

Fotor is a leading AI Vibe Marketing Platform serving more than 800 million users worldwide. It helps individuals, creators, and businesses transform ideas into professional visual content across images, design, and video. Serving users in more than 200 countries and regions, Fotor provides AI-powered creative tools that make advanced visual production faster, simpler, and more accessible.

Website: www.fotor.com

ugee Unveils ArtPlay Pad: EMR-Powered Creative Tablet Turns Children’s 2D Sketches Into Physical 3D Works

Designed for the way today’s youth create—anytime, anywhere, across any medium

SHENZHEN, China, Sept. 16, 2026 /PRNewswire/ — ugee, one of the leading digital hardware and software developers, announced the launch of ArtPlay Pad, a groundbreaking creative tablet tailored for young beginner creators and kids. Departing from one-size-fits-all adult-oriented devices, ArtPlay Pad reimagines the drawing tablet as a portable studio that turns doodles into dimensional designs. It includes a lifetime ibisPaint license, integration with Tripo AI for turning 2D sketches into 3D models, professional EMR pen technology delivering an authentic pen-on-paper feel, and a display with TÜV SÜD Low Blue Light Certification and AG-etched glass anti-glare for eye protection, more comfortable creative sessions.

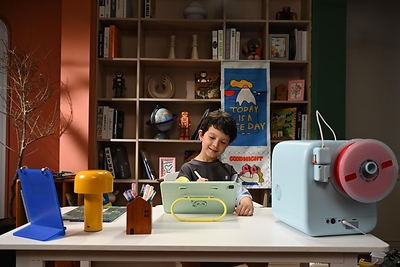
ugee ArtPlay Pad
ugee ArtPlay Pad

“With the rapid advancement of creative tools in both hardware and software sciences, the younger generation has increasingly higher demands for diverse and varied forms of creative expression. Unlike most children’s tablets that use capacitive pen technology, ugee has long focused on EMR pressure-sensitive pen technology for professional creatives, delivering a tactile pen-on-paper feel. Now we are applying this to serve children and DIY creators with a product that enables both paper-like drawing and digital software creation,” said Amy Yuan, Global Brand Director of ugee.

“The ArtPlay Pad features EMR pen technology, broad software compatibility, and AG-etched glass anti-glare for eye health. We want creation to go beyond the mind—so imagination can be truly seen and touched. That is the original intention behind this product, designed to tackle three core challenges: the stroke barrier for a natural writing feel, the 2D-to-3D creative gap to keep the process engaging, and eye-care protection for healthier usage,” she added.

Stroke Barrier — Glass screens feel slick and unresponsive, often discouraging beginners before they begin.

ArtPlay Pad counters this with 16K ultra-sensitive pressure powered by smart chip, and advanced EMR (Electro-Magnetic Resonance) technology, paired with a paper-like anti-glare display and full palm rejection.The result: tactile friction that mirrors pencil on paper, preserving muscle memory and transforming the first stroke from a stumbling block into a confident start. And with access to a vast library of creative and educational apps via Google Play, young creators can explore endless possibilities—from digital painting and 3D modeling to animation and interactive learning—all at their fingertips.

ugee ArtPlay Pad
ugee ArtPlay Pad

2D-to-3D Barrier — Today’s young creators think in volume and space, not just lines.

ArtPlay Pad breaks this barrier with a seamless workflow, powered by deeply integrated ibisPaint (ad-free education version with lifetime access) and Tripo AI. With a single tap, AI converts flat sketches into fully realized 3D models—not cold renders, but living extensions of the original drawing. Models can be exported directly to the ugee Funbox 3D Printer, turning digital designs into tangible creations. This end-to-end workflow embeds STEM learning at every step—from spatial reasoning during modeling to engineering principles during printing. Beyond creative play, 3D design helps children tackle school projects—building historical models, visualizing science concepts, or prototyping inventions—and even create practical tools like phone stands or organizers to help parents at home.

ugee ArtPlay Pad
ugee ArtPlay Pad

Eye-Care Barrier — Parents worry not just about how long kids stare at screens, but what it does to their eyes.

ArtPlay Pad shifts the conversation from duration to depth. The 12″ 2K Eye-Care Display features a 16:9 aspect ratio, 16.7 million colors, full lamination, and anti-glare + anti-fingerprint coating—delivering vivid visuals indoors and out. With TÜV SÜD Low Blue Light Certification and AG-etched glass anti-glare technology, prolonged use causes less eye strain without compromising color accuracy, while reducing distracting reflections for a more comfortable viewing experience.

Premium Hardware That Powers Infinite Creativity

Packed with high-performance hardware, the ArtPlay Pad fuels non-stop creativity. It features 6GB RAM + 256GB expandable storage, holding 50,000+ sketches and hundreds of 3D models. The 7800 mAh battery delivers up to 18 hours of drawing or 12 hours of video playback with 30W fast charging, while the MediaTek Helio G99 octa-core chip ensures smooth performance across 3D tools, education apps, and HD videos. Immersive 360° quad-speaker audio, crisp 13MP rear and 8MP front cameras for calls and photo sharing, and an included adjustable silicone case with a stepless stand and stylus slot complete the experience. At just 7.4mm thin and 644g light, this slim tablet goes wherever inspiration takes you.

Launch and Availability

ArtPlay Pad is available starting September 15, 2026—timed to inspire young creators and reassure parents alike. The device comes with a suite of pre-installed creative apps, cloud-based sharing capabilities, and a protective case designed for on-the-go inspiration. Order now at the ugee official shop to bring home the ultimate creative companion for your child.

About ugee

A global creative hardware enterprise distributing products across 100+ nations, ugee focuses on digital art equipment and educational STEM tools, extending its layout from drawing tablets to household 3D printing to fuel children’s hands-on creativity.

Skyhawk Therapeutics Announces Final Fifteen-Month Results from Phase 1/2 Clinical Trial of SKY-0515 in Huntington’s Disease Patients

  • The fifteen-month dataset represents the final analysis from the Phase 1/2 study
  • At the Month 15 primary timepoint, SKY-0515-treated patients showed a +1.59-point difference in Composite Unified Huntington’s Disease Rating Scale (cUHDRS) change from baseline versus overlap-weighted external natural history control
  • Differences favoring SKY-0515 were statistically significant across all four cUHDRS components – Total Functional Capacity, Total Motor Score, Symbol Digit Modalities Test and Stroop Word Reading Test – and cUHDRS differences favored SKY-0515 at every prespecified timepoint in the study
  • SKY-0515 has shown consistent average reductions in mutant huntingtin protein (mHTT) throughout the study of more than 60% at the 9 mg dose  
  • SKY-0515 has shown consistent average reductions in PMS1 mRNA of more than 25% at the 9 mg dose
  • The Company’s Phase 1/2 program and global Phase 2/3 FALCON-HD 004-ANZ + 004-WW pivotal program for Huntington’s disease now have enrolled over 200 patients across twenty trial sites in ten countries.

BOSTON, Sept. 16, 2026 /PRNewswire/ — Skyhawk Therapeutics, Inc., a clinical-stage biotechnology company developing novel small molecule therapies designed to modulate RNA targets, today announced final fifteen-month results from its Phase 1/2 clinical trial evaluating SKY-0515, an investigational oral treatment for Huntington’s disease (HD).

The Phase 1/2 patient study is a randomized, double-blind, placebo-controlled parallel-group study evaluating two dose levels of SKY-0515 in patients over twelve weeks, followed by a twelve-month blinded Extension period during which all participants receive active treatment at either a low or high dose (4mg or 9mg), with the majority of patients on the 9 mg dose.

At Month 15, the primary timepoint, patients treated with SKY-0515 improved on the cUHDRS by an average of 0.94 points from where they started, while a comparison group of untreated patients from the Enroll-HD natural history database declined by an average of 0.65 points. The gap between the two groups was 1.59 points (95% CI: 1.09, 2.09; p<0.001).

SKY-0515 patients also did better than the comparison group on each of the four measures that make up the cUHDRS: daily function (Total Functional Capacity, +0.98 points), movement (Total Motor Score, −9.38 points, where a lower score is better), processing speed (Symbol Digit Modalities Test, +4.15 points) and reading speed (Stroop Word Reading Test, +4.18 points). All differences were statistically significant.

Table 1. Change from baseline at Month 15 in cUHDRS and its components, SKY-0515 versus overlap-weighted external control

Endpoint

Treated LS Mean
(SE), M15 (n=15)

External Control LS
Mean (SE), M15

Treatment
Difference

95% CI

p-value

cUHDRS (composite)

+0.94 (0.42)

-0.65 (0.27)

+1.59

1.09, 2.09

<0.001

TFC

+0.38 (0.43)

-0.60 (0.26)

+0.98

0.34, 1.61

0.003

TMS

-6.85 (1.02)

+2.53 (0.59)

-9.38

-11.58, -7.19

<0.001

SDMT

+4.63 (1.60)

+0.48 (0.98)

+4.15

1.04, 7.25

0.009

SWRT

+3.55 (1.62)

-0.63 (0.98)

+4.18

0.55, 7.80

0.024

CI = confidence interval; SE = standard error.

The same pattern held throughout the study. At every scheduled checkpoint, SKY-0515 patients were doing better on the cUHDRS than the comparison group: 0.66 points at Month 3, 0.78 points at Month 6, 1.04 points at Month 9, 0.79 points at Month 12 and 1.59 points at Month 15. The difference was statistically significant from Month 9 onward.

On average, SKY-0515-treated patients’ cUHDRS scores held at or above their baseline level at every assessment through Month 15, while the external comparison group’s average score declined from Month 6 onward.

Table 2. Change from baseline in cUHDRS by timepoint, SKY-0515 versus overlap-weighted external control

Timepoint

Treated LS
Mean (SE)

Treated
Patients

External Control LS
Mean (SE)

Treatment
Difference

95% CI

p-value

Month 3

+0.70 (0.30)

n=24

+0.05 (0.47)

+0.66

-0.33, 1.64

0.191

Month 6

+0.47 (0.39)

n=20

-0.31 (0.21)

+0.78

0.00, 1.56

0.051

Month 9

+0.70 (0.38)

n=20

-0.34 (0.23)

+1.04

0.39, 1.70

0.002

Month 12

+0.29 (0.44)

n=18

-0.50 (0.26)

+0.79

0.11, 1.48

0.023

Month 15

+0.94 (0.42)

n=15

-0.65 (0.27)

+1.59

1.09, 2.09

<0.001

CI = confidence interval; SE = standard error. See footnote1 for data analysis discussion.

SKY-0515 has shown consistent average reductions of more than 60% mutant huntingtin protein (mHTT) and 25% PMS1 mRNA in patients at the 9 mg dose throughout the study. Mutant huntingtin is the primary protein responsible for HD pathology, while PMS1 is a key driver of somatic CAG repeat expansion associated with disease progression.

SKY-0515 has demonstrated excellent central nervous system exposure and has been generally well tolerated across all dose levels studied through fifteen months of treatment, with no treatment-related SAEs. 

“Skyhawk’s Phase 1/2 results are extremely encouraging clinical data. A 1.59-point cUHDRS difference versus a rigorously weighted natural history control at fifteen months is exactly the type of signal the field looks for in early studies of a potentially effective therapeutic agent. The consistent effects on function, motor and cognitive measures need to be further studied in ongoing placebo-controlled studies but it is an exciting step forward for HD and the program,” said Dr. Samuel Frank, Director of the Huntington’s Disease Society of America Center of Excellence at Beth Israel Deaconess Medical Center. “SKY-0515’s dual reduction of mHTT and PMS1 addresses two core pathogenic mechanisms of Huntington’s disease. If these findings are confirmed in the ongoing Phase 2/3 FALCON-HD pivotal program, the impact on people living with HD across the world could be profound.”

“For almost two decades, I have fought as an advocate for Huntington’s disease patients, bearing witness to countless heartbreaking trial setbacks that have let our families down. To finally see results like these—patients experiencing improvements in function, movement, and cognition — is what we have been hoping and waiting for,” said Katie Jackson, Chief Executive Officer of Help 4 HD International. “What makes SKY-0515 especially exciting is that it is a pill, taken once a day at home. Every step forward in HD matters and we celebrate all of them, but a therapy that is noninvasive and does not require care in a specialized center has the potential to reach so many more patients – in rural communities, in families who can’t travel, and across the world where care is hard to come by.

My husband didn’t get a treatment in time. I am hopeful that my children and the children of thousands of families like ours will. We are the generation of change, and Skyhawk’s drug, if these promising results are fully confirmed in future trials, is what change looks like.”

“The completion of this Phase 1/2 study with SKY-0515, showing statistically significant clinical benefit across every cUHDRS component, is a powerful demonstration of what Skyhawk’s SKYSTAR® platform can achieve: a daily pill, taken at home, that modifies RNA splicing to lower disease-causing proteins in the CNS and systemically throughout the body,” said Sergey Pauskin, Co-founder and Head of R&D at Skyhawk. “We are applying the same platform to a series of challenging neurological diseases now advancing toward human trials, and the data from SKY-0515 confirms that the possibilities of extraordinary novel drugs generated by Skyhawk’s SKYSTAR platform are very exciting.”

Huntington’s disease is a rare, hereditary, and ultimately fatal neurodegenerative disorder affecting more than 40,000 symptomatic individuals in the United States, with hundreds of thousands impacted worldwide. There are currently no approved therapies shown to slow or halt disease progression.

SKY-0515 is an orally administered investigational small molecule RNA splicing modifier developed using the company’s proprietary SKYSTAR platform. SKY-0515 is designed to reduce both mHTT and PMS1 proteins.

The worldwide Phase 2/3 FALCON-HD-004-WW pivotal study is now active across more than ten countries and twenty clinical sites. SKY-0515’s Phase 1/2 and FALCON-HD pivotal studies have now enrolled more than 200 patients.

Skyhawk expects to advance additional novel therapies targeting rare neurological diseases with no approved disease-modifying treatment into clinical development by the end of 2027.

About the Fifteen-Month Analysis
Phase 1/2 cUHDRS LS mean change from baseline versus external control at 3, 6, 9, 12 and 15 months, and cUHDRS subcomponents LS mean change from baseline versus external control at 15 months, were estimated via overlap-weighted ANCOVA for patients receiving SKY-0515 once daily. Nominal timepoints are anchored to a participant’s first dose of SKY-0515 (Day 1 to Month 3: n=24, Month 6: n=20, Month 9: n=20, Month 12: n=18, Month 15: n=15). Overlap-weighted propensity score weighting was performed using Enroll-HD, 2CARE and CREST-E datasets (Month 3: n=21, Month 6: n=180, Month 9: n=588, Month 12: n=3569, Month 15: n=1337).

Participants received placebo, 3 mg or 9 mg during the first 3 months; afterwards, all participants received 4 mg or 9 mg following Extension-phase randomization. The Month 15 decline in participants partly reflects study design, as the 12-month Extension period caps SKY-0515 exposure at 12 months for participants who initially received 3 months of placebo.

The primary analysis includes all eligible participants with an available Month 15 cUHDRS assessment. Per the study’s statistical analysis plan, a small number of participant-timepoints were excluded following a qualifying intercurrent event — onset of an unrelated medical condition, initiation of a medication that could confound assessment of treatment effect, or a change in background Huntington’s disease therapeutic intervention.

About SKY-0515’s Phase 1/2 Clinical Program
SKY-0515’s Phase 1/2 clinical trial is a first-in-human study designed to evaluate the safety, tolerability, pharmacokinetics, and pharmacodynamics of SKY-0515 in healthy volunteers and patients with early-stage Huntington’s disease (HD).

The trial consists of three parts. Parts A and B evaluated SKY-0515 in Healthy Volunteers. Part C is a randomized, double-blind, placebo-controlled parallel-group study evaluating two dose levels of SKY-0515 in patients with early-stage HD (HD-ISS Stage 1, Stage 2, or mild Stage 3) over 84 days, followed by a twelve-month blinded Extension period during which all participants receive active treatment at either a low or high dose.

Study assessments include measurements of mutant HTT protein, PMS1 mRNA, and cUHDRS.  Enrollment and treatment in the Phase 1/2 study are complete, and the fifteen-month analysis represents the final clinical dataset from the study.

About SKY-0515’s Phase 2/3 FALCON-HD (004-ANZ and 004-WW) Pivotal Program
The FALCON-HD pivotal program (NCT06873334 and NCT07378644) is a randomized, double-blind, placebo-controlled, dose-ranging study evaluating the pharmacodynamics, safety and efficacy of SKY-0515. Eligible patients receive once-daily oral SKY-0515 at one of three dose levels or placebo.

FALCON-HD 004-ANZ enrolled 144 participants with Stage 2 and Stage 3 HD across sites in Australia and New Zealand. Enrollment is complete.

FALCON-HD 004-WW plans to enroll approximately 600 participants with Stage 2 and Stage 3 HD across more than 40 sites worldwide and is actively recruiting.

Additional information regarding FALCON-HD, including participating sites and eligibility criteria, is available at ClinicalTrials.gov and www.FALCON-HD.com.

About Skyhawk Therapeutics
Skyhawk Therapeutics is a clinical-stage biotechnology company leveraging its proprietary SKYSTAR® platform to discover and develop small molecule RNA-modulating therapies for the world’s most intractable diseases. For more information, visit www.skyhawktx.com.

Skyhawk Contact
Maura McCarthy
Head of Corporate Development
maura@skyhawktx.com 

1Phase 1/2 cUHDRS LS mean change from baseline vs. external control at 3, 6, 9, 12 and 15 months, estimated via overlap-weighted ANCOVA, for patients receiving SKY-0515 once-daily. Nominal timepoints are anchored to each participant’s first dose of SKY-0515 (Day 1 to Month 3: n=24, Month 6: n=20, Month 9: n=20, Month 12: n=18, Month 15: n=15). Participants received placebo, 3 mg or 9 mg during the first 3 months; afterwards, all participants received 4 mg or 9 mg following Extension-phase randomization. Overlap-weighted propensity score weighting was performed using Enroll-HD, 2CARE and CREST-E datasets (Month 3: n=21, Month 6: n=180, Month 9: n=588, Month 12: n=3569, Month 15: n=1337).

Note: The Month 15 decline in participants partly reflects study design, as the 12-month Extension period caps SKY-0515 exposure at 12 months for the participants who initially received 3 months of placebo. The primary analysis includes all eligible participants with an available Month 15 cUHDRS assessment. Per the study’s statistical analysis plan, a small number of participant-timepoints were excluded following a qualifying intercurrent event — onset of an unrelated medical condition, initiation of a medication that could confound assessment of treatment effect, or a change in background Huntington’s disease therapeutic intervention.