Home Blog Page 2824

Gorilla Technology Doubles Revenue in First Half of 2025 Amid International Expansion


— Generated H1 2025 revenue of $39.3 million, representing 90.2% year-over-year growth —

— Signed 3 new projects in Taiwan and UK —

— Reduced debt to $18.1 million from $21.4 million at the end of 2024 and $18.4 million at the end of Q1 2025, strengthening financial flexibility and resilience —

— Completed a $105 million equity offering in July 2025 to fund further growth opportunities —

London, United Kingdom–(Newsfile Corp. – August 14, 2025) – Gorilla Technology Group Inc. (NASDAQ: GRRR) (“Gorilla” or the “Company”), a global solution provider in Security Intelligence, Network Intelligence, Business Intelligence and IoT technology, today reported its financial results for the first half ended June 30, 2025.

  • Continued Revenue Growth: H1 2025 revenue reached $39.3 million, reflecting outstanding execution across key global contracts. Topline performance demonstrates Gorilla’s operational strength and leadership in AI-driven security and intelligence.
  • Strong Liquidity Position: Gorilla ended H1 with $26.1 million in total cash. Subsequent to the close of H1, the Company raised $105 million in an equity offering. In July, Gorilla’s largest customer in Egypt made a significant payment, underscoring the strength of its relationships and reinforcing its cash position. The Company intends to use these funds to secure future contracts and drive expansion.
  • Disciplined Debt Reduction: Gorilla cut debt to $18.1 million in H1, down from $21.4 million at the end of 2024 and $18.4 million in Q1 2025, improving capital efficiency as it unlocked pledged deposits. The Company will continue reducing debt as long as it remains accretive and cash-neutral, further strengthening its balance sheet.
  • Continued Focus on Profitability: Operating loss (IFRS) for the six months ended June 30, 2025 was $9.1 million, while Adjusted EBITDA (Non-IFRS) was $5.7 million. Net loss (IFRS) for the six months ended June 30, 2025 was $8.5 million, while Adjusted Net Income (Non-IFRS) was $5.7 million. Adjusted EBITDA and Adjusted Net Income excludes exchange loss from currency devaluation and fair value remeasurement of financial instruments. Gorilla’s performance, excluding non-cash accounting items, demonstrates solid underlying profitability on a normalised basis.
  • Retained Focus on Earnings Per Share: Loss Per Share (IFRS) was $0.43. Adjusted Basic Earnings Per Share (Non-IFRS) of $0.29 reflects solid underlying profitability and the scalability of our core operations.

Statement from Jay Chandan

“Gorilla has completed the first half of 2025 with focus, strength and clear momentum. The results show the underlying profitability of our model and an established growth path as we create value for our customers, shareholders and broader stakeholders. We have delivered on major programmes and signed near-term projects that will accelerate performance in 2026 and beyond. Our plans for global expansion will strengthen our position in Southeast Asia and enhance our delivery capability in key markets.”

“Our teams are executing with discipline and precision, turning strategic opportunities into tangible outcomes. From advancing critical infrastructure in Asia to enabling climate-technology solutions in the Amazon rainforest, we are demonstrating the value and trust we bring to ambitious partners worldwide. This is a foundation for sustainable growth, deeper market penetration and long-term impact.”

Statement from Bruce Bower

“We continue to emphasize financial discipline in everything we do. We have repaid debt by over $3 million this year, while also releasing restricted assets, moving them into unrestricted cash. In the second half, we anticipate continued customer collections and the release of customer guarantees for existing contracts, which should serve to boost our cash flow. Looking forward, we intend to use our large liquidity buffer to capitalize on new commercial opportunities.”

Advancing Long-term Strategy

This quarter Gorilla, signed key contracts with the Port of Tyne in the United Kingdom, Wan Hai Port in Taiwan and ADE Corporation in Taiwan. These agreements reflect the execution of strategies Gorilla has consistently communicated to the market and signal further projects already in motion.

Some additional details on these contracts are below:

  • AI-Powered Wan Hai Smart Surveillance System – Agreement established a partnership with Asia’s leading container shipping companies to deploy next-generation AI automation and computer vision surveillance across a major freight terminal, enhancing yard efficiency, cargo flow management and safety.
  • AI-Enabled ADE CIB Criminal Financial Flow Analysis – Supporting Taiwan’s leading criminal investigation agency with AI-powered analytics to trace cryptocurrency transactions, uncover fund flows and identify criminal networks, enabling speed and precision.

The Company is in active negotiation on several additional contracts. Gorilla’s pipeline now exceeds $5 billion, due to increased capacity across the United States, Middle East and North Africa, Southeast & East Asia, South America and the United Kingdom. Gorilla’s growing contract base, execution track record and market demand position us not just as a growth story, but as a global force in AI-powered transformation.

Financials

GORILLA TECHNOLOGY GROUP INC. AND SUBSIDIARIES
UNAUDITED CONDENSED INTERIM CONSOLIDATED BALANCE SHEETS
AS OF JUNE 30, 2025 AND DECEMBER 31, 2024
(Expressed in United States dollars)

Items June 30,
2025
(Unaudited)
December 31,
2024
(Audited)
Assets
Current assets
Cash and cash equivalents $ 10,110,206 $ 21,699,202
Financial assets at fair value through profit or loss 1,000 1,000
Restricted deposits 16,019,748 15,773,099
Unbilled receivables (Contract assets) 36,883,629 34,306,195
Accounts receivable, net 43,794,936 25,670,157
Inventories – 5,199
Prepayments 18,035,818 28,632,212
Other receivables, net 401,684 432,696
Other current assets 176,903 151,816
Total current assets 125,423,924 126,671,576
Non-current assets
Property and equipment 16,831,268 14,939,143
Right-of-use assets 436,504 505,345
Intangible assets 2,675,916 2,931,661
Deferred tax assets 11,266,450 6,938,213
Prepayments 259,662 315,304
Financial assets at fair value through profit or loss 4,000,000 –
Other non-current assets 1,852,330 1,494,740
Total non-current assets 37,322,130 27,124,406
Total assets $ 162,746,054 $ 153,795,982
Liabilities and Equity
Liabilities
Current liabilities
Short-term borrowings $ 12,187,029 $ 15,073,458
Contract liabilities 265,236 273,227
Accounts payable 30,495,390 26,039,076
Other payables 1,189,270 2,451,135
Provisions 70,664 37,673
Lease liabilities 206,193 210,448
Income tax liabilities 11,063,923 9,028,829
Warrant liabilities 732,887 20,082,272
Long-term borrowings, current portion 1,747,816 1,972,371
Other current liabilities 96,574 142,796
Total current liabilities 58,054,982 75,311,285
Non-current liabilities
Long-term borrowings 4,159,459 4,372,188
Provisions 25,159 22,013
Deferred tax liabilities 1,435,534 42,897
Lease liabilities 480,984 579,699
Guarantee deposits received 408,942 364,047
Total non-current liabilities 6,510,078 5,380,844
Total liabilities 64,565,060 80,692,129
Equity
Equity attributable to owners of parent
Share capital
Ordinary share 21,625 19,443
Capital surplus
Capital surplus 288,904,900 254,585,267
Retained earnings
Accumulated deficit (156,741,789 ) (148,238,729 )
Other equity interest
Financial statements translation differences of foreign operations 1,001,735 (55,500 )
Treasury shares (35,005,477 ) (33,206,628 )
Equity attributable to owners of the parent 98,180,994 73,103,853
Total equity 98,180,994 73,103,853
Total liabilities and equity $ 162,746,054 $ 153,795,982

GORILLA TECHNOLOGY GROUP INC. AND SUBSIDIARIES
UNAUDITED CONDENSED INTERIM CONSOLIDATED STATEMENTS OF COMPREHENSIVE INCOME (LOSS)
SIX MONTHS ENDED JUNE 30, 2025 AND 2024
(Expressed in United States dollars)

Six Months Ended June 30
Items 2025
(Unaudited)
2024
(Unaudited)
Revenue $ 39,325,839 $ 20,674,691
Cost of revenue (25,877,004 ) (2,995,637 )
Gross profit 13,448,835 17,679,054
Operating expenses:
Selling and marketing expenses (742,592 ) (666,312 )
General and administrative expenses (7,270,555 ) (6,381,907 )
Research and development expenses (1,226,139 ) (1,149,834 )
Currency exchange losses, net* (11,552,001 ) (5,028,955 )
Fair value remeasurement of financial instruments (1,531,210 ) (3,278,410 )
Other income 90,529 84,870
Other gains (losses), net (287,314 ) 515,123
Total operating expenses (22,519,282 ) (15,905,425 )
Operating income (loss) (9,070,447 ) 1,773,629
Non-operating income (expenses)
Interest income 1,177,271 392,455
Finance costs (293,673 ) (416,605 )
Total non-operating income (expenses) 883,598 (24,150 )
Profit (loss) before income tax (8,186,849 ) 1,749,479
Income tax expense (316,211 ) (137,891 )
Profit (loss) for the period (8,503,060 ) 1,611,588
Other comprehensive income (loss)
Components of other comprehensive income (loss) that may not be reclassified to profit or loss
Remeasurement of defined benefit plans – 2,112
Components of other comprehensive income (loss) that may be reclassified to profit or loss
Exchange differences on translation of foreign operations 1,057,235 (1,949,532 )
Other comprehensive income (loss) for the period, net of tax 1,057,235 (1,947,420 )
Total comprehensive loss for the period (7,445,825 ) (335,832 )
Earning (loss) per share
Basic earning (loss) per share $ (0.43 ) $ 0.17
Diluted earning (loss) per share $ (0.43 ) $ 0.15
Weighted average shares of ordinary shares outstanding
Basic 19,819,284 9,330,948
Diluted 19,819,284 10,413,870
* During the six months ended June 30, 2025 and 2024, net currency exchange losses amounted to $12,630,726 and $5,883,074, respectively, due to devaluation of monetary assets denominated in the Egyptian pound arising from the sharp depreciation of the Egyptian pound against the U.S. dollar in March 2024.

GORILLA TECHNOLOGY GROUP INC. AND SUBSIDIARIES
UNAUDITED CONDENSED INTERIM CONSOLIDATED STATEMENTS OF CASH FLOWS
SIX MONTHS ENDED JUNE 30, 2025 AND 2024
(Expressed in United States dollars)

Six months ended June 30
2025 2024
CASH FLOWS FROM OPERATING ACTIVITIES
Profit (loss) before tax $ (8,186,849 ) $ 1,749,479
Adjustments
Adjustments to reconcile profit (loss)
Expected credit losses 6,107 364,640
Depreciation expenses 325,824 275,746
Amortization expenses 317,806 442,242
Gain on disposal of property and equipment – (73 )
Share-based payment expenses 271,050 722,176
Share-based compensation expenses 472,642 –
Interest expense 293,673 416,605
Interest income (1,177,271 ) (392,455 )
Unrealized exchange loss 11,224,264 3,993,733
Loss on financial liabilities at fair value through profit or loss 1,531,210 3,278,410
Gain on financial assets at fair value through profit or loss – (548,944 )
Changes in operating assets and liabilities
Changes in operating assets
Unbilled receivables (Contract assets) (39,419,954 ) (20,027,585 )
Accounts receivable, net 6,933,000 3,051,025
Inventories 5,362 1,316
Prepayments 12,749,966 (685,966 )
Other receivables – (433,302 )
Other current and non-current assets (18,406 ) 528,649
Changes in operating liabilities
Contract liabilities (37,362 ) (59,403 )
Notes payable – 34
Accounts payable 4,232,202 (2,160,932 )
Other payables (1,472,181 ) (1,500,939 )
Provisions 24,003 (79,505 )
Other current and non-current liabilities (54,820 ) 48,669
Guarantee deposits received 512 –
Cash flows used in operations (11,979,222 ) (11,016,380 )
Interest received 1,205,745 448,299
Interest paid (324,623 ) (672,592 )
Tax paid (1,420,411 ) (18,106 )
Net cash used in operating activities (12,518,511 ) (11,258,779 )
CASH FLOWS FROM INVESTING ACTIVITIES
Acquisition of property and equipment (328,833 ) (363,096 )
Proceeds from disposal of property and equipment – 143
Acquisition of intangible assets (54,987 ) (57,982 )
Financial assets at fair value through profit or loss (4,000,000 ) –
Investment in restricted deposits (179,930 ) –
Guarantee deposits paid (289,069 ) (41,291 )
Net cash flows used in investing activities (4,852,819 ) (462,226 )
CASH FLOWS FROM FINANCING ACTIVITIES
Proceeds from short-term borrowings 14,327,643 7,050,890
Repayments of short-term borrowings (18,680,180 ) (6,622,572 )
Repayments of long-term borrowings (1,105,138 ) (750,819 )
Principal repayment of lease liabilities (106,870 ) (68,252 )
Repayments of loan from shareholders – (3,000,000 )
Buyback of treasury stocks (1,798,849 ) –
Exercise of share options 17,796 –
Proceeds from preferred shares and private warrants 12,679,732 9,650,000
Exercise of restricted share units – (39,056 )
Proceeds from issuance ordinary share – 11,290,004
Net cash flows from financing activities 5,334,134 17,510,195
Effect of foreign exchange rate changes 448,200 122,449
Net (decrease) increase in cash and cash equivalents (11,588,996 ) 5,911,639
Cash and cash equivalents at beginning of period 21,699,202 5,306,857
Cash and cash equivalents at end of period $ 10,110,206 $ 11,218,496

RECONCILIATION OF OPERATING INCOME (LOSS) AS PER INTERNATIONAL FINANCIAL REPORTING STANDARDS (IFRS) TO ADJUSTED OPERATING INCOME AND ADJUSTED EARNINGS BEFORE INTEREST, TAXES, DEPRECIATION, AND AMORTIZATION (EBITDA)

Six Months Ended June 30
Items 2025
(Unaudited
and
Unreviewed)
2024
(Unaudited
and
Unreviewed)
(Amount in USD)
Operating income (loss) (IFRS) $ (9,070,447 ) $ 1,773,629
Add: Exchange loss from currency devaluation 12,630,726 5,883,074
Add: Fair value remeasurement of financial instruments 1,531,210 3,278,410
Adjusted Operating income (Non-IFRS) $ 5,091,489 $ 10,935,113
Add: Depreciation expenses 325,824 275,746
Add: Amortization expenses 317,806 442,242
Adjusted EBITDA (Non-IFRS) $ 5,735,119 $ 11,653,101

RECONCILIATION OF IFRS NET INCOME (LOSS) TO ADJUSTED NET INCOME (NON-IFRS)

Six Months Ended June 30
Items 2025
(Unaudited
and
Unreviewed)
2024
(Unaudited
and
Unreviewed)
(Amount in USD)
Net income (loss) (IFRS) $ (8,503,060 ) $ 1,611,588
Add: Exchange loss from currency devaluation 12,630,726 5,883,074
Add: Fair value remeasurement of financial instruments 1,531,210 3,278,410
Adjusted Net income (Non-IFRS) $ 5,658,876 $ 10,773,072

RECONCILIATION OF EARNINGS (LOSS) PER SHARE (IFRS) TO ADJUSTED EARNINGS PER SHARE (NON-IFRS)

Six Months Ended June 30
Items 2025
(Unaudited
and
Unreviewed)
2024
(Unaudited
and
Unreviewed)
(Amount in USD)
Basic Earnings (loss) per share (IFRS) $ (0.43 ) $ 0.17
Add: EPS impact of Exchange loss from currency devaluation 0.08 0.35
Add: EPS impact of Fair value remeasurement of financial instruments 0.64 0.63
Adjusted Basic Earnings per share (Non-IFRS) $ 0.29 $ 1.15

Note: All per share amounts in above table are calculated using the basic weighted average ordinary shares outstanding of 19,819,284 and 9,330,948 for the six months ended June 30, 2025 and 2024, respectively.

About Gorilla Technology Group Inc.

Headquartered in London U.K., Gorilla is a global solution provider in Security Intelligence, Network Intelligence, Business Intelligence and IoT technology. We provide a wide range of solutions, including Smart City, Network, Video, Security Convergence and IoT, across select verticals of Government & Public Services, Manufacturing, Telecom, Retail, Transportation & Logistics, Healthcare and Education, by using AI and Deep Learning Technologies.

Our expertise lies in revolutionizing urban operations, bolstering security and enhancing resilience. We deliver pioneering products that harness the power of AI in intelligent video surveillance, facial recognition, license plate recognition, edge computing, post-event analytics and advanced cybersecurity technologies. By integrating these AI-driven technologies, we empower Smart Cities to enhance efficiency, safety and cybersecurity measures, ultimately improving the quality of life for residents.

For more information, please visit our website: Gorilla-Technology.com.

Forward-Looking Statements

This press release contains “forward-looking statements” within the meaning of the “safe harbor” provisions of the Private Securities Litigation Reform Act of 1995. Gorilla’s actual results may differ from its expectations, estimates and projections and consequently, you should not rely on these forward-looking statements as predictions of future events. Words such as “expect,” “estimate,” “project,” “budget,” “forecast,” “anticipate,” “intend,” “plan,” “may,” “will,” “could,” “should,” “believes,” “predicts,” “potential,” “might” and “continues,” and similar expressions are intended to identify such forward-looking statements. These forward-looking statements include, without limitation, statements regarding our beliefs about future revenues, our ability to convert our pipeline, our ability to and the circumstances under which we would reduce our debt, our ability to attract the attention of customers and investors alike, our expansion into southeast Asia, Gorilla’s largest projects and ability to win additional projects and execute definitive contracts related thereto, along with those other risks described under the heading “Risk Factors” in the Form 20-F Gorilla filed with the Securities and Exchange Commission (the “SEC”) on April 30, 2025 and those that are included in any of Gorilla’s future filings with the SEC. These forward-looking statements involve significant risks and uncertainties that could cause actual results to differ materially from expected results. Most of these factors are outside of the control of Gorilla and are difficult to predict. Should one or more of these risks or uncertainties materialize, or should underlying assumptions prove incorrect, actual results may vary materially from those indicated or anticipated by such forward-looking statements. Readers are cautioned not to place undue reliance upon any forward-looking statements, which speak only as of the date made. Gorilla undertakes no obligation to update forward-looking statements to reflect events or circumstances after the date they were made except as required by law or applicable regulation.

Public Relations Contact:
Samantha Dowd
Prosek Partners
GRRR@prosek.com

Investor Relations Contact:
Dave Gentry
RedChip Companies, Inc.
1-407-644-4256
GRRR@redchip.com

The issuer is solely responsible for the content of this announcement.

About Gorilla Technology Group Inc.

Viscount Mining’s Passiflora Discovery Drill Hole Intersects Robust Copper-Gold Porphyry System Over Entire 843.9 Metre Interval

Grades and Scale Comparable to World-Class Porphyry Deposits in Early Stages.

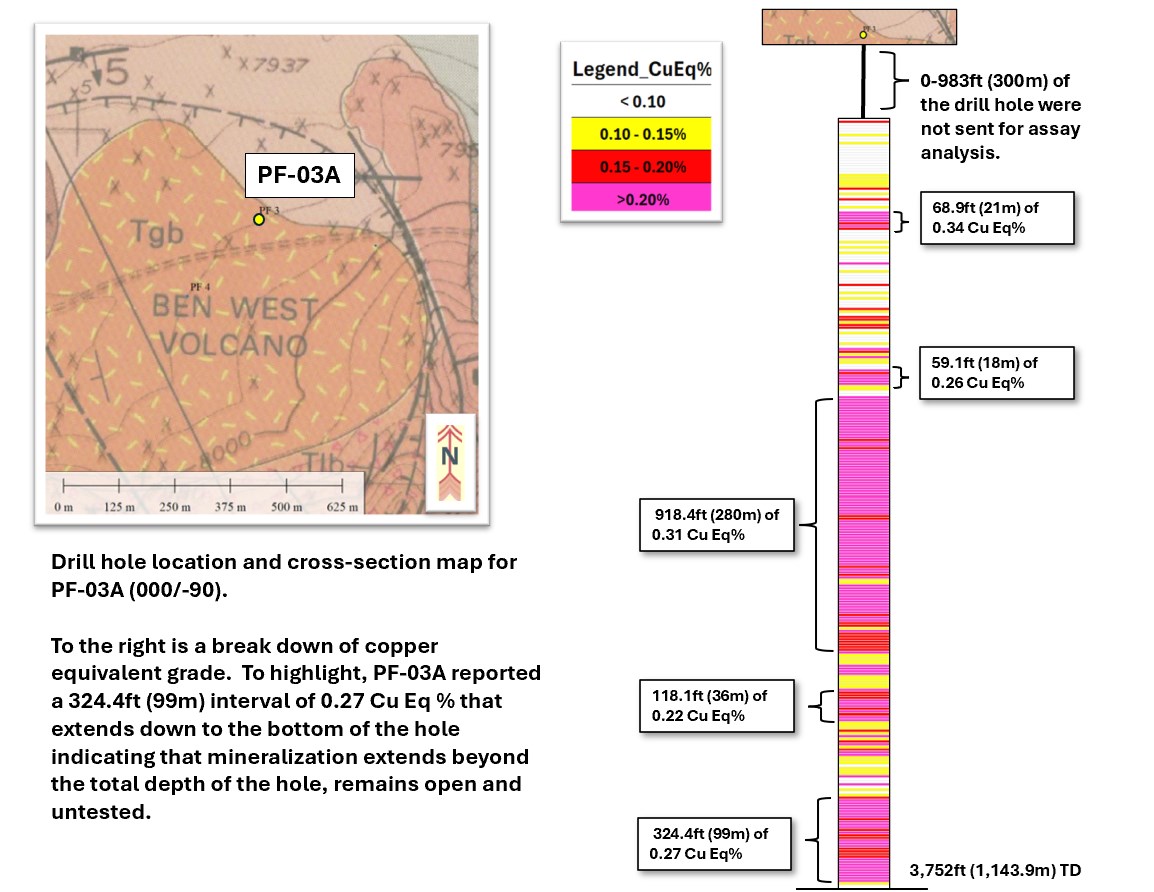
Vancouver, British Columbia – Newsfile Corp. – August 14, 2025 – Viscount Mining Corp. (TSXV: VML) (OTCQB: VLMGF) (“Viscount” or the “Company”) is pleased to announce a pivotal early-stage discovery at its Passiflora porphyry target in Silver Cliff, Colorado. The Company’s first deep drill hole (PF-03A) intersected 843.9 metres of continuous copper-gold mineralization averaging 0.214% CuEq, including multiple higher-grade zones such as 189 m at 0.326% CuEq and 45 m at 0.417% CuEq. These grades exceed typical early-stage porphyry exploration thresholds (~0.15% CuEq) often seen in the initial drilling of deposits that evolved into world-class, long-life operations, and the target remains open in all directions and at depth.

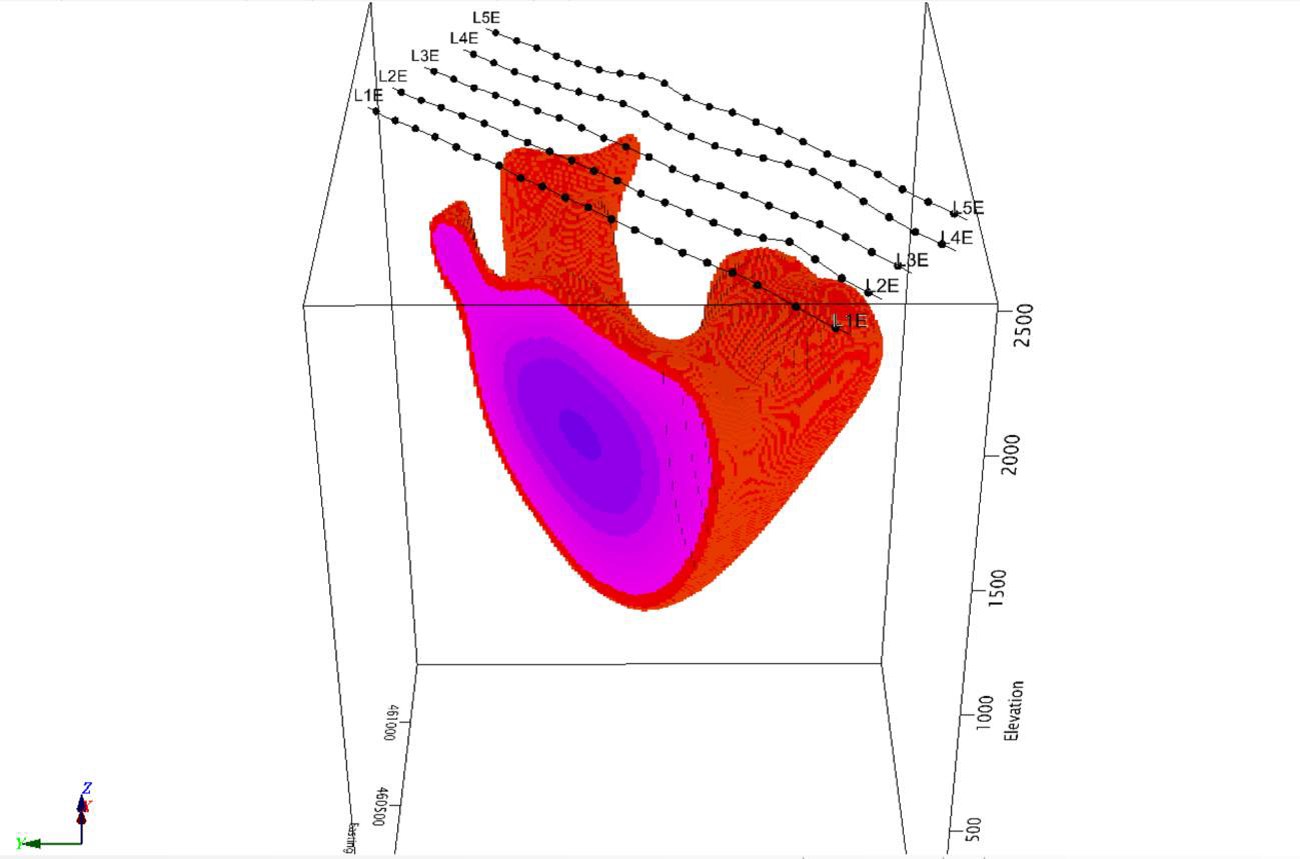
Drill hole PF-03A was designed to test a very strong geophysical anomaly identified by Quantec Geoscience’s Titan MT survey in 2023. The survey outlined a strong conductive target beginning at ~400 m and extending to at least 1,500 m depth and over 2km in horizontal distance. Drilling began in mid-January 2025 and concluded March 7, 2025 at a final depth of 1,144 m due to equipment challenges, short of the planned 1,500 m target.

The upper 300 metres of core were not assayed, as the Titan MT model indicated the main conductor began around 400 metres. However, visual inspection of the core confirmed strong sulfide mineralization from surface to 300 metres. This zone remains a high-priority target for future sampling and reassessment. The principal objective of the drill hole was to determine whether the geological target was indeed a porphyry system, and not a different type of conductive anomaly. We are thrilled to report that not only did the drilling confirm the presence of a copper-gold porphyry system, but it also revealed consistently anomalous concentrations of copper, molybdenum, zinc, and lead, alongside a significant presence of gold.

Viscount CEO Jim MacKenzie stated, “With grades like this, especially with nearly half the samples above 0.20% CuEq, are a clear signal we’re dealing with a significant deposit. The presence of multiple, thick, higher-grade zones-such as 189 m at 0.326% CuEq including 45 m at 0.417% CuEq, and 99 m at 0.278% CuEq including 24 m at 0.306% CuEq-well above typical early-stage porphyry levels, reinforces Passiflora’s potential as an extensive, long-life copper-gold system.”

“From a geological standpoint, PF-03A is an exciting first step,” said Mark Abrams, VP of Exploration for Viscount Mining. “The consistent copper values throughout the hole, the upward grade trend with depth, and the presence of multiple minerals typically associated with mature porphyry systems all point to a robust porphyry deposit. These are exactly the kind of early results we look for in a discovery program – the system is open in every direction, and we’ve only just begun to explore its full potential.”

A “porphyry copper deposit” is a specific subtype genetically and structurally associated with porphyritic intrusive igneous rocks. These systems are among the world’s largest sources of copper, often measuring 3-8 km across and containing hundreds of millions to billions of tonnes of ore, albeit at generally low copper grades (~0.2-1%). The PF-03A drill hole results confirm that the Passiflora target is a porphyry-style system-an encouraging outcome because such deposits have the potential to support long-life, large-scale mining operations.

Summary Statistics

  • Average CuEq: 0.2163% (2,163 ppm)
  • Maximum CuEq: 0.7826% (7,826 ppm) – Sample 179326
  • Minimum CuEq: 0.0361% (361 ppm) – Sample 179211
  • Standard Deviation: ~0.146%

Economics

Average grade 0.2163% – well above typical porphyry cut-offs

Key Observations

  • Gold dominates the copper equivalent value (40.1%)
  • Copper remains significant at 48.9% of total value
  • Economic continuity excellent with 47% of samples above cut-off
  • Resource potential upgraded due to gold credit

Deposit Classification

This is a gold-rich porphyry copper deposit with:

  • Primary copper mineralization (48.9% of value)
  • Significant gold credits (40.1% of value)
  • Supporting polymetallic credits (Zn, Mo, Pb

Top 20 Highest Grade Intervals

Rank Sample CuEq (%) Au (ppb) Cu (ppm) Pb (ppm) Zn (ppm) Mo (ppm)
1 179326 0.7826 835 1027 3481 2963 22
2 179242 0.7758 918 30 112 3413 140
3 179473 0.5547 209 944 10000 3244 168
4 179464 0.5221 615 3913 108 1320 22
5 179463 0.8912 534 4755 116 1120 28
6 179391 0.8034 428 3979 90 1520 17
7 179461 0.7966 459 4080 69 1200 18
8 179465 0.7815 488 3733 82 1260 15
9 179390 0.7774 412 3867 95 1410 16
10 179462 0.7633 381 3918 74 1240 14
11 179392 0.7475 384 3596 89 1380 13
12 179389 0.7320 356 3509 88 1320 12
13 179467 0.7144 341 3385 76 1180 11
14 179466 0.7044 329 3299 79 1150 10
15 179388 0.6991 324 3258 81 1140 9
16 179468 0.6902 312 3178 75 1110 8
17 179387 0.6779 298 3089 77 1080 7
18 179469 0.6720 289 3045 73 1050 6
19 179386 0.6636 281 2976 71 1020 5
20 179470 0.6584 275 2934 69 1000 4

Lead, zinc, and molybdenum are also present.
Lead up to 1.02%
Zinc up to 0.33%
Molybdenum values reaching 892 ppm

All 303 samples reported above the detection limit for gold, with scattered half-gram per ton results, with a high gold anomaly of 918 ppb Au. The hole is averaging 134.16 ppb Au.

Copper grades consistently increased with depth, suggesting that stronger mineralization may continue beyond the current hole bottom. Anomalous zinc and lead were encountered throughout, with lead peaking at 1.02%. Gold was detected in every fire-assayed sample over the 843.9 metres, with values up to 918 ppb.

With grades already above typical early porphyry exploration thresholds and nearly half our samples in the economic range, these results from hole PF-03A are an exceptional start.

Drill Hole PF-03A Location and Cross Section Map

To view an enhanced version of this graphic, please visit:
https://images.newsfilecorp.com/files/2736/262389_0bc86a82f4e609b5_002full.jpg

The Passiflora deep discovery hole is located approximately 3.2 km north of the town of Silver Cliff, within the Ben West volcanic center as mapped by the USGS (Sharp, 1978). The project remains open in all directions and at depth.

3-D view of the 3-D model clipped at less than 2 Ohm-m looking east.

To view an enhanced version of this graphic, please visit:
https://images.newsfilecorp.com/files/2736/262389_0bc86a82f4e609b5_003full.jpg

The main body of the conductive anomaly starts at a depth of ~400m and continues another ~1.5km, maybe deeper (this was the extent of the MT survey depth capability). The length of the anomaly is ~2.4km in the SW-NE direction with a width of at least 700m and an open interpretation in multiple directions. This represents a total volume of over 665,000,000m3 as determined by Quantec.

Passiflora’s early CuEq intercepts (~0.18-0.21% CuEq) sit within the range of early-stage results from some recognized world class porphyry discoveries. The results are encouraging, particularly because copper is increasing with depth and multiple metals are present.

Next Steps

Viscount’s technical team is planning an expanded drilling campaign to test deeper into the Titan MT anomaly at the Passiflora and step out laterally to define the system’s scale. Further metallurgical work will be undertaken to assess potential recovery rates for all metals.

Qualified Persons

The scientific and technical information contained in this news release has been reviewed and approved by Harald Hoegberg PG, an independent consulting geologist who is a “Qualified Person” (QP) as such term is defined under National Instrument 43-101 – Standards of Disclosure for Mineral Projects (“NI 43-101”).

Sample Handling and Analytical Procedures.

Drilling on the deep Passiflora target began on January 22, 2025 by Godbe Drilling from Montrose, CO. Core was placed in boxes and moved to Viscount’s field camp in Silver Cliff for rock quality determinations and preliminary logging. The core boxes were palletized in the field camp and shipped with Old Dominion Freight to MLD, an independent contractor, based in Carlin, NV. The core was cut in half so 50% could be retained for later examination and analysis. The remaining 50% is the assay split used for the sample. It was photographed by MLD employees, and standards, blanks and duplicates were inserted at regular intervals as determined by Viscount’s Silver Cliff “Silver Cliff Drill Program Procedures” by C. Ricks, an independent geologic consultant.

The core samples were bagged and palletized by C. Ricks and shipped by Old Dominion Freight to SGS prep facility in Phoenix AZ. SGS added their QA/QC procedures. The samples then got shipped from SGS Phoenix facility to SGS analytical facility in Burnaby, B.C. Canada for ICP analysis with a method code description of: 4 Acid Digestion (HCL/HCLO4/HF/HNO3) ICP. Fire assay analysis for gold via FAA30V5 with a method code of Au, FAS, exploration grade, AAS.

Assumptions for Copper Equivalent % Calculations

Metal Prices – 2024 averages
Cu $4.20/lb | Au $34,888.79/lb ($2,389/oz) | Pb $1.0345/lb | Zn $1.40/lb | Mo $22.50/lb
Recovery Rates: – based on Western North American copper porphyry production disclosures
Cu 90% | Au 70% | Pb 60% | Zn 67% | Mo 80%

Formula Used:

To view an enhanced version of this graphic, please visit:
https://images.newsfilecorp.com/files/2736/262389_0bc86a82f4e609b5_004full.jpg

About Viscount Mining (TSXV: VML) (OTCQB: VLMGF)

Viscount Mining is a project generator and an exploration company with a portfolio of silver and gold properties in the Western United States, including Silver Cliff in Colorado and Cherry Creek in Nevada.

The Silver Cliff property in Colorado lies within the historic Hardscrabble Silver District in the Wet Mountain Valley, Custer County, south-central Colorado. It is located 44 miles WSW of Pueblo, Colorado, and has year-around access by paved road. The property consists of 96 lode claims where high grade silver, gold and base metal production came from numerous mines during the period 1878 to the early 1900’s. The property underwent substantial exploration between 1967 and 1984. The property is interpreted to encompass a portion of a large caldera and highly altered sequence of tertiary rhyolitic flows and fragmental units which offers potential to host deposits with both precious and base metals. This has been demonstrated in the mineralization historically extracted from the numerous underground and surface mining operations. Based on the accumulated data and feasibility study, Tenneco Minerals made the decision with silver at $5.00 USD an ounce to construct at that time a $35,000,000 USD milling operation for the extraction of the silver reserves at Silver Cliff. Shortly thereafter Tenneco’s Mining Unit was sold, and the planned milling operation was abandoned.

The Cherry Creek exploration property is in an area commonly known as the Cherry Creek Mining District, located approximately 50 miles north of the town of Ely, White Pine County, Nevada. Cherry Creek consists of 578 unpatented and 17 patented claims as well as mill rights. Cherry Creek includes more than 20 past producing mines.

For additional information regarding the above noted property and other corporate information, please visit the Company’s website at www.viscountmining.com.

ON BEHALF OF THE BOARD OF DIRECTORS

“Jim MacKenzie”
President, CEO and Director

For further information, please contact:
Viscount Investor Relations
Email: info@viscountmining.com

Neither TSX Venture Exchange nor its Regulation Services Provider (as that term is defined in the policies of the TSX Venture Exchange) accepts responsibility for the adequacy or accuracy of this release.

Forward-Looking Statements

This news release includes certain statements that may be deemed “forward-looking statements” within the meaning of applicable Canadian securities legislation. Forward-looking statements include, but are not limited to, statements with respect to Viscount Mining’s operations, exploration and development plans, expansion plans, estimates, expectations, forecasts, objectives, predictions and projections of the future. Specifically, this news release contains forward looking statements with respect to the actual size of the anomaly, feasibility, grade of mineralization and the content of the mineralization. Generally, forward-looking statements can be identified by the forward-looking terminology such as “plans”, “expects” or “does not expect”, “is expected”, “budget”, “scheduled”, “estimates”, “projects”, “intends”, “anticipates”, or “does not anticipate”, or “believes”, or “variations of such words and phrases or state that certain actions, events or results “may”, “can”, “could”, “would”, “might”, or “will” be taken”, “occur” or “be achieved”. Forward-looking statements are subject to known and unknown risks, uncertainties and other factors that may cause the actual results, level of activity, performance or achievements of Viscount Mining to be materially different from those expressed or implied by such forward-looking statements, including but not limited to: risks related to the exploration and development and operation of Viscount Mining’s projects, the actual results of current exploration, development activities, conclusions of economic evaluations, changes in project parameters as plans continue to be refined, future precious metals prices, as well as those factors discussed in the sections relating to risk factors of our business filed in Viscount Mining’s required securities filings on SEDARPlus. Although Viscount Mining has attempted to identify important factors that could cause results to differ materially from those contained in forward-looking statements, there may be other factors that cause results to be materially different from those anticipated, described, estimated, assessed or intended.

There can be no assurance that any forward-looking statements will prove accurate, as actual results and future events could differ materially from those anticipated in such statements. Accordingly, readers should not place undue reliance on forward-looking statements. Viscount Mining does not undertake to update any forward-looking statements that are incorporated by reference herein, except in accordance with applicable securities laws.

The issuer is solely responsible for the content of this announcement.
Crypto Funds Watch Acquires CryptoFund.News

NEW YORK, Aug. 14, 2025 /PRNewswire/ — Crypto Funds Watch, a monthly publication with a curated community of more than 4,000 institutional professionals in the crypto funds sector, has announced the successful acquisition of CryptoFund.News, a niche news outlet exclusively covering crypto hedge funds, crypto quants, and digital asset managers.

Founded in 2020, the team behind CryptoFund.News has deep roots in the digital assets space, with extensive involvement in several crypto hedge funds and asset management firms. Under the acquisition,Crypto Funds Watch delivers timely insights and in-depth analysis across the cryptocurrency and blockchain industry, targeting a high-value audience including crypto hedge and venture funds, high-net-worth individuals, fund of funds, pension funds, and endowments. Coverage spans capital raising, fund launches, acquisitions, investment strategies, personnel moves, and allocation trends—keeping its readership fully informed on critical developments in the digital asset sector.

The acquisition brings together two highly specialized platforms with complementary strengths. Crypto Funds Watch’s focused reporting and engaged institutional audience align seamlessly with CryptoFund.News’ legacy of dedicated coverage for the crypto funds ecosystem.

About CryptoFund.News
CryptoFund.News was founded in 2020 by Marc P. Bernegger, a serial tech entrepreneur active in emerging industries for over two decades. Marc has built, sold and invested in numerous ventures. He explored Bitcoin in 2012 and has been investing in crypto hedge funds since 2018.

About Crypto Funds Watch 
Crypto Funds Watch is a monthly publication dedicated to the intersection of cryptocurrency and institutional capital. Through exclusive insights, breaking news, and expert analysis, CFW serves as a vital information hub for decision-makers in the global crypto funds industry.

Website: cryptofunds.watch

Contact:
Email: contact@cryptofunds.watch

Sisram Medical will Report H1 2025 Financial Results on August 20 and Hold a Conference Call on August 21

H1 2025 conference call to be held on August 21, at 8:30 a.m. Eastern Time

HONG KONG, Aug. 14, 2025 /PRNewswire/ — Sisram Medical Ltd (the “Company” or “Sisram“, stock code: 1696.HK; together with its subsidiaries referred to as the “Group“), a global consumer wellness group featuring a first-of-its-kind synergistic ecosystem of business building blocks and consumer-focused brands, including energy-based devices, injectables, and other complementary offerings, today announced that it expects to release its financial results for H1 2025, ended June 30 on Wednesday, August 20, 2025.

Sisram’s management team will host a conference call to discuss the financial results on Thursday, August 21, 2025, at 8:30 a.m. Eastern Time.

Speakers will include Mr. Liu Yi, Sisram’s Chairman, Mr. Lior Dayan, Sisram’s Chief Executive Officer, Mr. Jiahong Li, Sisram’s CFO, Mr. Doron Yannai, Alma’s CFO, and Ms. Qianli Fang, Sisram’s Secretary of the Board.  Following the prepared remarks, management will be available for a Q&A session.

The conference call can be accessed using the following link.
Register here: https://clsa.zoom.com/meeting/register/RkOF0QR7RA6lwi2Aodo_-A 

After registering, you will receive a confirmation email with instructions for joining the webinar.

The conference call will begin at:
8:30 a.m. Eastern Time
5:30 a.m. Pacific Time
3:30 p.m. Israel Time

A replay will also be available on Sisram Medical’s IR Events & Presentations page.

About Sisram Medical Ltd 

Sisram Medical Ltd (1696.HK) is a global consumer wellness group, featuring a first-of-its-kind synergistic ecosystem of business building blocks and consumer-focused brand, emphasizing energy-based devices and injectables, alongside other complementary offerings. The Company is majority owned by Fosun Pharma, one of China’s leading healthcare groups. On September 19, 2017, Sisram Medical went public on the Main Board of the Hong Kong Stock Exchange.

Sisram Medical – Enhancing Quality of Life
http://www.sisram-medical.com 

Fysin Hair Unveils Invisi Drawstring Glueless Wigs, Steering the Wig Industry Toward Sustainability

DENVER, Aug. 14, 2025 /PRNewswire/ — Recently, Fysin Hair proudly launches its Invisi Drawstring collection, marking a pivotal step in sustainable beauty. Engineered with an innovative internal drawstring system and crafted from recycled monofilament mesh, these 100% human hair wigs eliminate the need for chemical adhesives, reduce single-use waste and champion a circular lifecycle from sourcing to storage.

Zero-Waste Installation

Traditional lace-front wigs rely on acrylic or silicone-based glues that generate chemical runoff, disposable tapes and scalp irritation. Fysin Hair’s Invisi Drawstring system replaces adhesives with a concealed, adjustable drawcord that:

  • Secures via gentle tension, keeping the wig firmly in place through commutes, workouts and windy days
  • Leaves no residue, so wearers avoid toxic removers and lengthy cleanup
  • Reduces single-use accessories, cutting thousands of glue strips from landfills annually

Sustainable Cap Engineering

Each Invisi Drawstring wig features:

  • Recycled Monofilament Panels: Ultra-breathable mesh made from post-consumer plastics conforms comfortably to the scalp while promoting airflow
  • Integrated Drawstring Mechanism: A discrete, durable cord hidden in the cap’s perimeter allows precise tightening for every head shape without pins or tapes
  • Modular Combs & Straps: Replaceable interior combs and adjustable straps extend cap lifespan and empower users to refresh their fit without discarding the entire wig
  • Biodegradable Packaging: Collapsible, recycled-cardboard boxes and organic-cotton storage bags eliminate foam inserts and plastic wrap

Performance Meets Environmental Responsibility

Beyond installation, Fysin Hair addresses every stage of a wig’s lifecycle:

  1. Gentle Care Regimen — Recommended use of plant-derived, sulfate-free shampoos and conditioners that rinse clean without polluting waterways
  2. Component Swaps — Swap worn combs or straps in minutes, mirroring “repairability” standards in sustainable electronics
  3. Second-Life Program — Gently used wigs are accepted for donation to medical-aesthetic charities; irreparable fibers are collected for textile recycling or upcycling

“Our goal was to create a wig that’s as kind to the planet as it is to the wearer,” said Zhanwei Huang, co-founder of Fysin Hair. “By removing glues and embracing recycled materials, we’re redefining what sustainable luxury looks like—without compromising on style or comfort.”

Customer Spotlight

“No more sticky glue or itchy scalp — just a super-secure fit thanks to the hidden drawcord.” — Amari Kirscht, beauty influencer

Amari — a high-profile beauty creator — praised the Invisi Drawstring Glueless Wig for its lightweight, natural feel, breathable recycled monofilament cap, and reliably secure fit that holds up through long shoot days and outdoor activity. She also highlighted how effortless it is to wear and remove, and how the eco-friendly packaging adds to the product’s everyday appeal. Her on-camera endorsement reinforces Fysin Hair’s aim to blend professional performance with genuine sustainability.

Meeting Diverse Needs

The Invisi Drawstring collection caters to a wide spectrum of users:

  • Medical and Alopecia Patients who require gentle, irritation-free solutions
  • Active Lifestyles: Runners, dancers and fitness enthusiasts benefit from secure, slip-resistant wear
  • Fashion and Cosplay Creators seeking quick changes, on-camera confidence and clean removals
  • Everyday Wearers who value convenience, comfort and eco-friendly credentials

Charting the Future of Green Wigs

While Invisi Drawstring represents today’s innovation, Fysin Hair is already exploring next-generation technologies:

  1. 3D-Printed Custom Caps to eliminate waste from standard sizing and trimming
  2. AI-Driven Pigment Matching for zero-waste dye processes and perfect color accuracy
  3. Biodegradable Lace Fronts under development to close the loop on wig recyclability

Industry analysts forecast that the global wig market—projected to exceed $8 billion by 2027—will increasingly prioritize sustainable solutions. Fysin Hair’s Invisi Drawstring line positions the brand at the forefront of this transformation.

Availability

The Invisi Drawstring Glueless collection is now available at the Fysin Store — Click Buy Now to shop and enjoy a flawless, barely-there fit from day one.

About Fysin Hair

Founded in 2023, Fysin Hair is a pioneer in eco-conscious wig design. Committed to transparency, each human-hair unit is traceably sourced under fair-trade agreements and accompanied by an ethical origin certificate. Through innovative materials, modular construction and circular-economy initiatives, Fysin Hair delivers premium, planet-friendly hair solutions.
Fysin Hair Official Website
TikTok @fysinhair
YouTube @fysinhair
Facebook @fysinhair


Normet Group: Record high quarterly order intake, profitability weighed down by lower deliveries and currency effect

HELSINKI, Aug. 14, 2025 /PRNewswire/ — Normet Group has published its Half-year Financial Report for 1 January-30 June 2025 on 14 August 2025. Below is a summary of the report. The full document is available at https://www.normet.com/en/discover-normet/about-us/financial-reports/.

Highlights of April−June 2025

  • Order intake increased by 47.1% and reached a quarterly record of EUR 174 million (118), including a number of key strategic projects across several markets.
  • Net sales decreased by 10.0% to EUR 108 million (120) as a result of lower deliveries and an adverse currency effect.
  • Comparable operating profit amounted to EUR 8 million (15), representing 7.4% (12.3%) of net sales. The decline was mainly driven by lower deliveries and an adverse currency effect.

Highlights of January−June 2025

  • Order intake increased by 24.3% to EUR 285 million (230) with significant orders in the Equipment business line, particularly in North America and Asia-Pacific regions.
  • Net sales decreased by 10.5% to EUR 209 million (233) as a result of the timing of deliveries being weighed more towards the end of the year and an adverse currency effect.
  • Comparable operating profit amounted to EUR 11 million (27), representing 5.1% (11.4%) of net sales. The decline was mainly driven by lower deliveries, an adverse sales mix, and an adverse currency effect.
  • Lost Time Injury Frequency Rate (LTIFR) at the end of the reporting period was 1.81 (2.4), nearing Normet’s long-term target of less than 1.5.
  • Gearing stood at 99.5% (82.7%). The redemption of the hybrid bond increased the gearing.

Chief Executive Officer Ed Santamaria, comments:

“The positive improvement in market demand for our underground mobile equipment continued throughout Q2, and in fact, we secured record new orders of 174 MEUR. The major orders in Q2 came from across several of our markets and included a number of key strategic projects that are critical for Normet’s longer-term future.

Several of the new major equipment orders include Normet service agreements, which are under finalization and expected to be booked in Q3. The order pipeline remains healthy with major new orders expected to materialize in Q3 and Q4.

Net sales development was a disappointing 10% below the corresponding Q2 2024 period. Slower delivery of mobile equipment and negative FX across all Business lines remain the main contributors to the lower sales. Equipment output and final customer deliveries have increased progressively since the start of the year, and additional production capacity has been added to the lines to manage the increased order backlog and secure the H2 unit deliveries.

The low profitability result in Q2 is disappointing for Normet and is an area that the management is committed to improve with urgency. To a large extent, lower volumes and negative FX across the Business Lines contributed to lower margins as did additional up-front investments in technology development, predominantly in electrification and automation, which are essential to a number of our new orders. Actions to improve the profitability across the business have been prioritized.

Our focus for H2 is on finalizing the larger service agreement opportunities, securing new equipment orders, and executing on our delivery and sales plans for the remaining part of 2025.”

Outlook

Demand for Normet’s products and expertise, customer process improvements, services, and consumables is expected to remain high in the medium term.

1 Last 12 months

For more information, please contact:
Timo Koponen, Chief Financial Officer, Normet Group Ltd.
Phone: +358 40 749 2986
E-Mail: timo.koponen@normet.com

This information was brought to you by Cision http://news.cision.com.

https://news.cision.com/normet/r/normet-group–record-high-quarterly-order-intake–profitability-weighed-down-by-lower-deliveries-and,c4217974


Executive Design Director of GAC Design Center Benoit Unlocks the Aesthetic Code of GAC’s Design

GAUNGZHOU, China, Aug. 14, 2025 /PRNewswire/ — Amid the wave of globalization reshaping the automotive industry, GAC is committed to achieving harmony between aesthetics, functionality, and user experience, fusing world-class engineering expertise with the speed of Chinese innovation to deliver world-class design and technology. Benoit, Executive Design Director of GAC Design Center, emphasises that automotive design is a complete story -one that flows seamlessly from overarching concepts to the finest details. By weaving together natural inspiration and technological power, GAC creates a unified rhythm between interior and exterior, ensuring every detail echoes the overall vision.


Natural Philosophy & Global Vision: GAC Chief Designer Benoit Forges a New Design Paradigm

From the EARTH Concept Car’s organic and mineral-inspired forms, to the seamless integration of CMF, UI, and geometric design, every element serves the whole. Whether it’s the creativity of AION, the refined luxury of HYPTEC, or the balanced diversity of GAC’s portfolio, the brand’s design philosophy spans the full spectrum.

Looking ahead, GAC aims to showcase the power of merging natural inspiration with advanced technology, creating emotional resonance and setting a new benchmark for the brand’s global journey.


As Agentic AI Gains Traction, 86% of Enterprises Anticipate Heightened Risks, Yet Only 2% of Companies Meet Responsible AI Gold Standards

With 95% of enterprises facing incidents, Infosys research reveals wide gap between AI adoption and responsible AI readiness, exposing most enterprises to reputational risks and financial loss

BENGALURU, India, Aug. 14, 2025 /PRNewswire/ — Infosys Knowledge Institute (IKI), the research arm of Infosys (NSE: INFY), (BSE: INFY), (NYSE: INFY), a global leader in next-generation digital services and consulting, today unveiled critical insights into the state of responsible AI (RAI) implementation across enterprises, particularly with the advent of agentic AI. The report, Responsible Enterprise AI in the Agentic Era, surveyed over 1,500 business executives and interviewed 40 senior decision-makers across Australia, France, Germany, UK, US, and New Zealand. The findings show that while 78% of companies see RAI as a business growth driver, only 2% have adequate RAI controls in place to safeguard against reputational risk and financial loss.

Responsible Enterprise AI in the Agentic Era Radar

The report analyzed the effects of risks from poorly implemented AI, such as privacy violations, ethical violations, bias or discrimination, regulatory non-compliance, inaccurate or harmful predictions, among others. It found that 77% of organizations reported financial loss, and 53% of organizations have suffered reputational impact from such AI-related incidents.

Key findings include:

AI risks are widespread and can be severe

  • 95% of C-suite and director-level executives report AI-related incidents in the past two years.
  • 39% characterize the damage experienced from such AI issues as “severe” or “extremely severe.”
  • 86% of executives aware of agentic AI believe it will introduce new risks and compliance issues.

Responsible AI (RAI) capability is patchy and inefficient for most enterprises

  • Only 2% of companies (termed “RAI leaders”) met the full standards set in the Infosys RAI capability benchmark — termed “RAISE BAR” with 15% (RAI followers) meeting three-quarters of the standards.
  • The “RAI leader” cohort experienced 39% lower financial losses and 18% lower severity from AI incidents.
  • Leaders do several things better to achieve these results, including developing improved AI explainability, proactively evaluating and mitigating against bias, rigorously testing and validating AI initiatives and having a clear incident response plan.

Executives view RAI as a growth driver

  • 78% of senior leaders see RAI as aiding their revenue growth and 83% say that future AI regulations would boost, rather than inhibit, the number of future AI initiatives.
  • However, on average, companies believe they are underinvesting in RAI by 30%.

With the scale of enterprise AI adoption far outpacing readiness, companies must urgently shift from treating RAI as a reactive compliance obligation to embracing it proactively as a strategic advantage. To help organizations build scalable, trusted AI systems that fuel growth while mitigating risk, Infosys recommends the following actions:

  • Learn from the leaders: Study the practices of high-maturity RAI organizations who have already faced diverse incident types and developed robust governance.
  • Blend product agility with platform governance: Combine decentralized product innovation with centralized RAI guardrails and oversight.
  • Embed RAI guardrails into secure AI platforms: Use platform-based environments that enable AI agents to operate within preapproved data and systems.
  • Establish a proactive RAI office: Create a centralized function to monitor risk, set policy, and scale governance with tools like Infosys’ AI3S (Scan, Shield, Steer).

Balakrishna D.R., EVP – Global Services Head, AI and Industry Verticals, Infosys, said, “Drawing from our extensive experience working with clients on their AI journeys, we have seen firsthand how delivering more value from enterprise AI use cases, would require enterprises to first establish a responsible foundation built on trust, risk mitigation, data governance, and sustainability. This also means emphasizing ethical, unbiased, safe, and transparent model development. To realize the promise of this technology in the agentic AI future, leaders should strategically focus on platform and product-centric enablement, and proactive vigilance of their data estate. Companies should not discount the important role a centralized RAI office plays as enterprise AI scales, and new regulations come into force.”

Jeff Kavanaugh, Head of Infosys Knowledge Institute, Infosys, said, “Today, enterprises are navigating a complex landscape where AI’s promise of growth is accompanied by significant operational and ethical risks. Our research clearly shows that while many are recognizing the importance of Responsible AI, there’s a substantial gap in practical implementation. Companies that prioritize robust, embedded RAI safeguards will not only mitigate risks and potentially reduce financial losses but also unlock new revenue streams and thrive as we transition into the transformative agentic AI era.”

To read the full report, please visit here.

Methodology

Infosys used an anonymous format to conduct an online survey of 1,502 business executives across industries across Australia, New Zealand, France, Germany, the United Kingdom, and the United States Australia, France, Germany, UK, US, and New Zealand, as well as qualitative interviews with 40 senior executives.

About Infosys

Infosys is a global leader in next-generation digital services and consulting. Over 320,000 of our people work to amplify human potential and create the next opportunity for people, businesses, and communities. We enable clients in 59 countries to navigate their digital transformation. With over four decades of experience in managing the systems and workings of global enterprises, we expertly steer clients, as they navigate their digital transformation powered by cloud and AI. We enable them with an AI-first core, empower the business with agile digital at scale and drive continuous improvement with always-on learning through the transfer of digital skills, expertise, and ideas from our innovation ecosystem. We are deeply committed to being a well-governed, environmentally sustainable organization where diverse talent thrives in an inclusive workplace.

Visit www.infosys.com to see how Infosys (NSE, BSE, NYSE: INFY) can help your enterprise navigate your next.

Safe Harbor

Certain statements in this release concerning our future growth prospects, or our future financial or operating performance, are forward-looking statements intended to qualify for the ‘safe harbor’ under the Private Securities Litigation Reform Act of 1995, which involve a number of risks and uncertainties that could cause actual results or outcomes to differ materially from those in such forward-looking statements. The risks and uncertainties relating to these statements include, but are not limited to, risks and uncertainties regarding the execution of our business strategy, increased competition for talent, our ability to attract and retain personnel, increase in wages, investments to reskill our employees, our ability to effectively implement a hybrid work model, economic uncertainties and geo-political situations, technological disruptions and innovations such as artificial intelligence (“AI”), generative AI, the complex and evolving regulatory landscape including immigration regulation changes, our ESG vision, our capital allocation policy and expectations concerning our market position, future operations, margins, profitability, liquidity, capital resources, our corporate actions including acquisitions, and cybersecurity matters. Important factors that may cause actual results or outcomes to differ from those implied by the forward-looking statements are discussed in more detail in our US Securities and Exchange Commission filings including our Annual Report on Form 20-F for the fiscal year ended March 31, 2025. These filings are available at www.sec.gov. Infosys may, from time to time, make additional written and oral forward-looking statements, including statements contained in the Company’s filings with the Securities and Exchange Commission and our reports to shareholders. The Company does not undertake to update any forward-looking statements that may be made from time to time by or on behalf of the Company unless it is required by law.