

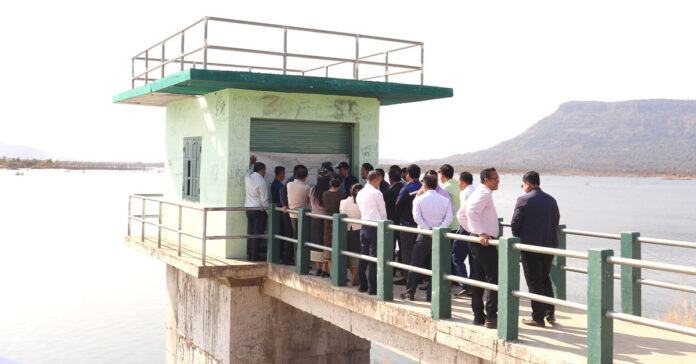
The newly constructed Huay Vang Hay irrigation reservoir in Phonthong village, Champasack, is set to significantly impact local agriculture, benefiting approximately 1,760 families.
Irrigation Water Reservoir Set to Benefit 1,760 Families in Champasack
TCL CSOT Showcases Advanced Commercial Display Solutions at ISE 2025
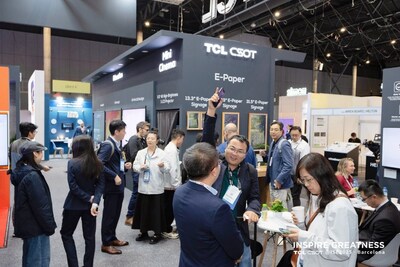
BARCELONA, Spain, Feb. 6, 2025 /PRNewswire/ — TCL CSOT, a leading innovator in display technology, is set to present its comprehensive commercial display portfolio at Integrated Systems Europe (ISE) 2025, taking place from February 4-7 in Barcelona. The lineup demonstrates TCL CSOT’s technological expertise in meeting the diverse needs of commercial applications through continuous innovation.
Leading the professional display lineup is TCL CSOT’s outdoor high-brightness series, featuring displays engineered for exceptional outdoor visibility. The 55″ FHD Outdoor High-Brightness Display delivers an impressive 4000 nit brightness, while the 65″ UHD Outdoor High-Brightness Display and 75″ UHD Outdoor High-Brightness Display offer 2500 nit brightness, making them ideal for outdoor digital signage applications. All models feature advanced DLED backlight technology and support 24/7 operation, with high refresh rates of 120Hz for smooth content display.
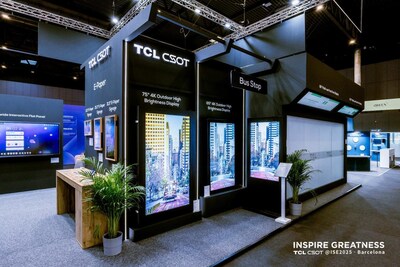
The company’s flagship Unlimited Seamless MLCD technology is showcased in the groundbreaking 150-inch display, the world’s first ultra-large LCD and LED hybrid stitching solution. This innovative display offers 6K4K resolution (6560×3840) with 100% sRGB color gamut and a 130° viewing angle, making it ideal for conference rooms and corporate environments requiring large-scale, high-quality display solutions. The system features multi-touch capabilities for enhanced interactivity and supports 1*N unlimited splicing for flexible installation options.

For more advanced applications, the 92″ 5K Digital Signage showcases TCL CSOT’s mastery of large-format display technology. With a 21:9 ultra-wide aspect ratio and 5120×2160 resolution, this premium display delivers exceptional visual performance with features including low blue light eye protection, high color gamut (NTSC≥72%), and an impressive 5000:1 contrast ratio.

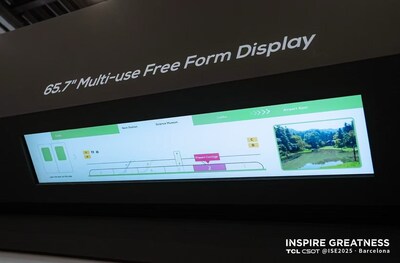
In the ultra-wide display category, TCL CSOT introduces its Multi-use Free Form Display series, available in 86-inch and 65.7-inch variants. These displays feature a striking 58:9 aspect ratio with 3840×600 resolution, making them perfect for transportation hubs, retail environments, and corporate installations. The series boasts high contrast ratios of up to 6000:1 and NTSC 72% color gamut, ensuring vivid and impactful content delivery in both landscape and portrait orientations.
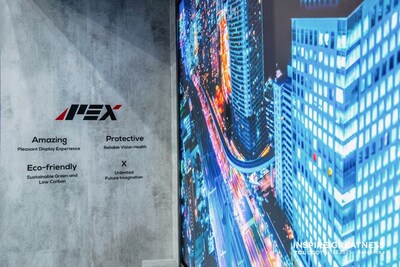
TCL CSOT’s APEX display technology brand continues to push boundaries in visual experience. APEX is built on the brand core of ” PACE TO APEX”. It is set to deliver pleasant display experience, reliable vision health, sustainable green and low carbon, and unlimited future imagination for users worldwide. TCL CSOT’s commercial display solutions incorporate APEX including professional-grade panel technology for enhanced durability, flexible installation options, comprehensive connectivity options, energy-efficient designs, and advanced surface treatments for optimal visibility in various lighting conditions.
TCL CSOT’s presence at ISE 2025 underscores its dedication to pushing the boundaries of commercial display technology. By combining cutting-edge innovation with practical applications, the company continues to develop solutions that not only meet current market demands but also anticipate future needs across various commercial scenarios.
Visit TCL CSOT’s YouTube for more information: https://www.youtube.com/@TCLCSOT
About TCL CSOT
TCL CSOT (TCL China Star Optoelectronics Technology Co., Ltd.), established in 2009, is committed to developing innovative technologies in the display industry. With a “3+2+N” – “3” representing TV commercial display, IT, and MC; “2” representing automotive and professional displays; and “N” signifying the exploration of more application scenarios – TCL CSOT continuously empowers customers’ needs with full-scenario product services. With manufacturing and R&D bases in Shenzhen, Wuhan, Huizhou, Suzhou, Guangzhou, and India, TCL CSOT has established 11 production lines. TCL CSOT’s business encompasses producing display panels from 1 to 115 inches. From LCD to OLED to MLED, TCL CSOT offers solutions across a wide array of applications, including TVs, mobile phones, tablets, laptops, monitors, automotive displays, XR (Extended Reality) devices, wearables, commercial displays, and other fields. The company leads the market in several of these areas and is dedicated to ongoing technological innovation, providing advanced products for customers and building a vibrant display industry ecosystem.
Yum China Reports Fourth Quarter Results and Increases Dividend by 50%

Fourth Quarter Operating Profit Grew 36% and OP Margin1 Expanded 140 Basis Points
Sequential Improvement in Same-Store Sales Index and Eighth Consecutive Quarter of Same-Store Transaction Growth
Full Year Operating Profit Rose 5% to $1.2 Billion, Core Operating Profit2 Up 12% and Diluted EPS Up 18%
Record 2024 Results: Total Revenues of $11 Billion, 1,751 Net New Stores and $1.5 Billion Capital Returned to Shareholders
SHANGHAI, Feb. 6, 2025 /PRNewswire/ — Yum China Holdings, Inc. (the “Company” or “Yum China“) (NYSE: YUMC and HKEX: 9987) today reported unaudited results for the fourth quarter and year ended December 31, 2024.
Fourth Quarter Highlights
- Total system sales grew 4% year over year (“YoY”), excluding foreign currency translation (“F/X”). The growth was primarily attributable to 5% of net new unit contribution.3
- Same-store sales reached 99% of the prior year’s level and improved sequentially from 97% in the third quarter. Same-store transactions grew 4% YoY, the eighth consecutive quarter of growth.
- Total revenues increased 4% YoY to $2.6 billion, a record-high for the fourth quarter (a 4% increase excluding F/X).
- The Company opened 534 net new stores and reached 16,395 stores as of December 31, 2024.
- Operating profit grew 36% YoY to $151 million. Core operating profit grew 35% YoY.
- OP margin was 5.8%, an increase of 140 basis points YoY, supported by restaurant margin expansion.
- Restaurant margin was 12.3%, an increase of 160 basis points YoY. Excluding $6 million in items affecting comparability, restaurant margin increased 180 basis points YoY, driven primarily by improved operational efficiencies.
- Diluted EPS increased 30% YoY to $0.30, or up 27% YoY excluding F/X. Excluding the impact of $0.01 from F/X and the mark-to-market equity investments in the fourth quarters of 2024 and 2023, Diluted EPS increased 20% YoY.
Full Year Highlights
- Total system sales grew 5% year over year, excluding F/X. The growth was primarily attributable to 7% of net new unit contribution. Same-store sales reached 97% of the prior year’s level for the year.
- Total revenues increased 3% YoY to $11.3 billion, a record level since the spin-off. Excluding F/X, total revenues would have been $200 million higher, or a 5% increase YoY.
- Store count increased 12%, or 1,751 net new stores, with 512 net new stores, or 29% opened by franchisees.
- Delivery sales grew 14% YoY, maintaining the double-digit annual growth Yum China has sustained over the past decade. Delivery contributed approximately 39% of KFC and Pizza Hut’s Company sales.
- Operating profit grew 5% YoY to $1.2 billion. Core operating profit grew 12% YoY.
- OP margin was 10.3%, up 20 basis points YoY, supported by resilient restaurant margins and savings in G&A expenses.
- Restaurant margin was 15.7%. Excluding $60 million in items affecting comparability, restaurant margin was flat YoY.
- Diluted EPS increased 18% YoY to $2.33, a record-high for the year, or up 22% YoY excluding F/X. Excluding the impact of $0.11 from F/X and the mark-to-market equity investments, Diluted EPS increased 12% YoY.
- Returned $1.5 billion to shareholders in 2024 through $248 million in cash dividends and $1.24 billion in share repurchases, representing approximately 8% of outstanding shares as of December 31, 2023.
- Digital sales4 reached $9.6 billion, with digital ordering accounting for approximately 90% of total Company sales.
- Total membership of KFC and Pizza Hut exceeded 525 million, up 11% versus the prior year. Member sales accounted for approximately 65% of KFC and Pizza Hut’s system sales in aggregate.
|
1 OP margin refers to operating profit as a percentage of total revenues. |
|
2 Core operating profit is defined as operating profit adjusted for special items, further excluding items affecting comparability and the impact of F/X. The Company uses core operating profit for the purposes of evaluating the performance of its core operations. Please refer to “Reconciliation of Reported GAAP Results to Non-GAAP Measures” included in the accompanying tables of this release for further details. |
|
3 Net new unit contribution refers to sales contribution from net new stores. |
|
4 Digital sales refer to sales at Company-owned stores where orders were placed digitally. |
Joey Wat, CEO of Yum China, commented, “We closed the year with a strong fourth quarter, propelling us to a number of record highs in 2024. In the fourth quarter, our system sales growth surpassed the restaurant industry’s growth rate. Our same-store sales index improved sequentially to 99% of prior year levels, driven by the eighth consecutive quarter of same-store transaction growth. OP margin expanded by 140 basis points, and restaurant margin increased by 160 basis points, both on a year-over-year basis. We have steadily improved our metrics since the second quarter, with improvement in same-store sales index, margins, and operating profit growth each quarter. These results demonstrate the resilience of our business and the effectiveness of our strategy in improving sales and profitability amid challenging market conditions.”
Wat continued, “Our dual focus on operational efficiency and innovation yielded excellent results, laying a solid foundation for future growth. Our Project Fresh Eye and Project Red Eye initiatives have given us new perspectives on our operations and transformed our organization. They have made us more efficient, agile and competitive across our restaurants, shared service centers and supply chains. Our innovative measures—from menu evolution to the introduction of breakthrough business models like KCOFFEE Cafes and Pizza Hut WOW—have expanded our addressable market and increased our market share. KFC has demonstrated considerable resilience and growth momentum. Pizza Hut has made significant progress in transforming itself to become more affordable for customers and more profitable for the Company.”
Wat concluded, “Looking ahead, we remain excited about the significant growth opportunities in China. With tailored store models, we are expanding through both Company-owned stores and franchise stores and are on track to achieve our goal of 20,000 stores by 2026. Franchisees enable us to expand into remote areas, lower-tier cities and strategic locations previously beyond our reach. We are also increasing our cash dividend by a considerable 50% and continuing our share repurchases, positioning us to return a total of $4.5 billion to shareholders between 2024 and 2026. The average annual amount is equivalent to 9% of our current market capitalization. Leveraging our unique strengths, we are confident the steps we are taking will help create sustainable long-term value for our shareholders.”
|
Key Financial Results |
||||||||||||||||
|
Fourth Quarter |
Full Year |
|||||||||||||||
|
%/ppts Change |
%/ppts Change |
|||||||||||||||
|
2024 |
2023 |
Reported |
Ex F/X |
2024 |
2023 |
Reported |
Ex F/X |
|||||||||
|
System Sales Growth (5) (%) |
4 |
21 |
NM |
NM |
5 |
21 |
NM |
NM |
||||||||
|
Same-Store Sales Growth (5) (%) |
(1) |
4 |
NM |
NM |
(3) |
7 |
NM |
NM |
||||||||
|
Operating Profit ($mn) |
151 |
110 |
+36 |
+35 |
1,162 |
1,106 |
+5 |
+8 |
||||||||
|
Adjusted Operating Profit (6) ($mn) |
151 |
116 |
+29 |
+28 |
1,162 |
1,121 |
+4 |
+6 |
||||||||
|
Core Operating Profit (6) (7) ($mn) |
150 |
110 |
NM |
+35 |
1,190 |
1,061 |
NM |
+12 |
||||||||
|
OP Margin (%) |
5.8 |
4.4 |
+1.4 |
+1.4 |
10.3 |
10.1 |
+0.2 |
+0.3 |
||||||||
|
Core OP Margin (6) (8) (%) |
5.8 |
4.4 |
NM |
+1.4 |
10.4 |
9.7 |
NM |
+0.7 |
||||||||
|
Net Income ($mn) |
115 |
97 |
+18 |
+17 |
911 |
827 |
+10 |
+13 |
||||||||
|
Adjusted Net Income (6) ($mn) |
115 |
103 |
+11 |
+10 |
911 |
842 |
+8 |
+11 |
||||||||
|
Diluted Earnings |
0.30 |
0.23 |
+30 |
+27 |
2.33 |
1.97 |
+18 |
+22 |
||||||||
|
Adjusted Diluted Earnings |
0.30 |
0.25 |
+20 |
+20 |
2.33 |
2.00 |
+17 |
+19 |
||||||||
|
5 System sales and same-store sales percentages exclude the impact of F/X. Effective January 1, 2018, temporary store closures are normalized in the same-store sales calculation by excluding |
|
6 See “Reconciliation of Reported GAAP Results to non-GAAP Measures” included in the accompanying tables of this release for further details. |
|
7 Current period amounts are derived by translating results at average exchange rates of the prior year period. |
|
8 Core OP margin refers to core operating profit as a percentage of total revenues excluding F/X. |
|
Note: All comparisons are versus the same period a year ago. |
|
Percentages may not recompute due to rounding. |
|
NM refers to not meaningful. |
Capital Returns to Shareholders
- The Company is on track to return a total of $4.5 billion to shareholders between 2024 and 2026.
o The Company returned $1.5 billion in capital to shareholders for the full year and $248 million in the fourth quarter.
o For the full year, Yum China repurchased 31.3 million shares of common stock, which is equivalent to approximately 8% of its outstanding shares as of December 31, 2023.
o As of December 31, 2024, approximately $1.3 billion remained available for future share repurchases under the current authorization program.
- The Company plans to return a total of $3 billion to shareholders from the beginning of 2025 through the end of 2026.
o The Board declared a 50% increase in the cash dividend, raising it to $0.24 per share on Yum China’s common stock, payable on March 27, 2025, to shareholders of record as of the close of business on March 6, 2025.
o The Company has entered into share repurchase agreements in the U.S. and Hong Kong for an aggregate repurchase amount of approximately US$360 million through open market transactions for the first half of 2025. The share repurchase agreements include approximately US$290 million under Rule 10b5-1 of the U.S. Securities Exchange Act of 1934 in the U.S. and approximately HK$550 million for a similar program in Hong Kong.
|
KFC |
||||||||||||||
|
Fourth Quarter |
Full Year |
|||||||||||||
|
%/ppts Change |
%/ppts Change |
|||||||||||||
|
2024 |
2023 |
Reported |
Ex F/X |
2024 |
2023 |
Reported |
Ex F/X |
|||||||
|
Restaurants |
11,648 |
10,296 |
+13 |
NM |
11,648 |
10,296 |
+13 |
NM |
||||||
|
System Sales Growth (%) |
5 |
20 |
NM |
NM |
6 |
20 |
NM |
NM |
||||||
|
Same-Store Sales Growth (%) |
(1) |
3 |
NM |
NM |
(2) |
7 |
NM |
NM |
||||||
|
Total Revenues ($mn) |
1,954 |
1,872 |
+4 |
+4 |
8,509 |
8,240 |
+3 |
+5 |
||||||
|
Operating Profit ($mn) |
192 |
167 |
+15 |
+15 |
1,192 |
1,202 |
(1) |
+2 |
||||||
|
Core Operating Profit ($mn) |
191 |
162 |
NM |
+18 |
1,218 |
1,154 |
NM |
+6 |
||||||
|
OP Margin (%) |
9.9 |
8.9 |
+1.0 |
+1.0 |
14.0 |
14.6 |
(0.6) |
(0.5) |
||||||
|
Restaurant Margin (%) |
13.3 |
12.0 |
+1.3 |
+1.3 |
16.9 |
17.7 |
(0.8) |
(0.8) |
||||||
Fourth Quarter:
- System sales for KFC grew 5% YoY. Same-store sales reached 99% of the prior year’s level, improved from 98% in the third quarter. Same-store transactions grew 3% YoY, the eighth consecutive quarter of growth.
- Delivery sales grew 16% YoY, contributing approximately 42% of KFC’s Company sales.
- Operating profit increased 15% and Core operating profit increased 18% YoY.
- OP margin was 9.9%, an increase of 100 basis points YoY.
- Restaurant margin was 13.3%. Excluding items affecting comparability at the restaurant level, restaurant margin expanded 160 basis points YoY, primarily due to favorable commodity prices and higher operational efficiency, partially offset by the impact of increased value-for-money offerings and wage inflation.
Full Year:
- System sales for KFC grew 6% YoY. Same-store sales reached 98% of the prior year’s level.
- Delivery sales grew 16%, contributing approximately 40% of KFC’s Company sales.
- KFC opened a record 1,352 net new stores in 2024, with 402 net new stores opened by franchisees, accounting for 30%. Total store count reached 11,648 stores at year-end 2024, of which 13% are operated by franchisees.
- Operating profit was $1.2 billion, a 1% decrease YoY. Core operating profit increased 6%.
- OP margin was 14.0%.
- Restaurant margin was 16.9%. Excluding items affecting comparability at the restaurant level, restaurant margin decreased by 20 basis points, primarily due to increased value-for-money offerings to drive traffic and wage inflation, partially offset by favorable commodity prices and improved operational efficiency.
|
Pizza Hut |
||||||||||||||
|
Fourth Quarter |
Full Year |
|||||||||||||
|
%/ppts Change |
%/ppts Change |
|||||||||||||
|
2024 |
2023 |
Reported |
Ex F/X |
2024 |
2023 |
Reported |
Ex F/X |
|||||||
|
Restaurants |
3,724 |
3,312 |
+12 |
NM |
3,724 |
3,312 |
+12 |
NM |
||||||
|
System Sales Growth (%) |
3 |
24 |
NM |
NM |
2 |
20 |
NM |
NM |
||||||
|
Same-Store Sales Growth (%) |
(2) |
6 |
NM |
NM |
(5) |
6 |
NM |
NM |
||||||
|
Total Revenues ($mn) |
510 |
496 |
+3 |
+2 |
2,260 |
2,246 |
+1 |
+2 |
||||||
|
Operating Profit ($mn) |
14 |
5 |
+156 |
+153 |
153 |
142 |
+7 |
+11 |
||||||
|
Core Operating Profit ($mn) |
14 |
4 |
NM |
+226 |
157 |
132 |
NM |
+19 |
||||||
|
OP Margin (%) |
2.6 |
1.0 |
+1.6 |
+1.5 |
6.8 |
6.3 |
+0.5 |
+0.5 |
||||||
|
Restaurant Margin (%) |
9.3 |
7.3 |
+2.0 |
+2.0 |
12.0 |
11.8 |
+0.2 |
+0.2 |
||||||
Fourth Quarter:
- System sales for Pizza Hut grew 3% YoY. Same-store sales reached 98% of the prior year’s level, improved from 94% in the third quarter. Same-store transactions grew 9% YoY, the eighth consecutive quarter of growth and the highest quarter of growth in 2024.
- Delivery sales grew 6% YoY, contributing approximately 42% of Pizza Hut’s Company sales.
- Operating profit grew 156% and core operating profit increased 226% YoY.
- OP margin was 2.6%, an increase of 160 basis points YoY.
- Restaurant margin was 9.3%. Excluding items affecting comparability at the restaurant level, restaurant margin expanded 220 basis points YoY, primarily due to higher operational efficiency and favorable commodity prices, partially offset by the impact of increased value-for-money offerings to drive traffic and wage inflation.
Full Year:
- System sales for Pizza Hut grew 2% YoY. Same-store sales finished at 95% of the prior year’s level.
- Delivery sales grew 7% YoY, contributing approximately 39% of Pizza Hut’s Company sales.
- Pizza Hut opened a record 412 net new stores in 2024, with 42 net new stores opened by franchisees, accounting for 10%. Total store count reached 3,724 stores at year-end 2024, of which 5% are operated by franchisees.
- Operating profit was $153 million, representing 7% growth. Core operating profit increased 19% YoY.
- OP margin was 6.8%, an increase of 50 basis points YoY.
- Restaurant margin was 12.0%. Excluding items affecting comparability at the restaurant level, restaurant margin expanded 60 basis points, primarily due to higher operational efficiency and favorable commodity prices, partially offset by the impact of increased value-for-money offerings to drive traffic and wage inflation.
Outlook
- The Company targets approximately 1,600 to 1,800 net new stores and capital expenditures in the range of approximately $700 million to $800 million for the 2025 fiscal year.
- The Company plans to return $3 billion to shareholders in 2025 through 2026, adding to the $1.5 billion it delivered to shareholders in 2024.
- The Company anticipates the franchise mix of net new stores will gradually increase to 40-50% for KFC and 20-30% for Pizza Hut over the next few years.
Other Updates
- Yum China was ranked No. 1 globally for the Restaurant & Leisure Facilities Industry in the S&P Global 2024 Corporate Sustainability Assessment. Yum China was included in both the Dow Jones Sustainability Indices: World Index and Emerging Market Index for the fifth consecutive year.
- Yum China was once again named by Top Employers Institute as a Top Employer in China for the seventh consecutive year. The Company ranked second nationwide for the first time and retained its position as the top-ranked employer in the restaurant industry for the fourth consecutive year. These achievements highlight Yum China’s unwavering commitment to fostering an outstanding workplace and employee experience.
Note on Non-GAAP Measures
Reported GAAP results include items that are excluded from non-GAAP measures. See “Reconciliation of Reported GAAP Results to Non-GAAP Measures” and “Segment Results” within this release for non-GAAP reconciliation details.
Conference Call
Yum China’s management will hold an earnings conference call at 7:00 a.m. U.S. Eastern Time on Thursday, February 6, 2025 (8:00 p.m. Beijing/Hong Kong Time on Thursday, February 6, 2025).
A live webcast of the call may be accessed at https://edge.media-server.com/mmc/p/v2wgc5an.
To join by phone, please register in advance of the conference through the link provided below. Upon registering, you will be provided with participant dial-in numbers and a unique access PIN.
Pre-registration Link: https://register.vevent.com/register/BI475e24b0874041078f0918c1c1fc901a
A replay of the webcast will be available two hours after the event and will remain accessible until February 5, 2026. Additionally, earnings release accompanying slides will be available at the Company’s Investor Relations website http://ir.yumchina.com.
For important news and information regarding Yum China, including our filings with the U.S. Securities and Exchange Commission and the Hong Kong Stock Exchange, visit Yum China’s Investor Relations website at http://ir.yumchina.com. Yum China uses this website as a primary channel for disclosing key information to its investors, some of which may contain material and previously non-public information.
Forward-Looking Statements
This press release contains “forward-looking statements” within the meaning of Section 27A of the Securities Act of 1933 and Section 21E of the Securities Exchange Act of 1934, including under “2024 Outlook.” We intend all forward-looking statements to be covered by the safe harbor provisions of the Private Securities Litigation Reform Act of 1995. Forward-looking statements generally can be identified by the fact that they do not relate strictly to historical or current facts and by the use of forward-looking words such as “expect,” “expectation,” “believe,” “anticipate,” “may,” “could,” “intend,” “belief,” “plan,” “estimate,” “target,” “predict,” “project,” “likely,” “will,” “continue,” “should,” “forecast,” “outlook,” “commit” or similar terminology. These statements are based on current estimates and assumptions made by us in light of our experience and perception of historical trends, current conditions and expected future developments, as well as other factors that we believe are appropriate and reasonable under the circumstances, but there can be no assurance that such estimates and assumptions will prove to be correct. Forward-looking statements include, without limitation, statements regarding the future strategies, growth, business plans, investments, store openings, franchise mix of net new stores, capital expenditures, dividend and share repurchase plans, CAGR for system sales, operating profit and EPS, earnings, performance and returns of Yum China, anticipated effects of population and macroeconomic trends, pace of recovery of Yum China’s business, the anticipated effects of our innovation, digital and delivery capabilities and investments on growth and beliefs regarding the long-term drivers of Yum China’s business. Forward-looking statements are not guarantees of performance and are inherently subject to known and unknown risks and uncertainties that are difficult to predict and could cause our actual results or events to differ materially from those indicated by those statements. We cannot assure you that any of our expectations, estimates or assumptions will be achieved. The forward-looking statements included in this press release are only made as of the date of this press release, and we disclaim any obligation to publicly update any forward-looking statement to reflect subsequent events or circumstances, except as required by law. Numerous factors could cause our actual results or events to differ materially from those expressed or implied by forward-looking statements, including, without limitation: whether we are able to achieve development goals at the times and in the amounts currently anticipated, if at all, the success of our marketing campaigns and product innovation, our ability to maintain food safety and quality control systems, changes in public health conditions, our ability to control costs and expenses, including tax costs, as well as changes in political, economic and regulatory conditions in China, and those set forth under the caption “Risk Factors” in our Annual Report on Form 10-K and subsequent Quarterly Reports on Form 10-Q. Our plan of capital returns to shareholders is based on current expectations, which may change based on market conditions, capital needs or otherwise. In addition, other risks and uncertainties not presently known to us or that we currently believe to be immaterial could affect the accuracy of any such forward-looking statements. All forward-looking statements should be evaluated with the understanding of their inherent uncertainty. You should consult our filings with the Securities and Exchange Commission (including the information set forth under the caption “Management’s Discussion and Analysis of Financial Condition and Results of Operations” in our Annual Report on Form 10-K and subsequent Quarterly Reports on Form 10-Q) for additional detail about factors that could affect our financial and other results.
About Yum China Holdings, Inc.
Yum China is the largest restaurant company in China with a mission to make every life taste beautiful. The Company operates over 16,000 restaurants under six brands across over 2,200 cities in China. KFC and Pizza Hut are the leading brands in the quick-service and casual dining restaurant spaces in China, respectively. In addition, Yum China has partnered with Lavazza to develop the Lavazza coffee concept in China. Little Sheep and Huang Ji Huang specialize in Chinese cuisine. Taco Bell offers innovative Mexican-inspired food. Yum China has a world-class, digitalized supply chain, which includes an extensive network of logistics centers nationwide and an in-house supply chain management system. Its strong digital capabilities and loyalty program enable the Company to reach customers faster and serve them better. Yum China is a Fortune 500 company with the vision to be the world’s most innovative pioneer in the restaurant industry. For more information, please visit http://ir.yumchina.com.
Contacts
|
Investor Relations Contact: |
||
|
Tel: +86 21 2407 7556
|
||
|
Media Contact: |
||
|
Tel: +86 21 2407 8288 / +852 2267 5807 |
||
|
Yum China Holdings, Inc. |
||||||||||||||
|
Condensed Consolidated Statements of Income |
||||||||||||||
|
(in US$ million, except per share data) |
||||||||||||||
|
(unaudited) |
||||||||||||||
|
Quarter Ended |
% Change |
Year Ended |
% Change |
|||||||||||
|
12/31/2024 |
12/31/2023 |
B/(W) |
12/31/2024 |
12/31/2023 |
B/(W) |
|||||||||
|
Revenues |
||||||||||||||
|
Company sales |
$ 2,434 |
$ 2,343 |
4 |
$ 10,651 |
$ 10,391 |
2 |
||||||||
|
Franchise fees and income |
22 |
20 |
8 |
94 |
89 |
5 |
||||||||
|
Revenues from transactions with franchisees |
101 |
90 |
14 |
420 |
372 |
13 |
||||||||
|
Other revenues |
38 |
40 |
(5) |
138 |
126 |
10 |
||||||||
|
Total revenues |
2,595 |
2,493 |
4 |
11,303 |
10,978 |
3 |
||||||||
|
Costs and Expenses, Net |
||||||||||||||
|
Company restaurants |
||||||||||||||
|
Food and paper |
776 |
758 |
(2) |
3,387 |
3,224 |
(5) |
||||||||
|
Payroll and employee benefits |
685 |
678 |
(1) |
2,787 |
2,725 |
(2) |
||||||||
|
Occupancy and other operating expenses |
672 |
654 |
(3) |
2,798 |
2,752 |
(2) |
||||||||
|
Company restaurant expenses |
2,133 |
2,090 |
(2) |
8,972 |
8,701 |
(3) |
||||||||
|
General and administrative expenses |
156 |
153 |
(3) |
568 |
638 |
11 |
||||||||
|
Franchise expenses |
8 |
8 |
(11) |
37 |
36 |
(7) |
||||||||
|
Expenses for transactions with franchisees |
98 |
86 |
(14) |
404 |
356 |
(13) |
||||||||
|
Other operating costs and expenses |
32 |
35 |
9 |
122 |
112 |
(9) |
||||||||
|
Closures and impairment expenses, net |
17 |
12 |
(47) |
39 |
29 |
(38) |
||||||||
|
Other income, net |
— |
(1) |
NM |
(1) |
— |
NM |
||||||||
|
Total costs and expenses, net |
2,444 |
2,383 |
(3) |
10,141 |
9,872 |
(3) |
||||||||
|
Operating Profit |
151 |
110 |
36 |
1,162 |
1,106 |
5 |
||||||||
|
Interest income, net |
29 |
45 |
(34) |
129 |
169 |
(23) |
||||||||
|
Investment (loss) gain |
(10) |
(17) |
40 |
40 |
(49) |
NM |
||||||||
|
Income Before Income Taxes and |
170 |
138 |
23 |
1,331 |
1,226 |
9 |
||||||||
|
Income tax provision |
(47) |
(33) |
(40) |
(356) |
(329) |
(8) |
||||||||
|
Equity in net earnings (losses) from |
3 |
2 |
43 |
5 |
4 |
18 |
||||||||
|
Net income – including noncontrolling interests |
126 |
107 |
18 |
980 |
901 |
9 |
||||||||
|
Net income – noncontrolling interests |
11 |
10 |
(16) |
69 |
74 |
6 |
||||||||
|
Net Income – Yum China Holdings, Inc. |
$ 115 |
$ 97 |
18 |
$ 911 |
$ 827 |
10 |
||||||||
|
Effective tax rate |
27.6 % |
24.2 % |
(3.4) |
ppts. |
26.7 % |
26.9 % |
0.2 |
ppts. |
||||||
|
Basic Earnings Per Common Share |
$ 0.30 |
$ 0.23 |
$ 2.34 |
$ 1.99 |
||||||||||
|
Weighted-average shares outstanding |
379 |
411 |
388 |
416 |
||||||||||
|
Diluted Earnings Per Common Share |
$ 0.30 |
$ 0.23 |
$ 2.33 |
$ 1.97 |
||||||||||
|
Weighted-average shares outstanding |
382 |
415 |
390 |
420 |
||||||||||
|
OP margin |
5.8 % |
4.4 % |
1.4 |
ppts. |
10.3 % |
10.1 % |
0.2 |
ppts. |
||||||
|
Company sales |
100.0 % |
100.0 % |
100.0 % |
100.0 % |
||||||||||
|
Food and paper |
31.9 |
32.4 |
0.5 |
ppts. |
31.8 |
31.0 |
(0.8) |
ppts. |
||||||
|
Payroll and employee benefits |
28.2 |
29.0 |
0.8 |
ppts. |
26.2 |
26.2 |
— |
ppts. |
||||||
|
Occupancy and other operating expenses |
27.6 |
27.9 |
0.3 |
ppts. |
26.3 |
26.5 |
0.2 |
ppts. |
||||||
|
Restaurant margin |
12.3 % |
10.7 % |
1.6 |
ppts. |
15.7 % |
16.3 % |
(0.6) |
ppts. |
||||||
|
Percentages may not recompute due to rounding. NM refers to not meaningful. |
||||||||||||||
|
Yum China Holdings, Inc. |
||||||||||||||
|
KFC Operating Results |
||||||||||||||
|
(in US$ million) |
||||||||||||||
|
(unaudited) |
||||||||||||||
|
Quarter Ended |
% Change |
Year Ended |
% Change |
|||||||||||
|
12/31/2024 |
12/31/2023 |
B/(W) |
12/31/2024 |
12/31/2023 |
B/(W) |
|||||||||
|
Revenues |
||||||||||||||
|
Company sales |
$ 1,923 |
$ 1,842 |
4 |
$ 8,375 |
$ 8,116 |
3 |
||||||||
|
Franchise fees and income |
16 |
14 |
16 |
69 |
62 |
11 |
||||||||
|
Revenues from transactions with franchisees |
14 |
12 |
24 |
55 |
45 |
25 |
||||||||
|
Other revenues |
1 |
4 |
(79) |
10 |
17 |
(40) |
||||||||
|
Total revenues |
1,954 |
1,872 |
4 |
8,509 |
8,240 |
3 |
||||||||
|
Costs and Expenses, Net |
||||||||||||||
|
Company restaurants |
||||||||||||||
|
Food and paper |
612 |
598 |
(2) |
2,645 |
2,512 |
(5) |
||||||||
|
Payroll and employee benefits |
533 |
519 |
(3) |
2,146 |
2,057 |
(4) |
||||||||
|
Occupancy and other operating expenses |
523 |
504 |
(4) |
2,170 |
2,107 |
(3) |
||||||||
|
Company restaurant expenses |
1,668 |
1,621 |
(3) |
6,961 |
6,676 |
(4) |
||||||||
|
General and administrative expenses |
65 |
60 |
(9) |
248 |
263 |
6 |
||||||||
|
Franchise expenses |
7 |
7 |
(12) |
32 |
31 |
(7) |
||||||||
|
Expenses for transactions with franchisees |
13 |
10 |
(24) |
49 |
39 |
(22) |
||||||||
|
Other operating costs and expenses |
1 |
4 |
88 |
8 |
15 |
48 |
||||||||
|
Closures and impairment expenses, net |
8 |
3 |
(170) |
19 |
12 |
(67) |
||||||||
|
Other expenses, net |
— |
— |
NM |
— |
2 |
84 |
||||||||
|
Total costs and expenses, net |
1,762 |
1,705 |
(3) |
7,317 |
7,038 |
(4) |
||||||||
|
Operating Profit |
$ 192 |
$ 167 |
15 |
$ 1,192 |
$ 1,202 |
(1) |
||||||||
|
OP margin |
9.9 % |
8.9 % |
1.0 |
ppts. |
14.0 % |
14.6 % |
(0.6) |
ppts. |
||||||
|
Company sales |
100.0 % |
100.0 % |
100.0 % |
100.0 % |
||||||||||
|
Food and paper |
31.8 |
32.5 |
0.7 |
ppts. |
31.6 |
31.0 |
(0.6) |
ppts. |
||||||
|
Payroll and employee benefits |
27.7 |
28.2 |
0.5 |
ppts. |
25.6 |
25.3 |
(0.3) |
ppts. |
||||||
|
Occupancy and other operating expenses |
27.2 |
27.3 |
0.1 |
ppts. |
25.9 |
26.0 |
0.1 |
ppts. |
||||||
|
Restaurant margin |
13.3 % |
12.0 % |
1.3 |
ppts. |
16.9 % |
17.7 % |
(0.8) |
ppts. |
||||||
|
Percentages may not recompute due to rounding. NM refers to not meaningful. |
||||||||||||||
|
Yum China Holdings, Inc. |
||||||||||||||
|
Pizza Hut Operating Results |
||||||||||||||
|
(in US$ million) |
||||||||||||||
|
(unaudited) |
||||||||||||||
|
Quarter Ended |
% Change |
Year Ended |
% Change |
|||||||||||
|
12/31/2024 |
12/31/2023 |
B/(W) |
12/31/2024 |
12/31/2023 |
B/(W) |
|||||||||
|
Revenues |
||||||||||||||
|
Company sales |
$ 500 |
$ 486 |
3 |
$ 2,223 |
$ 2,214 |
— |
||||||||
|
Franchise fees and income |
2 |
1 |
10 |
8 |
7 |
5 |
||||||||
|
Revenues from transactions with franchisees |
1 |
1 |
52 |
5 |
4 |
16 |
||||||||
|
Other revenues |
7 |
8 |
(12) |
24 |
21 |
14 |
||||||||
|
Total revenues |
510 |
496 |
3 |
2,260 |
2,246 |
1 |
||||||||
|
Costs and Expenses, Net |
||||||||||||||
|
Company restaurants |
||||||||||||||
|
Food and paper |
160 |
155 |
(4) |
727 |
692 |
(5) |
||||||||
|
Payroll and employee benefits |
149 |
153 |
3 |
628 |
649 |
3 |
||||||||
|
Occupancy and other operating expenses |
143 |
141 |
(2) |
600 |
610 |
2 |
||||||||
|
Company restaurant expenses |
452 |
449 |
(1) |
1,955 |
1,951 |
— |
||||||||
|
General and administrative expenses |
30 |
29 |
(2) |
110 |
118 |
7 |
||||||||
|
Franchise expenses |
1 |
1 |
(2) |
4 |
4 |
(2) |
||||||||
|
Expenses for transactions with franchisees |
1 |
1 |
(25) |
4 |
4 |
(3) |
||||||||
|
Other operating costs and expenses |
6 |
8 |
18 |
22 |
19 |
(19) |
||||||||
|
Closures and impairment expenses, net |
6 |
3 |
(125) |
12 |
8 |
(56) |
||||||||
|
Total costs and expenses, net |
496 |
491 |
(1) |
2,107 |
2,104 |
— |
||||||||
|
Operating Profit |
$ 14 |
$ 5 |
156 |
$ 153 |
$ 142 |
7 |
||||||||
|
OP margin |
2.6 % |
1.0 % |
1.6 |
ppts. |
6.8 % |
6.3 % |
0.5 |
ppts. |
||||||
|
Company sales |
100.0 % |
100.0 % |
100.0 % |
100.0 % |
||||||||||
|
Food and paper |
32.2 |
32.0 |
(0.2) |
ppts. |
32.7 |
31.3 |
(1.4) |
ppts. |
||||||
|
Payroll and employee benefits |
29.8 |
31.7 |
1.9 |
ppts. |
28.2 |
29.3 |
1.1 |
ppts. |
||||||
|
Occupancy and other operating expenses |
28.7 |
29.0 |
0.3 |
ppts. |
27.1 |
27.6 |
0.5 |
ppts. |
||||||
|
Restaurant margin |
9.3 % |
7.3 % |
2.0 |
ppts. |
12.0 % |
11.8 % |
0.2 |
ppts. |
||||||
|
Percentages may not recompute due to rounding. |
||||||||||||||
|
Yum China Holdings, Inc. |
||||
|
Condensed Consolidated Balance Sheets |
||||
|
(in US$ million) |
||||
|
12/31/2024 |
12/31/2023 |
|||
|
(Unaudited) |
||||
|
ASSETS |
||||
|
Current Assets |
||||
|
Cash and cash equivalents |
$ 723 |
$ 1,128 |
||
|
Short-term investments |
1,121 |
1,472 |
||
|
Accounts receivable, net |
79 |
68 |
||
|
Inventories, net |
405 |
424 |
||
|
Prepaid expenses and other current assets |
366 |
339 |
||
|
Total Current Assets |
2,694 |
3,431 |
||
|
Property, plant and equipment, net |
2,407 |
2,310 |
||
|
Operating lease right-of-use assets |
2,146 |
2,217 |
||
|
Goodwill |
1,880 |
1,932 |
||
|
Intangible assets, net |
144 |
150 |
||
|
Long-term bank deposits and notes |
1,088 |
1,265 |
||
|
Equity investments |
368 |
332 |
||
|
Deferred income tax assets |
138 |
129 |
||
|
Other assets |
256 |
265 |
||
|
Total Assets |
11,121 |
12,031 |
||
|
LIABILITIES, REDEEMABLE NONCONTROLLING INTEREST AND EQUITY |
||||
|
Current Liabilities |
||||
|
Accounts payable and other current liabilities |
2,080 |
2,164 |
||
|
Short-term borrowings |
127 |
168 |
||
|
Income taxes payable |
76 |
90 |
||
|
Total Current Liabilities |
2,283 |
2,422 |
||
|
Non-current operating lease liabilities |
1,816 |
1,899 |
||
|
Non-current finance lease liabilities |
49 |
44 |
||
|
Deferred income tax liabilities |
389 |
390 |
||
|
Other liabilities |
157 |
157 |
||
|
Total Liabilities |
4,694 |
4,912 |
||
|
Redeemable Noncontrolling Interest |
13 |
13 |
||
|
Equity |
||||
|
Common stock, $0.01 par value; 1,000 million shares authorized; 379 million shares |
4 |
4 |
||
|
Treasury stock |
(52) |
— |
||
|
Additional paid-in capital |
4,028 |
4,320 |
||
|
Retained earnings |
2,089 |
2,310 |
||
|
Accumulated other comprehensive loss |
(341) |
(229) |
||
|
Total Yum China Holdings, Inc. Stockholders’ Equity |
5,728 |
6,405 |
||
|
Noncontrolling interests |
686 |
701 |
||
|
Total Equity |
6,414 |
7,106 |
||
|
Total Liabilities, Redeemable Noncontrolling Interest and Equity |
$ 11,121 |
$ 12,031 |
||
|
Yum China Holdings, Inc. |
||||||
|
Condensed Consolidated Statements of Cash Flows |
||||||
|
(in US$ million) |
||||||
|
(unaudited) |
||||||
|
Year Ended |
||||||
|
12/31/2024 |
12/31/2023 |
|||||
|
Cash Flows – Operating Activities |
||||||
|
Net income – including noncontrolling interests |
$ 980 |
$ 901 |
||||
|
Depreciation and amortization |
476 |
453 |
||||
|
Non-cash operating lease cost |
408 |
404 |
||||
|
Closures and impairment expenses |
39 |
29 |
||||
|
Investment (gain) loss |
(40) |
49 |
||||
|
Equity in net (earnings) losses from equity method investments |
(5) |
(4) |
||||
|
Distributions of income received from equity method investments |
11 |
11 |
||||
|
Deferred income taxes |
(7) |
(10) |
||||
|
Share-based compensation expense |
41 |
64 |
||||
|
Changes in accounts receivable |
(9) |
(6) |
||||
|
Changes in inventories |
8 |
(19) |
||||
|
Changes in prepaid expenses, other current assets and value-added tax assets |
(27) |
(35) |
||||
|
Changes in accounts payable and other current liabilities |
(3) |
84 |
||||
|
Changes in income taxes payable |
(12) |
25 |
||||
|
Changes in non-current operating lease liabilities |
(411) |
(407) |
||||
|
Other, net |
(30) |
(66) |
||||
|
Net Cash Provided by Operating Activities |
1,419 |
1,473 |
||||
|
Cash Flows – Investing Activities |
||||||
|
Capital spending |
(705) |
(710) |
||||
|
Purchases of short-term investments, long-term bank deposits and notes |
(4,728) |
(3,517) |
||||
|
Maturities of short-term investments, long-term bank deposits and notes |
5,251 |
3,499 |
||||
|
Acquisition of equity investment |
— |
(20) |
||||
|
Other, net |
4 |
5 |
||||
|
Net Cash Used in Investing Activities |
(178) |
(743) |
||||
|
Cash Flows – Financing Activities |
||||||
|
Proceeds from short-term borrowings |
307 |
264 |
||||
|
Repayment of short-term borrowings |
(346) |
(100) |
||||
|
Repurchase of shares of common stock |
(1,249) |
(613) |
||||
|
Cash dividends paid on common stock |
(248) |
(216) |
||||
|
Dividends paid to noncontrolling interests |
(80) |
(77) |
||||
|
Contributions from noncontrolling interests |
— |
35 |
||||
|
Payment of acquisition related holdback |
— |
(3) |
||||
|
Other, net |
(20) |
(6) |
||||
|
Net Cash Used in Financing Activities |
(1,636) |
(716) |
||||
|
Effect of Exchange Rates on Cash, Cash Equivalents and Restricted Cash |
(10) |
(16) |
||||
|
Net Decrease in Cash, Cash Equivalents and Restricted Cash |
(405) |
(2) |
||||
|
Cash, Cash Equivalents, and Restricted Cash – Beginning of Year |
1,128 |
1,130 |
||||
|
Cash, Cash Equivalents, and Restricted Cash – End of Year |
$ 723 |
$ 1,128 |
||||
In this press release:
- Certain performance metrics and non-GAAP measures are presented excluding the impact of foreign currency translation (“F/X”). These amounts are derived by translating current year results at prior year average exchange rates. We believe the elimination of the F/X impact provides better year-to-year comparability without the distortion of foreign currency fluctuations.
- System sales growth reflects the results of all restaurants regardless of ownership, including Company-owned and franchise restaurants that operate our restaurant concepts, except for non-Company-owned restaurants for which we do not receive a sales-based royalty. Sales of franchise restaurants typically generate ongoing franchise fees for the Company at an average rate of approximately 6% of system sales. Franchise restaurant sales are not included in Company sales in the Condensed Consolidated Statements of Income; however, the franchise fees are included in the Company’s revenues. We believe system sales growth is useful to investors as a significant indicator of the overall strength of our business as it incorporates all of our revenue drivers, Company and franchise same-store sales as well as net unit growth.
- Effective January 1, 2018, the Company revised its definition of same-store sales growth to represent the estimated percentage change in sales of food of all restaurants in the Company system that have been open prior to the first day of our prior fiscal year, excluding the period during which stores are temporarily closed. We refer to these as our “base” stores. Previously, same-store sales growth represented the estimated percentage change in sales of all restaurants in the Company system that have been open for one year or more, including stores temporarily closed, and the base stores changed on a rolling basis from month to month. This revision was made to align with how management measures performance internally and focuses on trends of a more stable base of stores.
|
Unit Count by Brand |
|||||||||||||
|
KFC |
|||||||||||||
|
12/31/2023 |
New Builds |
Closures |
Acquired |
12/31/2024 |
|||||||||
|
Company-owned |
9,237 |
1,278 |
(330) |
2 |
10,187 |
||||||||
|
Franchisees |
1,059 |
429 |
(25) |
(2) |
1,461 |
||||||||
|
Total |
10,296 |
1,707 |
(355) |
— |
11,648 |
||||||||
|
Pizza Hut |
|||||||||||||
|
12/31/2023 |
New Builds |
Closures |
12/31/2024 |
||||||||||
|
Company-owned |
3,155 |
539 |
(169) |
3,525 |
|||||||||
|
Franchisees |
157 |
47 |
(5) |
199 |
|||||||||
|
Total |
3,312 |
586 |
(174) |
3,724 |
|||||||||
|
Others |
|||||||||||||
|
12/31/2023 |
New Builds |
Closures |
12/31/2024 |
||||||||||
|
Company-owned |
256 |
20 |
(101) |
175 |
|||||||||
|
Franchisees |
780 |
190 |
(122) |
848 |
|||||||||
|
Total |
1,036 |
210 |
(223) |
1,023 |
|||||||||
Reconciliation of Reported GAAP Results to Non-GAAP Measures
(in millions, except per share data)
(unaudited)
In addition to the results provided in accordance with U.S. Generally Accepted Accounting Principles (“GAAP”) in this press release, the Company provides the following non-GAAP measures:
- Measures adjusted for Special Items, which include Adjusted Operating Profit, Adjusted Net Income, Adjusted Earnings Per Common Share (“EPS”), Adjusted Effective Tax Rate and Adjusted EBITDA;
- Company Restaurant Profit (“Restaurant profit”) and Restaurant margin;
- Core Operating Profit and Core OP margin, which exclude Special Items, and further adjusted for Items Affecting Comparability and the impact of F/X;
These non-GAAP measures are not intended to replace the presentation of our financial results in accordance with GAAP. Rather, the Company believes that the presentation of these non-GAAP measures provides additional information to investors to facilitate the comparison of past and present results, excluding those items that the Company does not believe are indicative of our core operations.
With respect to non-GAAP measures adjusted for Special Items, the Company excludes impact from Special Items for the purpose of evaluating performance internally and uses them as factors in determining compensation for certain employees. Special Items are not included in any of our segment results.
Adjusted EBITDA is defined as net income including noncontrolling interests adjusted for equity in net earnings (losses) from equity method investments, income tax, interest income, net, investment gain or loss, depreciation and amortization, store impairment charges, and Special Items. Store impairment charges included as an adjustment item in Adjusted EBITDA primarily resulted from our semi-annual impairment evaluation of long-lived assets of individual restaurants, and additional impairment evaluation whenever events or changes in circumstances indicate that the carrying value of the assets may not be recoverable. If these restaurant-level assets were not impaired, depreciation of the assets would have been recorded and included in EBITDA. Therefore, store impairment charges were a non-cash item similar to depreciation and amortization of our long-lived assets of restaurants. The Company believes that investors and analysts may find it useful in measuring operating performance without regard to such non-cash items.
Restaurant Profit is defined as Company sales less expenses incurred directly by our Company-owned restaurants in generating Company sales, including cost of food and paper, restaurant-level payroll and employee benefits, rent, depreciation and amortization of restaurant-level assets, advertising expenses, and other operating expenses. Company restaurant margin percentage is defined as Restaurant profit divided by Company sales. We also use Restaurant profit and Restaurant margin for the purposes of internally evaluating the performance of our Company-owned restaurants and we believe they provide useful information to investors as to the profitability of our Company-owned restaurants.
Core Operating Profit is defined as Operating Profit adjusted for Special Items, and further excluding Items Affecting Comparability and the impact of F/X. We consider quantitative and qualitative factors in assessing whether to adjust for the impact of items that may be significant or that could affect an understanding of our ongoing financial and business performance or trends. Items such as charges, gains and accounting changes which are viewed by management as significantly impacting the current period or the comparable period, due to changes in policy or other external factors, or non-cash items pertaining to underlying activities that are different from or unrelated to our core operations, are generally considered “Items Affecting Comparability.” Examples of Items Affecting Comparability include, but are not limited to: temporary relief from landlords and government agencies; VAT deductions due to tax policy changes; and amortization of reacquired franchise rights recognized upon acquisitions. We believe presenting Core Operating Profit provides additional information to further enhance comparability of our operating results and we use this measure for purposes of evaluating the performance of our core operations. Core OP margin is defined as Core Operating Profit divided by Total revenues, excluding the impact of F/X.
The following tables set forth the reconciliation of the most directly comparable GAAP financial measures to the non-GAAP financial measures. The reconciliation of GAAP Operating Profit to Restaurant Profit and Core Operating Profit by segment is presented in Segment Results within this release.
|
Quarter Ended |
Year Ended |
|||||||
|
12/31/2024 |
12/31/2023 |
12/31/2024 |
12/31/2023 |
|||||
|
Reconciliation of Operating Profit to Adjusted Operating Profit |
||||||||
|
Operating Profit |
$ 151 |
$ 110 |
$ 1,162 |
$ 1,106 |
||||
|
Special Items, Operating Profit |
— |
(6) |
— |
(15) |
||||
|
Adjusted Operating Profit |
$ 151 |
$ 116 |
$ 1,162 |
$ 1,121 |
||||
|
Reconciliation of Net Income to Adjusted Net Income |
||||||||
|
Net Income – Yum China Holdings, Inc. |
$ 115 |
$ 97 |
$ 911 |
$ 827 |
||||
|
Special Items, Net Income –Yum China Holdings, Inc. |
— |
(6) |
— |
(15) |
||||
|
Adjusted Net Income – Yum China Holdings, Inc. |
$ 115 |
$ 103 |
$ 911 |
$ 842 |
||||
|
Reconciliation of EPS to Adjusted EPS |
||||||||
|
Basic Earnings Per Common Share |
$ 0.30 |
$ 0.23 |
$ 2.34 |
$ 1.99 |
||||
|
Special Items, Basic Earnings Per Common Share |
— |
(0.02) |
— |
(0.03) |
||||
|
Adjusted Basic Earnings Per Common Share |
$ 0.30 |
$ 0.25 |
$ 2.34 |
$ 2.02 |
||||
|
Diluted Earnings Per Common Share |
$ 0.30 |
$ 0.23 |
$ 2.33 |
$ 1.97 |
||||
|
Special Items, Diluted Earnings Per Common Share |
— |
(0.02) |
— |
(0.03) |
||||
|
Adjusted Diluted Earnings Per Common Share |
$ 0.30 |
$ 0.25 |
$ 2.33 |
$ 2.00 |
||||
|
Reconciliation of Effective Tax Rate to Adjusted Effective Tax Rate |
||||||||
|
Effective tax rate |
27.6 % |
24.2 % |
26.7 % |
26.9 % |
||||
|
Impact on effective tax rate as a result of Special Items |
— |
1.0 % |
— |
0.4 % |
||||
|
Adjusted effective tax rate |
27.6 % |
23.2 % |
26.7 % |
26.5 % |
||||
|
Net income, along with the reconciliation to Adjusted EBITDA, is presented below. |
||||||||
|
Quarter Ended |
Year Ended |
|||||||
|
12/31/2024 |
12/31/2023 |
12/31/2024 |
12/31/2023 |
|||||
|
Net Income – Yum China Holdings, Inc. |
$ 115 |
$ 97 |
$ 911 |
$ 827 |
||||
|
Net income – noncontrolling interests |
11 |
10 |
69 |
74 |
||||
|
Equity in net (earnings) losses from equity method investments |
(3) |
(2) |
(5) |
(4) |
||||
|
Income tax provision |
47 |
33 |
356 |
329 |
||||
|
Interest income, net |
(29) |
(45) |
(129) |
(169) |
||||
|
Investment loss (gain) |
10 |
17 |
(40) |
49 |
||||
|
Operating Profit |
151 |
110 |
1,162 |
1,106 |
||||
|
Special Items, Operating Profit |
— |
6 |
— |
15 |
||||
|
Adjusted Operating Profit |
151 |
116 |
1,162 |
1,121 |
||||
|
Depreciation and amortization |
121 |
114 |
476 |
453 |
||||
|
Store impairment charges |
20 |
13 |
49 |
37 |
||||
|
Adjusted EBITDA |
$ 292 |
$ 243 |
$ 1,687 |
$ 1,611 |
||||
|
Detail of Special Items are presented below: |
||||||||
|
Quarter Ended |
Year Ended |
|||||||
|
12/31/2024 |
12/31/2023 |
12/31/2024 |
12/31/2023 |
|||||
|
Share-based compensation expense for Partner PSU Awards(1) |
$ — |
$ (6) |
$ — |
$ (15) |
||||
|
Special Items, Operating Profit |
— |
(6) |
— |
(15) |
||||
|
Tax effect on Special Items(2) |
— |
— |
— |
— |
||||
|
Special Items, net income – including noncontrolling interests |
— |
(6) |
— |
(15) |
||||
|
Special Items, net income – noncontrolling interests |
— |
— |
— |
— |
||||
|
Special Items, Net Income –Yum China Holdings, Inc. |
$ — |
$ (6) |
$ — |
$ (15) |
||||
|
Weighted-average Diluted Shares Outstanding (in millions) |
382 |
415 |
390 |
420 |
||||
|
Special Items, Diluted Earnings Per Common Share |
$ — |
$ (0.02) |
$ — |
$ (0.03) |
||||
|
(1) In February 2020, the Company granted Partner PSU Awards to select employees who were deemed critical to the Company’s execution |
|
(2) The tax expense was determined based upon the nature, as well as the jurisdiction, of each Special Item at the applicable tax rate. |
|
Operating Profit, along with the reconciliation to Core Operating Profit, is presented below: |
|||||||||||||
|
Quarter ended |
% Change |
Year Ended |
% Change |
||||||||||
|
12/31/2024 |
12/31/2023 |
B/(W) |
12/31/2024 |
12/31/2023 |
B/(W) |
||||||||
|
Operating Profit |
$ 151 |
$ 110 |
36 |
$ 1,162 |
$ 1,106 |
5 |
|||||||
|
Special Items, Operating Profit |
— |
6 |
— |
15 |
|||||||||
|
Adjusted Operating Profit |
$ 151 |
$ 116 |
29 |
$ 1,162 |
$ 1,121 |
4 |
|||||||
|
Items Affecting Comparability |
|||||||||||||
|
Temporary relief from landlords(1) |
— |
(1) |
— |
(11) |
|||||||||
|
Temporary relief from government agencies(2) |
— |
(3) |
— |
(7) |
|||||||||
|
VAT deductions(3) |
— |
(2) |
— |
(44) |
|||||||||
|
Amortization of reacquired franchise rights(4) |
— |
— |
— |
2 |
|||||||||
|
F/X impact(5) |
(1) |
— |
28 |
— |
|||||||||
|
Core Operating Profit |
$ 150 |
$ 110 |
35 |
$ 1,190 |
$ 1,061 |
12 |
|||||||
|
Total revenues |
2,595 |
2,493 |
4 |
11,303 |
10,978 |
3 |
|||||||
|
F/X impact(5) |
(8) |
— |
200 |
— |
|||||||||
|
Total revenues, excluding the impact of F/X |
$ 2,587 |
$ 2,493 |
4 |
$ 11,503 |
$ 10,978 |
5 |
|||||||
|
Core OP margin |
5.8 % |
4.4 % |
1.4 |
ppts |
10.4 % |
9.7 % |
0.7 |
ppts. |
|||||
|
(1) In relation to the effects of the COVID-19 pandemic, the Company was granted lease concessions from landlords. The lease concessions |
|||||||||||||
|
(2) In relation to the effects of the COVID-19 pandemic, the Company received government subsidies for employee benefits and providing |
|||||||||||||
|
(3) Pursuant to the tax policy issued by relevant government authorities, general VAT taxpayers in certain industries that meet certain criteria |
|||||||||||||
|
(4) As a result of the acquisition of our previously unconsolidated joint ventures of Hangzhou KFC, Suzhou KFC and Wuxi KFC, $66 million, |
|||||||||||||
|
(5) The F/X impact on Core Operating Profit and Total revenues is presented only for the current year in relation to the immediately preceding |
|||||||||||||
|
Yum China Holdings, Inc. |
||||||||||||||||||||||||
|
Segment Results |
||||||||||||||||||||||||
|
(in US$ million) |
||||||||||||||||||||||||
|
(unaudited) |
||||||||||||||||||||||||
|
Quarter Ended 12/31/2024 |
||||||||||||||||||||||||
|
KFC |
Pizza Hut |
All Other |
Corporate |
Elimination |
Total |
|||||||||||||||||||
|
Company sales |
$ |
1,923 |
$ |
500 |
$ |
11 |
$ |
— |
$ |
— |
$ |
2,434 |
||||||||||||
|
Franchise fees and income |
16 |
2 |
4 |
— |
— |
22 |
||||||||||||||||||
|
Revenues from transactions with franchisees(2) |
14 |
1 |
16 |
70 |
— |
101 |
||||||||||||||||||
|
Other revenues |
1 |
7 |
164 |
16 |
(150) |
38 |
||||||||||||||||||
|
Total revenues |
$ |
1,954 |
$ |
510 |
$ |
195 |
$ |
86 |
$ |
(150) |
$ |
2,595 |
||||||||||||
|
Company restaurant expenses |
1,668 |
452 |
13 |
— |
— |
2,133 |
||||||||||||||||||
|
General and administrative expenses |
65 |
30 |
8 |
53 |
— |
156 |
||||||||||||||||||
|
Franchise expenses |
7 |
1 |
— |
— |
— |
8 |
||||||||||||||||||
|
Expenses for transactions with franchisees(2) |
13 |
1 |
15 |
69 |
— |
98 |
||||||||||||||||||
|
Other operating costs and expenses |
1 |
6 |
159 |
16 |
(150) |
32 |
||||||||||||||||||
|
Closures and impairment expenses, net |
8 |
6 |
3 |
— |
— |
17 |
||||||||||||||||||
|
Total costs and expenses, net |
1,762 |
496 |
198 |
138 |
(150) |
2,444 |
||||||||||||||||||
|
Operating Profit (Loss) |
$ |
192 |
$ |
14 |
$ |
(3) |
$ |
(52) |
$ |
— |
$ |
151 |
||||||||||||
Reconciliation of GAAP Operating Profit to Restaurant Profit is as follows:
|
Quarter Ended 12/31/2024 |
||||||||||||||||||||||||
|
KFC |
Pizza Hut |
All Other |
Corporate |
Elimination |
Total |
|||||||||||||||||||
|
GAAP Operating Profit (Loss) |
$ |
192 |
$ |
14 |
$ |
(3) |
$ |
(52) |
$ |
— |
$ |
151 |
||||||||||||
|
Less: |
||||||||||||||||||||||||
|
Franchise fees and income |
16 |
2 |
4 |
— |
— |
22 |
||||||||||||||||||
|
Revenues from transactions with franchisees(2) |
14 |
1 |
16 |
70 |
— |
101 |
||||||||||||||||||
|
Other revenues |
1 |
7 |
164 |
16 |
(150) |
38 |
||||||||||||||||||
|
Add: |
||||||||||||||||||||||||
|
General and administrative expenses |
65 |
30 |
8 |
53 |
— |
156 |
||||||||||||||||||
|
Franchise expenses |
7 |
1 |
— |
— |
— |
8 |
||||||||||||||||||
|
Expenses for transactions with franchisees(2) |
13 |
1 |
15 |
69 |
— |
98 |
||||||||||||||||||
|
Other operating costs and expenses |
1 |
6 |
159 |
16 |
(150) |
32 |
||||||||||||||||||
|
Closures and impairment expenses, net |
8 |
6 |
3 |
— |
— |
17 |
||||||||||||||||||
|
Restaurant profit (loss) |
$ |
255 |
$ |
48 |
$ |
(2) |
$ |
— |
$ |
— |
$ |
301 |
||||||||||||
|
Company sales |
1,923 |
500 |
11 |
— |
— |
2,434 |
||||||||||||||||||
|
Restaurant margin % |
13.3 |
% |
9.3 |
% |
(13.1) |
% |
N/A |
N/A |
12.3 |
% |
||||||||||||||
Reconciliation of GAAP Operating Profit to Core Operating Profit is as follows:
|
Quarter Ended 12/31/2024 |
||||||||||||||||||||||||
|
KFC |
Pizza Hut |
All Other |
Corporate |
Elimination |
Total |
|||||||||||||||||||
|
GAAP Operating Profit (Loss) |
$ |
192 |
$ |
14 |
$ |
(3) |
$ |
(52) |
$ |
— |
$ |
151 |
||||||||||||
|
Special Items, Operating Profit |
— |
— |
— |
— |
— |
— |
||||||||||||||||||
|
Adjusted Operating Profit (Loss) |
$ |
192 |
$ |
14 |
$ |
(3) |
$ |
(52) |
$ |
— |
$ |
151 |
||||||||||||
|
F/X impact |
(1) |
— |
— |
— |
— |
(1) |
||||||||||||||||||
|
Core Operating Profit (Loss) |
$ |
191 |
$ |
14 |
$ |
(3) |
$ |
(52) |
$ |
— |
$ |
150 |
||||||||||||
|
Quarter Ended 12/31/2023 |
||||||||||||||||||||||||
|
KFC |
Pizza Hut |
All Other |
Corporate |
Elimination |
Total |
|||||||||||||||||||
|
Company sales |
$ |
1,842 |
$ |
486 |
$ |
15 |
$ |
— |
$ |
— |
$ |
2,343 |
||||||||||||
|
Franchise fees and income |
14 |
1 |
5 |
— |
— |
20 |
||||||||||||||||||
|
Revenues from transactions with franchisees(2) |
12 |
1 |
18 |
59 |
— |
90 |
||||||||||||||||||
|
Other revenues |
4 |
8 |
156 |
12 |
(140) |
40 |
||||||||||||||||||
|
Total revenues |
$ |
1,872 |
$ |
496 |
$ |
194 |
$ |
71 |
$ |
(140) |
$ |
2,493 |
||||||||||||
|
Company restaurant expenses |
1,621 |
449 |
20 |
— |
— |
2,090 |
||||||||||||||||||
|
General and administrative expenses |
60 |
29 |
11 |
53 |
— |
153 |
||||||||||||||||||
|
Franchise expenses |
7 |
1 |
— |
— |
— |
8 |
||||||||||||||||||
|
Expenses for transactions with franchisees(2) |
10 |
1 |
17 |
58 |
— |
86 |
||||||||||||||||||
|
Other operating costs and expenses |
4 |
8 |
151 |
12 |
(140) |
35 |
||||||||||||||||||
|
Closures and impairment expenses, net |
3 |
3 |
6 |
— |
— |
12 |
||||||||||||||||||
|
Other income, net |
— |
— |
— |
(1) |
— |
(1) |
||||||||||||||||||
|
Total costs and expenses, net |
1,705 |
491 |
205 |
122 |
(140) |
2,383 |
||||||||||||||||||
|
Operating Profit (Loss) |
$ |
167 |
$ |
5 |
$ |
(11) |
$ |
(51) |
$ |
— |
$ |
110 |
||||||||||||
Reconciliation of GAAP Operating Profit to Restaurant Profit is as follows:
|
Quarter Ended 12/31/2023 |
||||||||||||||||||||||||
|
KFC |
Pizza Hut |
All Other |
Corporate |
Elimination |
Total |
|||||||||||||||||||
|
GAAP Operating Profit (Loss) |
$ |
167 |
$ |
5 |
$ |
(11) |
$ |
(51) |
$ |
— |
$ |
110 |
||||||||||||
|
Less: |
||||||||||||||||||||||||
|
Franchise fees and income |
14 |
1 |
5 |
— |
— |
20 |
||||||||||||||||||
|
Revenues from transactions with franchisees(2) |
12 |
1 |
18 |
59 |
— |
90 |
||||||||||||||||||
|
Other revenues |
4 |
8 |
156 |
12 |
(140) |
40 |
||||||||||||||||||
|
Add: |
||||||||||||||||||||||||
|
General and administrative expenses |
60 |
29 |
11 |
53 |
— |
153 |
||||||||||||||||||
|
Franchise expenses |
7 |
1 |
— |
— |
— |
8 |
||||||||||||||||||
|
Expenses for transactions with franchisees(2) |
10 |
1 |
17 |
58 |
— |
86 |
||||||||||||||||||
|
Other operating costs and expenses |
4 |
8 |
151 |
12 |
(140) |
35 |
||||||||||||||||||
|
Closures and impairment expenses, net |
3 |
3 |
6 |
— |
— |
12 |
||||||||||||||||||
|
Other income, net |
— |
— |
— |
(1) |
— |
(1) |
||||||||||||||||||
|
Restaurant profit (loss) |
$ |
221 |
$ |
37 |
$ |
(5) |
$ |
— |
$ |
— |
$ |
253 |
||||||||||||
|
Company sales |
1,842 |
486 |
15 |
— |
— |
2,343 |
||||||||||||||||||
|
Restaurant margin % |
12.0 |
% |
7.3 |
% |
(35.9) |
% |
N/A |
N/A |
10.7 |
% |
||||||||||||||
Reconciliation of GAAP Operating Profit to Core Operating Profit is as follows:
|
Quarter Ended 12/31/2023 |
||||||||||||||||||||||||
|
KFC |
Pizza Hut |
All Other |
Corporate |
Elimination |
Total |
|||||||||||||||||||
|
GAAP Operating Profit (Loss) |
$ |
167 |
$ |
5 |
$ |
(11) |
$ |
(51) |
$ |
— |
$ |
110 |
||||||||||||
|
Special Items, Operating Profit |
— |
— |
— |
6 |
— |
6 |
||||||||||||||||||
|
Adjusted Operating Profit (Loss) |
$ |
167 |
$ |
5 |
$ |
(11) |
$ |
(45) |
$ |
— |
$ |
116 |
||||||||||||
|
Items Affecting Comparability |
||||||||||||||||||||||||
|
Temporary relief from landlords |
(1) |
— |
— |
— |
— |
(1) |
||||||||||||||||||
|
Temporary relief from government agencies |
(2) |
(1) |
— |
— |
— |
(3) |
||||||||||||||||||
|
VAT deductions |
(2) |
— |
— |
— |
— |
(2) |
||||||||||||||||||
|
F/X impact |
— |
— |
— |
— |
— |
— |
||||||||||||||||||
|
Core Operating Profit (Loss) |
$ |
162 |
$ |
4 |
$ |
(11) |
$ |
(45) |
$ |
— |
$ |
110 |
||||||||||||
|
Year Ended 12/31/2024 |
||||||||||||||||||||||||
|
KFC |
Pizza Hut |
All Other |
Corporate |
Elimination |
Total |
|||||||||||||||||||
|
Company sales |
$ |
8,375 |
$ |
2,223 |
$ |
53 |
$ |
— |
$ |
— |
$ |
10,651 |
||||||||||||
|
Franchise fees and income |
69 |
8 |
17 |
— |
— |
94 |
||||||||||||||||||
|
Revenues from transactions with franchisees(2) |
55 |
5 |
71 |
289 |
— |
420 |
||||||||||||||||||
|
Other revenues |
10 |
24 |
648 |
64 |
(608) |
138 |
||||||||||||||||||
|
Total revenues |
$ |
8,509 |
$ |
2,260 |
$ |
789 |
$ |
353 |
$ |
(608) |
$ |
11,303 |
||||||||||||
|
Company restaurant expenses |
6,961 |
1,955 |
58 |
— |
(2) |
8,972 |
||||||||||||||||||
|
General and administrative expenses |
248 |
110 |
37 |
173 |
— |
568 |
||||||||||||||||||
|
Franchise expenses |
32 |
4 |
1 |
— |
— |
37 |
||||||||||||||||||
|
Expenses for transactions with franchisees(2) |
49 |
4 |
65 |
286 |
— |
404 |
||||||||||||||||||
|
Other operating costs and expenses |
8 |
22 |
635 |
63 |
(606) |
122 |
||||||||||||||||||
|
Closures and impairment expenses, net |
19 |
12 |
8 |
— |
— |
39 |
||||||||||||||||||
|
Other income, net |
— |
— |
— |
(1) |
— |
(1) |
||||||||||||||||||
|
Total costs and expenses, net |
7,317 |
2,107 |
804 |
521 |
(608) |
10,141 |
||||||||||||||||||
|
Operating Profit (Loss) |
$ |
1,192 |
$ |
153 |
$ |
(15) |
$ |
(168) |
$ |
— |
$ |
1,162 |
||||||||||||
Reconciliation of GAAP Operating Profit to Restaurant Profit is as follows:
|
Year Ended 12/31/2024 |
||||||||||||||||||||||||
|
KFC |
Pizza Hut |
All Other |
Corporate |
Elimination |
Total |
|||||||||||||||||||
|
GAAP Operating Profit (Loss) |
$ |
1,192 |
$ |
153 |
$ |
(15) |
$ |
(168) |
$ |
— |
$ |
1,162 |
||||||||||||
|
Less: |
||||||||||||||||||||||||
|
Franchise fees and income |
69 |
8 |
17 |
— |
— |
94 |
||||||||||||||||||
|
Revenues from transactions with franchisees(2) |
55 |
5 |
71 |
289 |
— |
420 |
||||||||||||||||||
|
Other revenues |
10 |
24 |
648 |
64 |
(608) |
138 |
||||||||||||||||||
|
Add: |
||||||||||||||||||||||||
|
General and administrative expenses |
248 |
110 |
37 |
173 |
— |
568 |
||||||||||||||||||
|
Franchise expenses |
32 |
4 |
1 |
— |
— |
37 |
||||||||||||||||||
|
Expenses for transactions with franchisees(2) |
49 |
4 |
65 |
286 |
— |
404 |
||||||||||||||||||
|
Other operating costs and expenses |
8 |
22 |
635 |
63 |
(606) |
122 |
||||||||||||||||||
|
Closures and impairment expenses, net |
19 |
12 |
8 |
— |
— |
39 |
||||||||||||||||||
|
Other income, net |
— |
— |
— |
(1) |
— |
(1) |
||||||||||||||||||
|
Restaurant profit (loss) |
$ |
1,414 |
$ |
268 |
$ |
(5) |
$ |
— |
$ |
2 |
$ |
1,679 |
||||||||||||
|
Company sales |
8,375 |
2,223 |
53 |
— |
— |
10,651 |
||||||||||||||||||
|
Restaurant margin % |
16.9 |
% |
12.0 |
% |
(12.1) |
% |
N/A |
N/A |
15.7 |
% |
||||||||||||||
Reconciliation of GAAP Operating Profit to Core Operating Profit is as follows:
|
Year Ended 12/31/2024 |
||||||||||||||||||||||||
|
KFC |
Pizza Hut |
All Other |
Corporate |
Elimination |
Total |
|||||||||||||||||||
|
GAAP Operating Profit (Loss) |
$ |
1,192 |
$ |
153 |
$ |
(15) |
$ |
(168) |
$ |
— |
$ |
1,162 |
||||||||||||
|
Special Items, Operating Profit |
— |
— |
— |
— |
— |
— |
||||||||||||||||||
|
Adjusted Operating Profit (Loss) |
$ |
1,192 |
$ |
153 |
$ |
(15) |
$ |
(168) |
$ |
— |
$ |
1,162 |
||||||||||||
|
F/X impact |
26 |
4 |
— |
(2) |
— |
28 |
||||||||||||||||||
|
Core Operating Profit (Loss) |
$ |
1,218 |
$ |
157 |
$ |
(15) |
$ |
(170) |
$ |
— |
$ |
1,190 |
||||||||||||
|
Year Ended 12/31/2023 |
||||||||||||||||||||||||
|
KFC |
Pizza Hut |
All Other |
Corporate |
Elimination |
Total |
|||||||||||||||||||
|
Company sales |
$ |
8,116 |
$ |
2,214 |
$ |
61 |
$ |
— |
$ |
— |
$ |
10,391 |
||||||||||||
|
Franchise fees and income |
62 |
7 |
20 |
— |
— |
89 |
||||||||||||||||||
|
Revenues from transactions with franchisees(2) |
45 |
4 |
74 |
249 |
— |
372 |
||||||||||||||||||
|
Other revenues |
17 |
21 |
624 |
44 |
(580) |
126 |
||||||||||||||||||
|
Total revenues |
$ |
8,240 |
$ |
2,246 |
$ |
779 |
$ |
293 |
$ |
(580) |
$ |
10,978 |
||||||||||||
|
Company restaurant expenses |
6,676 |
1,951 |
76 |
— |
(2) |
8,701 |
||||||||||||||||||
|
General and administrative expenses |
263 |
118 |
43 |
214 |
— |
638 |
||||||||||||||||||
|
Franchise expenses |
31 |
4 |
1 |
— |
— |
36 |
||||||||||||||||||
|
Expenses for transactions with franchisees(2) |
39 |
4 |
67 |
246 |
— |
356 |
||||||||||||||||||
|
Other operating costs and expenses |
15 |
19 |
614 |
42 |
(578) |
112 |
||||||||||||||||||
|
Closures and impairment expenses, net |
12 |
8 |
9 |
— |
— |
29 |
||||||||||||||||||
|
Other expenses (income), net |
2 |
— |
— |
(2) |
— |
— |
||||||||||||||||||
|
Total costs and expenses, net |
7,038 |
2,104 |
810 |
500 |
(580) |
9,872 |
||||||||||||||||||
|
Operating Profit (Loss) |
$ |
1,202 |
$ |
142 |
$ |
(31) |
$ |
(207) |
$ |
— |
$ |
1,106 |
||||||||||||
Reconciliation of GAAP Operating Profit to Restaurant Profit is as follows:
|
Year Ended 12/31/2023 |
||||||||||||||||||||||||
|
KFC |
Pizza Hut |
All Other |
Corporate |
Elimination |
Total |
|||||||||||||||||||
|
GAAP Operating Profit (Loss) |
$ |
1,202 |
$ |
142 |
$ |
(31) |
$ |
(207) |
$ |
— |
$ |
1,106 |
||||||||||||
|
Less: |
||||||||||||||||||||||||
|
Franchise fees and income |
62 |
7 |
20 |
— |
— |
89 |
||||||||||||||||||
|
Revenues from transactions with franchisees(2) |
45 |
4 |
74 |
249 |
— |
372 |
||||||||||||||||||
|
Other revenues |
17 |
21 |
624 |
44 |
(580) |
126 |
||||||||||||||||||
|
Add: |
||||||||||||||||||||||||
|
General and administrative expenses |
263 |
118 |
43 |
214 |
— |
638 |
||||||||||||||||||
|
Franchise expenses |
31 |
4 |
1 |
— |
— |
36 |
||||||||||||||||||
|
Expenses for transactions with franchisees(2) |
39 |
4 |
67 |
246 |
— |
356 |
||||||||||||||||||
|
Other operating costs and expenses |
15 |
19 |
614 |
42 |
(578) |
112 |
||||||||||||||||||
|
Closures and impairment expenses, net |
12 |
8 |
9 |
— |
— |
29 |
||||||||||||||||||
|
Other expenses (income), net |
2 |
— |
— |
(2) |
— |
— |
||||||||||||||||||
|
Restaurant profit (loss) |
$ |
1,440 |
$ |
263 |
$ |
(15) |
$ |
— |
$ |
2 |
$ |
1,690 |
||||||||||||
|
Company sales |
8,116 |
2,214 |
61 |
— |
— |
10,391 |
||||||||||||||||||
|
Restaurant margin % |
17.7 |
% |
11.8 |
% |
(25.1) |
% |
N/A |
N/A |
16.3 |
% |
||||||||||||||
Reconciliation of GAAP Operating Profit to Core Operating Profit is as follows:
|
Year Ended 12/31/2023 |
||||||||||||||||||||||||
|
KFC |
Pizza Hut |
All Other |
Corporate |
Elimination |
Total |
|||||||||||||||||||
|
GAAP Operating Profit (Loss) |
$ |
1,202 |
$ |
142 |
$ |
(31) |
$ |
(207) |
$ |
— |
$ |
1,106 |
||||||||||||
|
Special Items, Operating Profit |
— |
— |
— |
15 |
— |
15 |
||||||||||||||||||
|
Adjusted Operating Profit (Loss) |
$ |
1,202 |
$ |
142 |
$ |
(31) |
$ |
(192) |
$ |
— |
$ |
1,121 |
||||||||||||
|
Items Affecting Comparability |
||||||||||||||||||||||||
|
Temporary relief from landlords |
(9) |
(2) |
— |
— |
— |
(11) |
||||||||||||||||||
|
Temporary relief from government agencies |
(5) |
(2) |
— |
— |
— |
(7) |
||||||||||||||||||
|
VAT deductions |
(36) |
(6) |
(2) |
— |
— |
(44) |
||||||||||||||||||
|
Amortization of reacquired franchise rights |
2 |
— |
— |
— |
— |
2 |
||||||||||||||||||
|
F/X impact |
— |
— |
— |
— |
— |
— |
||||||||||||||||||
|
Core Operating Profit (Loss) |
$ |
1,154 |
$ |
132 |
$ |
(33) |
$ |
(192) |
$ |
— |
$ |
1,061 |
||||||||||||
The above tables reconcile segment information, which is based on management responsibility, with our Condensed Consolidated Statements of Income.
(1) Amounts have not been allocated to any segment for purpose of making operating decision or assessing financial performance as the transactions are deemed corporate revenues and expenses in nature.
(2) Primarily includes revenues and associated expenses of transactions with franchisees derived from the Company’s central procurement model whereby the Company centrally purchases substantially all food and paper products from suppliers and then sells and delivers to KFC and Pizza Hut restaurants, including franchisees.
NetEase Cloud Music Inc. to Report Fiscal Year 2024 Financial Results on February 20, 2025
HANGZHOU, China, Feb. 6, 2025 /PRNewswire/ — NetEase Cloud Music Inc. (HKEX: 9899 or the “Company”), a leading interactive music streaming service provider in China, today announced that it will report its financial results for the fiscal year of 2024 ended December 31, 2024 on Thursday, February 20, 2025, after the Hong Kong market closes.
The Company’s management will host an earnings conference call at 7:00 p.m. Beijing/Hong Kong Time on Thursday, February 20, 2025 (6:00 a.m. U.S. Eastern Time on the same day). Details for the conference call are as follows:
Event Title: NetEase Cloud Music Inc. Fiscal Year 2024 Earnings Conference Call
Registration Link: https://s1.c-conf.com/diamondpass/10044909-cc7t81.html
All participants must use the link provided above to complete the online registration process in advance of the conference call. Upon registering, each participant will receive a set of dial-in numbers, an event passcode, and a personal access PIN, which will be used to join the conference call.
A replay of the call will be accessible by phone at the following numbers and entering PIN: 10044909. The replay will be available through February 27, 2025.
|
Chinese Mainland: |
400-120-9216 |
|
Hong Kong: |
800-930-639 |
|
United States: |
1-855-883-1031 |
Additionally, a live and archived webcast of the conference call will be available on the Company’s investor relations website at http://ir.music.163.com.
About NetEase Cloud Music Inc.
Launched in 2013 by NetEase, Inc. (NASDAQ: NTES; HKEX: 9999), NetEase Cloud Music Inc. (HKEX: 9899) is a well-known online music platform featuring a vibrant content community. Dedicated to providing an elevated user experience, NetEase Cloud Music Inc. provides precise, personalised recommendations, promotes user interaction and creates a strong social community. Its focus on discovering and promoting emerging musicians has made NetEase Cloud Music Inc. a destination of choice for exploring new and independent music among music enthusiasts in China. The platform has been recognised as the most popular entertainment app among China’s vibrant Generation Z community.
Please see http://ir.music.163.com/ for more information.
Investor Enquiries:
Angela Xu
NetEase Cloud Music Inc.
music.ir@service.netease.com
TCL CSOT Showcases Cutting-edge Professional Display Solutions at ISE 2025
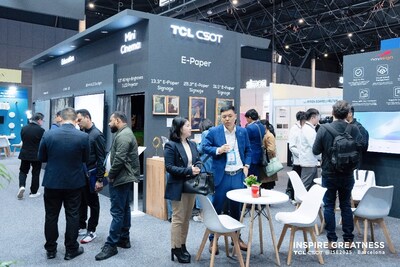
BARCELONA, Spain, Feb. 6, 2025 /PRNewswire/ — TCL CSOT, a global leader in display technology, is set to present its latest professional display innovations at Integrated Systems Europe (ISE) 2025, taking place from February 4-7 in Barcelona. The company’s comprehensive display solutions demonstrate TCL CSOT’s technological prowess and commitment to advancing the professional display industry through continuous innovation.
TCL CSOT presents its cutting-edge 5.5″ Industry’s Highest Tr Real-4K Projector, featuring an impressive Real-4K resolution (3840 * 2160), 800 PPI, and an industry-leading 6.2% Tr value. This innovative projector represents a significant breakthrough in Real-4K 1LCD Projector screen technology, offering unprecedented clarity and performance in a compact form factor.
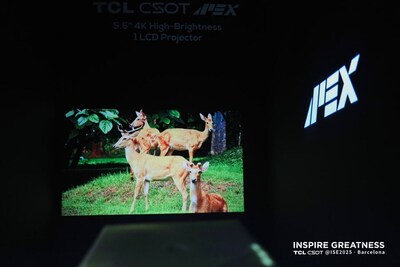
In the educational technology sector, TCL CSOT presents its comprehensive 10.95″ Educational Tablet solution, offering a complete integrated learning system. This all-in-one educational solution combines premium hardware features – including a crisp 1920 * 1200 resolution display and Active Pen with low latency and intelligent eraser functionality – with a sophisticated learning ecosystem powered by Android 13 OS. The system is enhanced by exclusive intelligent buttons for one-click wake-up of intelligent voice interaction and an independent system design that blocks external interference, ensuring a focused learning environment. This integrated approach, combining advanced display technology with dedicated educational features and content, represents TCL CSOT’s commitment to providing complete solutions for modern education.
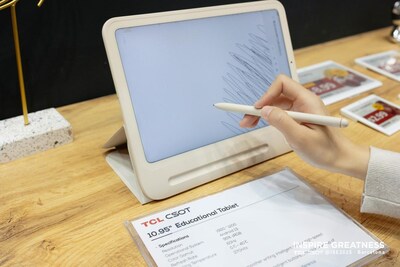
The company also highlights its innovative electronic paper display solutions, including the 31.5″ and 25.3″ Electronic Paper Signage and 13.3″ Electronic Paper Photo Frame. These displays utilize E Ink Spectra 6 technology, offering ultra-low power consumption with full-color display capabilities and wiring-free layout options. The electronic paper displays feature full ambient light reflection without requiring additional backlight sources, and come equipped with comprehensive communication interfaces including wireless WIFI/BT/4G and wired USD connectivity. With battery life ranging from 6 to 18 months depending on the model and eye protection features, these displays represent TCL CSOT’s commitment to sustainable and user-friendly display solutions.

Highlighting TCL CSOT’s commitment to sustainable development, these professional display solutions incorporate energy-efficient designs and eco-friendly materials. The company’s advanced local dimming technology and intelligent power management systems significantly reduce energy consumption while maintaining optimal display performance.
TCL CSOT’s presence at ISE 2025 underscores TCL CSOT’s dedication to pushing the boundaries of professional display technology. By combining cutting-edge innovation with practical applications, the company is creating solutions that not only meet current market demands but also anticipate future needs across various professional scenarios.
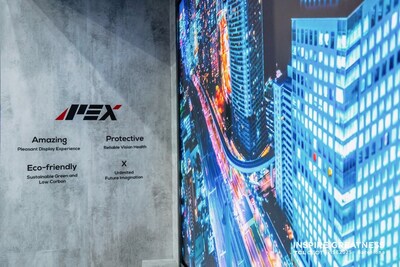
TCL CSOT’s APEX display technology brand continues to push boundaries in visual experience. APEX is built on the brand core of ” PACE TO APEX”. It is set to deliver pleasant display experience, reliable vision health, sustainable green and low carbon, and unlimited future imagination for users worldwide. This philosophy is perfectly exemplified in TCL CSOT’s professional display lineup. TCL CSOT is bringing the APEX vision to life in commercial and professional environments, setting new benchmarks for the industry while maintaining its dedication to user well-being and environmental responsibility.
Visit TCL CSOT’s YouTube for more information: https://www.youtube.com/@TCLCSOT
About TCL CSOT
TCL CSOT (TCL China Star Optoelectronics Technology Co., Ltd.), established in 2009, is committed to developing innovative technologies in the display industry. With a “3+2+N” – “3” representing TV commercial display, IT, and MC; “2” representing automotive and professional displays; and “N” signifying the exploration of more application scenarios – TCL CSOT continuously empowers customers’ needs with full-scenario product services. With manufacturing and R&D bases in Shenzhen, Wuhan, Huizhou, Suzhou, Guangzhou, and India, TCL CSOT has established 11 production lines. TCL CSOT’s business encompasses producing display panels from 1 to 115 inches. From LCD to OLED to MLED, TCL CSOT offers solutions across a wide array of applications, including TVs, mobile phones, tablets, laptops, monitors, automotive displays, XR (Extended Reality) devices, wearables, commercial displays, and other fields. The company leads the market in several of these areas and is dedicated to ongoing technological innovation, providing advanced products for customers and building a vibrant display industry ecosystem.
Strong stakeholder engagement towards Minesto’s first tidal energy Dragon farm in Hestfjord, Faroe Islands
GOTHENBURG, Sweden, Feb. 6, 2025 /PRNewswire/ — On Monday 3rd February, ocean energy developer Minesto welcomed Faroese stakeholders, authorities as well as the public to a seminar at the Nordic House in Torshavn. Martin Edlund, CEO of Minesto, presented the company’s vision for a sustainable energy system in the Faroe Islands, a 200MW buildout roadmap. The CEO of Faroese utility company Sev, Hákun Djurhuus took part in a panel to discuss the role of tidal energy in reaching a 100% renewable electricity generation as well as the collaboration with Minesto in developing the first Dragon farm (tidal array) in Hestfjord.
The Minesto event attracted a broad range of stakeholders, there among Faroese suppliers, energy companies, academia, authorities, politicians and the business community in general.
“With world class tidal stream resources, marine operations skills and strong local partners Faroe Islands are an ideal location for the first build out of Minesto’s dragon farms. Selecting Faroe Islands as our step-in market is for our also motivated by the strong political will and our partner SEVs determination to take the energy transition all the way to net-zero,” said Martin Edlund, CEO of Minesto.
“The collaboration with Minesto is of great value to us, together we are pioneering tidal energy. Our vision is to reach 100% sustainable electricity generation and tidal power with its predictable power has the potential to be the key enabler to reach the target,” commented Hákun Djuurhus, CEO of Sev.
Martin Edlund presented how Minesto’s dragons contribute to the Faroe Islands electricity mix by lowering total investment needs and providing security of supply to enable the renewable transition. Martin Edlund described the need for local collaboration and investments:
“The Hestjord Dragon Farm will be a first-of-a-kind tidal energy array. We actively work with Sev and the Faroese community with site development to plan for infrastructure and obtain vital permits. There is a genuine interest from Faroese investors and actors to become a part of this journey,” said Martin Edlund.
“Realising the Hestfjord dragon farm is a joint work, also outlined in the collaboration agreement between Sev and Minesto. Sev’s role in the Hestfjord project includes providing onshore grid infrastructure and of course, willingness to buy the electricity produced,” said Hákun Djurhuus.
“We congratulate Minesto for a successful event at the Nordic House, attracting many actors and stakeholders and creating an open and interesting discussion, also acknowledging the challenges ahead. We look forward to continued collaboration with Minesto regarding the realization of the world’s first tidal “Dragon” farm of 10MW in Hestfjord,” concludes Hákun Djurhuus.
For additional information, please contact
Cecilia Sernhage, Chief Communications Officer
+46 735 23 71 58
ir@minesto.com
This information was brought to you by Cision http://news.cision.com.
The following files are available for download:
|
PR 060225 Strong stakeholder engagement towards Minesto’s first tidal Dragon Farm |
Autohome Inc. to Announce Fourth Quarter and Full Year 2024 Financial Results on February 20, 2025
BEIJING, Feb. 6, 2025 /PRNewswire/ — Autohome Inc. (NYSE: ATHM; HKEX: 2518) (“Autohome” or the “Company”), a leading online destination for automobile consumers in China, today announced that it will report its financial results for the fourth quarter and full year ended December 31, 2024, before U.S. markets open on February 20, 2025.
Autohome’s management team will host an earnings conference call at 7:00 AM U.S. Eastern Time on Thursday, February 20, 2025 (8:00 PM Beijing Time on the same day).
Please register in advance of the conference using the registration link provided below. Upon registering, each participant will receive a set of participant dial-in numbers and a personal PIN, which will be used to join the conference call.
Details for the conference call are as follows:
Event Title: Q4 and Full Year 2024 Autohome Inc Earnings Conference Call
Registration Link:
https://register.vevent.com/register/BI255a7f8360974da5ae7ffaf90252fa85
Please use the conference access information to join the call ten minutes before the call is scheduled to begin.
Additionally, a live and archived webcast of the conference call will be available at http://ir.autohome.com.cn and a replay of the webcast will be available following the session.
About Autohome Inc.
Autohome Inc. (NYSE: ATHM; HKEX: 2518) is the leading online destination for automobile consumers in China. Its mission is to engage, educate and inform consumers about everything auto. Autohome provides occupationally-generated content, professionally-generated content, user-generated content, and AI-generated content, a comprehensive automobile library, and extensive automobile listing information to automobile consumers, covering the entire car purchase and ownership cycle. The ability to reach a large and engaged user base of automobile consumers has made Autohome a preferred platform for automakers and dealers to conduct their advertising campaigns. Further, the Company’s dealer subscription and advertising services allow dealers to market their inventory and services through Autohome’s platform, extending the reach of their physical showrooms to potentially millions of internet users in China and generating sales leads for them. The Company offers sales leads, data analysis, and marketing services to assist automakers and dealers with improving their efficiency and facilitating transactions. Autohome operates its “Autohome Mall,” a full-service online transaction platform, to facilitate transactions for automakers and dealers. Further, through its websites and mobile applications, it also provides other value-added services, including auto financing, auto insurance, used car transactions, and aftermarket services. For further information, please visit www.autohome.com.cn.
For investor and media inquiries, please contact:
In China:
Autohome Inc.
Investor Relations
Sterling Song
Investor Relations Director
Tel: +86-10-5985-7483
E-mail: ir@autohome.com.cn
Christensen China Limited
Suri Cheng
Tel: +86-185-0060-8364
E-mail: suri.cheng@christensencomms.com
Aker Horizons ASA: Invitation to presentation of fourth-quarter results 2024
FORNEBU, Norway, Feb. 6, 2025 /PRNewswire/ — Aker Horizons (OSE: AKH) will publish its financial results for the fourth quarter 2024 on Thursday 13 February 2025, at 07:00 CET. An online presentation of the results will be held on the same day at 08:30 CET.
Date: Thursday 13 February 2025
Time: 08:30 CET
Language: English
Link: https://akerhorizons.com/investors
Questions can be submitted prior to and during the presentation to ir@akerhorizons.com
For further information, please contact:
Jonas Gamre, Investor Relations, Tel: +47 97 11 82 92
Email: jonas.gamre@akerhorizons.com
Mats Ektvedt, Media, Tel: +47 41 42 33 28
Email: mats.ektvedt@corpcom.no
About Aker Horizons
Aker Horizons develops green energy and green industry to accelerate the transition to Net Zero. The company is active in renewable energy, carbon capture and sustainable industrial assets. As part of the Aker group, Aker Horizons applies industrial, technological and capital markets expertise with a planet-positive purpose to drive decarbonization globally. Aker Horizons is listed on the Oslo Stock Exchange and headquartered in Fornebu, Norway. Across its portfolio, the company is present on five continents.
This information was brought to you by Cision http://news.cision.com
